Introduction
Public service pensions have been a fundamental component of the British pension system in the post-war period. Because of the comparatively low level of state provision,Footnote 1 occupational pensions have fulfilled a vital role in protecting individuals against poverty, and the state as an employer has acted as a model of good practice. Provision has been near universal among public sector workers. The numbers covered have also risen during the post-war period through the growth in public employment, particularly for women in the 1960s. Consequently, retrenchment in this area is as important as state welfare reductions for a large number of British employees, and is significant for the overall generosity of the national pension system (Bridgen and Meyer, Reference Bridgen and Meyer2005).
Indicative of this importance has been the scale of the controversy generated by pension reform initiatives undertaken by Labour and Conservative/Liberal governments over recent years. In November 2011, the public sector trade unions called a coordinated strike against these reforms. The Trades Union Congress was most angry about the fact that public service employees should help to remedy, with immediate cuts to their pension entitlements, the large budget deficit incurred during the financial crisis of 2008. The unions argued that previous reforms had reduced projected pension spending, and that the systems were therefore affordable. In contrast, the Conservative/Liberal Coalition government insisted on further retrenchment, referring in particular to arguments of fairness; it was unfair that public sector employees should have access to much more privileged final salary pension schemes than workers in the private sector; it would be unfair to future generations not to reduce the enormous public debt, and public sector workers should therefore contribute; finally, it was unfair that the final salary schemes dominant in the public services tended to advantage the highest paid workers and therefore reform should redistribute resources within the sector.
Debate about the first two claims has been extensive. The unions have argued that typical public sector workers do not earn high wages, and that therefore their pensions are not as generous as often assumed in the public debate. In the academic world, Cutler and Waine (Reference Cutler and Waine2010) have shown that the bases for many of the comparisons between the public and private sector situations are at best dubious. Moreover, given the scale of the retrenchment in the private sector over recent years (Bridgen and Meyer, Reference Bridgen and Meyer2005), it is questionable whether public service pension reform should seek to emulate this model.
This article focuses on the government's final claim that the move away from final to average salary schemes will make them fairer for women and lower paid workers. This claim has legitimated change but was not fully tested by the Independent Public Service Pensions Commission, headed by Lord Hutton, pensions minister under the previous Labour government, and instated by the Coalition government to suggest reforms. The article will assess the scale of the proposed shift in retirement income away from richer public service workers and towards those at the lower end of the income scale. It calculates the entitlements for different illustrative workers before and after the reform. We use the schemes proposed by the government as their final position submitted to the public services trade unions in December 2011. For the local government scheme, no such position had been established at the time this article went to press. Here we use a combination of two reform options made by local government employers in September 2011 (Local Government Pension Scheme, 2011). The main local government union, the GMB, who are concerned to improve their impact on lower paid workers, has not approved these schemes.
We show what the changes mean for individuals if they are compared to their last wages and with a poverty line of 60 per cent of median wages. In addition, we will compare the pension losses workers in different professions across the public sector suffered, assessing whether, as intended, those on highest earnings should be affected relatively more than those on lower wages. The article shows that the reforms are indeed fair, if measured by the government's and the Public Services Pensions Commission's standards: the lowest skilled and women lose least and some even gain higher pensions without paying proportionately more, though retirement is delayed for all.
The article will first give an overview of the role of public service pension schemes for the protection after retirement of British citizens. This will show that the state has been a ‘model employer’, which was vital, particularly for women, considering the very low level of the state pension over decades. In the empirical part, we consider in turn equalisation of pensions on retirement between workers at different skill levels and by gender; which public service workers fare worst after the reforms; and assess changes in the cost of pensions.
Public service pensions in a liberal/statist regime
The common categorisation of Britain as a liberal type regime (Clasen, Reference Clasen2005: 1–5) underestimates the strong statist side of the British political economy. Indeed, in the post-war era the public sector became increasingly important. The nationalisation of key industries between 1945 up to the 1980s and the development of the welfare state meant that by 1976 public sector employment had reached 42 per cent of that in the private sector; it then fell to circa 25 per cent in the mid-1990s, but remained on that level until the mid 2000s (Meyer and Bridgen, Reference Meyer, Bridgen and Clasen2011: 160).
Public sector growth also meant an expansion of occupational pension rights and final salary schemes, as newly centralised unions negotiated pension settlements modelled on the civil service schemes across these industries (Hannah, Reference Hannah1986: 4–41; Russell, Reference Russell1991: 128–9; Chick, Reference Chick1998: 82). As a consequence, between 1956 and 1963 the share of active members of defined benefit pension schemes of all public sector employees increased from 61 per cent to 71 per cent (Meyer and Bridgen, Reference Meyer, Bridgen and Clasen2011: 165). Today, the main schemes are for the armed forces, the civil service, local government, the National Health Service (NHS), the police and teachers. Most schemes are funded on a pay-as-you-go basis, i.e. by the contributions of current working members and tax; only the Local Government Pension Scheme is funded (Thurley, Reference Thurley2010: 2–3). Employee contribution levels vary: the Armed Forces pay no contributions; civil servants have only paid either 1.5 or 3.5 per cent since the 1970s to finance dependants’ benefits; teachers, local government and NHS employees have paid an average of 6.5 per cent; and police and fire services pay between 9 and 11 per cent (Thurley, Reference Thurley2012a: 2–3).
At first, predominantly men benefited from nationalisation: the majority of adult women were not part of the labour force in the 1950s. The following three decades brought a transformation: the expansion of welfare-state-related employment went hand in hand with female labour force integration. Women's employment participation increased from 47 per cent in 1964 to 61 per cent in 1990 and many worked in education, health and social services. Between 1975 and 1990, welfare employment was the single biggest sector of employment for women (33 per cent of all female employees in 1975, 35 per cent in 1990), followed by retail and restaurants (24 per cent in 1975, 30 per cent in 1990). In addition, more jobs in welfare-state-related services went to women than men, and between 1979 and 2012 the share of male employees in the sector was only around 25 to 28 per cent (Meyer, Reference Meyer1997: 76, 108, 1992–2011; ONS, 2012, own calculations). Given that public services have always had much higher coverage rates for occupational benefits than the private sector, welfare state expansion explains the steady rise in female active members of occupational schemes from 1963 to 2007. Indeed, while women's position improved, men's in the private sector declined. Private pension scheme coverage for male employees had reached a peak at the end of the 1970s, at 70 per cent, from which it declined to 38 per cent in 2000. Meanwhile female membership of occupational schemes continued to rise until the mid 2000s, to about 41 per cent of all women in employment. The increase was caused by the expansion in the number of female members of public sector schemes. In 2007, there were more female active occupational scheme members overall (3.5 million) than male (3.2 million). (Bridgen and Meyer, Reference Bridgen, Meyer and Ebbinghaus2011: 277; Meyer and Bridgen, Reference Meyer, Bridgen and Clasen2011: 165).
The quality of all schemes was similar, they were final salary based and used an accrual rate of between 1/60th and 1/80th for the calculation of benefits, while also paying a tax free lump sum (Income Data Services, 2006).
Labour public services reform 1997–2009
When the Labour government developed its reform of public and private pensions in the early noughties, it also reformed public service pensions due to concerns about financial sustainability. These reforms increased the normal pension age for all new employees in the NHS, civil service and for teachers from sixty to sixty-five and abolished an early retirement rule for local government employees (Department for Communities and Local Government, 2006: 15). The normal retirement ages for the police and fire services had also been raised, albeit from lower levels, to sixty maximum; anyone wanting to retire earlier would not receive full benefits. The armed forces remained at fifty-five (Pensions Policy Institute, 2008: 8–9, 13). At the same time, final salary schemes remained, with the exception of the civil service, and the rise in pension age was to some extent offset by accrual rate increases in all schemes, and from 1/80th to 1/60th in the main schemes (Pensions Policy Institute, 2008: 29; Thurley, Reference Thurley2010: 7). However, overall these reforms did not do much for cost containment (Pensions Policy Institute, 2008: 9, 58–9).
Conservative/Liberal Democrat public service pension reform 2010–12
Before the Coalition government formed in 2010, the employers' associations, the Conservative and the Liberal Democratic parties and Adair Turner, head of the 2004/5 Pensions Commission, had already criticised public service pension reforms. They believed previous reforms were insufficient and that further savings were needed (Thurley, Reference Thurley2012b: 4–6).
Thus, the main aim of the Coalition government in 2010 was to cut spending over the long term and through ‘short-term savings . . . by September 2010’ (HM Treasury, Reference Treasury2010: 17). The chancellor announced that the rise in public service pensions would be indexed to the more slowly growing (Leyland, Reference Leyland2011) Consumer Price Index (CPI) instead of the Retail Price Index (RPI) from April 2011 (HM Treasury, Reference Treasury2010: 17), reducing the value of a pension by about 15 per cent (IPSPC, 2010: 9). To develop proposals for further savings was the task of the Independent Public Service Pensions Commission (Thurley, Reference Thurley2012b: 7).
Consideration of fairness within schemes developed in this context. Public service pensions must be affordable and sustainable, the Commission insisted, but they should also be adequate and not lead to poverty for long-term employees (IPSPC, 2010: 13–14). Under the current final salary system, ‘high flyers’ with rapid salary growth would receive a higher return on their pension savings than ‘low flyers’, whose salaries remain on a similar level throughout their career (IPSPC, 2011: 10, 23–4). They therefore proposed a move to average salary schemes, which could provide pensions on retirement approximately 35, 22 and 10 per cent higher respectively for workers with pensions at the first, second and third income decile than final salary schemes (IPSPC, 2010: 74).
How reliable are these conclusions in relation to the changes now proposed? We question and amend the Commission's calculations on two accounts. First, instead of using a single constructed generic scheme for pre- and post-reform, we use the actual schemes that have operated and the proposals for the four sectors included here. This provides a more accurate picture of the reform's likely impact and allows comparisons across sectors. Secondly, the Commission relied on the 2004/5 Pensions Commission, which assumed that pension adequacy should be judged on the extent to which retirement incomes replace last wages. It suggested a sliding scale, with an 80 per cent replacement rate for the lowest paid (Pensions Commission, 2005: 143, table 3) because they need a higher rate ‘to be assured of what society considers a minimum acceptable standard of living’ (2005: 134). However, even though citizens on low wages might still receive very low pensions, both commissions did not compare outcomes with a poverty line. This article uses replacement rates to assess the continuity of living standards in retirement, but to measure poverty risks also compares the public service pensions with 60 per cent median wages.
Methods
To assess the impact of the most recent public service pension reform, we compare the projected gross pensions of the new schemes proposed by government or employers, in the case of local government, for a range of constructed biographies with those that would have been produced by the schemes before the reforms Labour undertook in the mid-2000s (Appendix 1). This type of policy simulation isolates the pension system at one point in time, to assess its implications for the pensions of workers who spend their whole career under the system (Bridgen and Meyer, Reference Bridgen, Meyer, Meyer, Bridgen and Riedmüller2007).
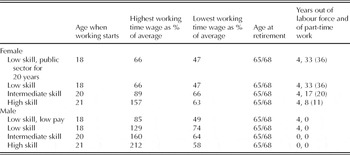
In constructing our biographies, our aim was to illustrate the impact of the reforms on individuals with working lives that differed in relation to pay and gender. Deciding on wage trajectories for these workers was particularly important given that a shift from final to average salary is the major design shift proposed for all the public sector schemes we consider. For this reason, we have modelled these trajectories closely on those constructed on the basis of skill levels by Disney et al. (Reference Disney, Emmerson and Tetlow2009) using Household Survey data (Appendix 1). All biographies’ wages start from a similar position, rising up to their highest point at the middle of their working lives, then reaching a plateau, before falling back by varying degrees up to retirement, depending on skill and gender (Table 1). The exception is the low skilled woman whose wages take a downward trajectory from much earlier in her working life. Our women spend less of their working lives in the labour market, have lower average life-time pay and experience periods of part-time work. We also include two additional biographies to test the impact of the reforms on those with very low pay and intermittent employment. A lower paid man is included who has two-thirds the pay of the low skilled male for every year of his working life. Among the women, we also include a low skilled female worker who spends twenty years in a public service pension and the rest in a NEST (National Employment Savings Trust) pension, i.e. the new occupational defined contribution pension schemes into which all employees without alternative arrangements will be auto-enrolled from 2012, with employers paying a mandatory contribution of 1 per cent until 2017, to be increased to 3 per cent after that (NEST, 2012).
Working life details of the illustrative biographies used in pension simulations

Notes: Employment in public sector is for ages 18–24, 27, 30–31 and 54–63.
The figure in brackets is the number of years of part-time work when retirement is at 68.
The projected gross pension on retirement for each worker is made up of their public service and the basic state pension. Given that the aim of the article is to assess the impact of reform of public service pensions, the basic state pension is calculated in the same way for the pre-reform and post-reform scenarios. Thus, on the basis of the reforms made as part of the 2007 Pensions Act, it rises in line with earnings with credits granted for caring periods of more than twenty hours a week. The number of qualifying years required for a full basic state pension was reduced to thirty for men and women and the minimum contribution rule for entitlement – the de minimis rule – was abolished (see Bridgen, Reference Bridgen, Rummery, Greener and Holden2010).
No individual receives the state second pension because in most cases they are contracted out due to their work-based pension. Because sixty-five is the earliest the basic state pension would have been available for our workers, we assess the total pension for our pre-reform biographies at this age. The total pension on retirement under the new proposals is calculated at age sixty-eight. We do this to enable comparison of the total pension of our individuals, but it means that the lost opportunity to retire at sixty is not reflected in our outcomes.
The total pensions on retirement of all individuals are compared to a relative poverty line, 60 per cent of median income and their final year salary. We then compare the pre- and post-reform pensions on retirement to assess the degree of change for the different types of worker and to determine how the risk of relative poverty has altered under the new system. We also express the total pension of the workers as a proportion of the total re-valued contributionsFootnote 2 paid by the worker during their working life. This allows us to assess changes in the amount individuals have to pay for their pensions, thus illustrating the impact of increases in contributions and changes in the normal retirement age. However, at the time of writing, full details of these increases had not been agreed, so we only include the changes proposed for the first year's operation of the new schemes (Appendix 1).
Finally, how do we operationalise fairness? First, we compare gross pensions before and after the reform in relation to the relative poverty line and to the last wages received before retirement. After a fair reform, no one would be at greater risk of relative poverty on retirement than before and replacement rates would not drop significantly. Secondly, we compare the pension change of lower and higher skilled workers in relation to the poverty line. After a fair reform, the lower skilled would lose proportionally less or gain more than the higher skilled in the same scheme. Thirdly, we compare the impact of the reform on the pensions of men and women, again assuming that a fair reform would not impose heavier losses on the economically more vulnerable women than men. Fourthly, we compare the pension of the same type of biography in different parts of the public sector. After a fair reform, the range between the largest and smallest pensions would be smaller than the range before. Finally, we compare how pension costs changed, by expressing each biography's yearly gross public service pension on retirement as a proportion of the total cost of pension contributions they have had to pay over their working life. After a fair reform, the relative costs for the higher skilled would go up proportionally more than those of the lower skilled. The following analysis is based on Tables 2–4.
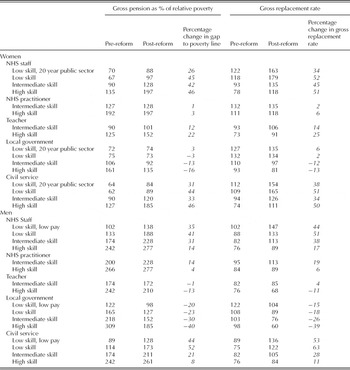
Change in pre- and post-reform public service gross pensions by sector

Source: Own calculations; relative poverty line: 60% of median wage.
The range of outcomes for similar biographies working in different parts of the public sector, as a percentage of the relative poverty line

Source: Own calculations. Range of outcomes is measured by subtracting the lowest pension for a biography as a percentage of the relative poverty line from the highest.
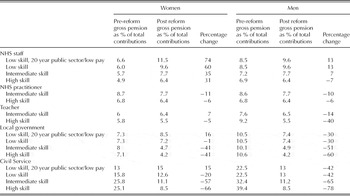
Change in cost of pre-reform and post-reform public service gross pensions by sector

Source: Own calculations.
A fair reform?
Relative poverty
The reform is fair when we compare pension change with the poverty line and last wages. Of the thirty-two individuals in our sample, twenty-three will have improved their pension levels in relation to the poverty line after the reform and four – the intermediately skilled NHS female staff, the female teacher, female civil servant and low skilled, low paid male civil servant – will move out of relative poverty (Table 2). Moreover, the gross replacement rate of twenty-five workers also rises. We should note that before the reform the women's replacement rates were above last wage levels already, with the exception of most of the highest skilled women. From this level, replacement rates will rise further after the reform, substantially in the case of the lower skilled workers. Only six local government workers and one male teacher will receive a lower replacement rate after the reform and of these only the pension of the intermediate skilled woman and of the low skilled man are projected to drop below the relative poverty line. However, as discussed, local government reform proposals are very likely to change, raising in particular the pensions of the lower skilled.
We can therefore say that regarding outcomes alone, disregarding longer working lives and higher pension costs, the reform represents gains for most.
Skills
The reform is also generally fair with regard to skill difference because in most cases, and particularly for men, it favours the lower skilled. All men in both NHS and the civil service schemes receive higher pensions, but the rise is proportionately greater for the low skilled (Table 2). In the NHS staff scheme, the high skilled man sees the gap between his pension and the poverty line rise by 14 per cent, while the gap for the low skilled male increases by 41 per cent. In the NHS practitioner scheme, the gap for the high skilled man increases by 4 per cent, but by 14 per cent for the intermediate skilled male. In the civil service, the gap for the higher skilled worker rises by 8 per cent in comparison with 52 per cent for the low skilled worker. The lower skilled intermediate workers in the NHS staff and civil service schemes do not gain as much, but their gap between pension and poverty line still increases by a greater amount than that of the high skilled workers in the same sector. Among teachers and local government male workers, the reform leads to decline. Yet, these are significantly smaller for the lower than the higher skilled workers. In particular, in local government for the high skilled worker the gap between pension and poverty line is projected to decline by 40 per cent, but only by 20 per cent for the low paid and 23 per cent for the lower skilled intermittant workers.
Regarding women, the pattern is different than that for men, because not only the lower skilled, but for the NHS, the teachers' and the civil service schemes the high skilled also fare well. The intermediate women's pensions increase significantly less in relation to the poverty line in these sectors. The situation for women in local government is comparable with that for men, most pensions decline in relation to the relative poverty line but the highest skilled workers lose most, while the intermittent, low skilled worker gains slightly and the low skilled woman loses very little.
Gender
Overall, the reforms are also fair because in relation to gender the economically more vulnerable women fare better than the men. In the NHS staff scheme, all pensions increase in relation to the poverty line, but more so for women. Even when women's pensions fall, such as in local government, they are less affected than are men. However, in the NHS staff and the civil service schemes the situation of lower skilled workers improves more for men than for women after the reform.
Sub-sectors
Our results suggest that the reform is generally consistent with the government's fairness criteria within the separate public sector schemes. However, they also highlight a type of fairness the government has not considered, that between similar employees in different sectors. A fair outcome here would make pension levels for workers with similar working histories more similar, as the most generous schemes moved closer to the least generous after the reform. This result is only partially achieved (Table 3). Instead, the range of outcomes for women generally declines, but it increases quite substantially for men across all skill levels. This result is primarily a consequence of the changes in the local government scheme so it should be treated cautiously. This scheme was for most of our biographies the most generous in the pre-reform period, but the cuts originally proposed by employers would have radically retrenched if compared with the other schemes, particularly for men. The civil service and NHS staff schemes have moved in the opposite direction, becoming more generous for all workers. It is possible that as negotiations between local government and employers continue this will also be the result in this sector.
Cost
Above we have come to the conclusion that the reform is fair if measured by the government's criteria, and we have shown that pension levels have risen for many employees, with lower skilled workers and women faring best. Retrenchment is thus mainly to be achieved through an increase of the retirement age by eight years and an increase in contributions. We therefore now turn to measuring how much the cost for the individual of the benefits has risen after the reform. We illustrate these by expressing the gross annual pension on retirement as a proportion of the total contributions paid to receive this pension; where this proportion declines, individuals are getting a lower pension in relation to their contributions. This is true in twenty-two of our thirty-two cases, but particularly for men and higher skilled workers (Table 4). Thus, all high skilled men and four out of five high skilled women see their pension decline as a proportion of total contributions, with higher skilled men in teaching, local government and the civil service and the female higher skilled civil servant faring particularly badly. However, intermediately skilled men and women in the civil service and local government also see a substantial fall in the projected pension they receive for their contributions.
There are important exceptions to this pattern: ten biographies, mostly lower skilled (six of ten), are projected to receive more gross pension for their contributions than before the reform. This is true in the NHS staff scheme, except for the high skill man. It is also the case for the female intermittent public sector workers in the local government and civil service schemes and the female intermediate skilled teacher. Overall, then, the cost of pensions for most is rising. However, the rise is proportionately higher for those on higher pay and only affects six of twelve low skilled workers. It can thus be judged as fair.
Fair cuts: a summary
The main finding of our article is that the recent reform, if implemented, will be fair by the government's standards. With few exceptions, change would improve the replacement rates of all employees, and their pensions would rise in relation to the poverty line. The risk of pensioner poverty would decline. However, employees work eight years longer and pay more than before for these improvements, with likely rises in contributions ahead. The low skilled, many of whom are women, gain most after the reform: their pensions increase by more than the higher skilled and their contributions rise less strongly. Considerable disparities remain between sub-sectors, but addressing this issue was not an avowed government objective for the reform.
In 1999, Jonah Levy argued that social democratic governments in Europe, faced with the need to contain welfare spending, had the option to turn ‘vice into virtue’. They would retrench `extravagances', such as generous early retirement schemes, and protect essential programmes (Levy, Reference Levy1999). Our findings suggest that the latest British public services pension reforms fit this description. If implemented, future recipients will have to save more for their pensions while taxpayers will pay less, but reforms will improve the situation of the most vulnerable. Thus, after a period during which private sector employers reduced substantially their occupational pension commitments, the state maintains its role as a model employer. Such a change by a Conservative/Liberal government is perhaps surprising, but the outcome is not an accident. Instead, by putting a former Labour minister, Lord Hutton, in charge of public services pension reform the government decided to foster a cross-party political consensus, and to invite proposals for reform informed by social democratic ideas of fairness. This decision followed the confirmation by the government of their Labour predecessors’ landmark pension reforms: the introduction of auto-enrolment into occupational pension schemes in the private sector from 2012 and the broadening in scope of the basic state pension as well as its re-linking to earnings from 2011 (Meyer and Bridgen, Reference Meyer, Bridgen and Clasen2011). Despite austerity, recent British pension reforms reflect a greater awareness of social inequality than many would have expected, and they have been built on more cross-party agreement than apparent at first sight.
Appendix. Details of the assumptions made in the simulations