Threat appraisal processes are of primary importance in the development of anxiety disorders (e.g., Mogg & Bradley, Reference Mogg and Bradley1998). The misappraisal of benign stimuli as signaling danger can lead to a proliferation of threat signals with fear-eliciting potential and presumably represents a core feature of pathological fear (e.g., Lissek et al., Reference Lissek, Powers, McClure, Phelps, Woldehawariat, Grillon and Pine2005; Lissek et al., Reference Lissek, Rabin, Heller, Lukenbaugh, Geraci, Pine and Grillon2009). For example, in the case of panic disorder, stimuli that co-occurred with an aversive panic attack can acquire fear-eliciting potential (e.g., Lissek et al., Reference Lissek, Rabin, Heller, Lukenbaugh, Geraci, Pine and Grillon2009). Threat value can thus become grafted onto a broad range of stimuli that may not be causally related to the panic attack, such as discrete events that incidentally co-occurred with the aversive panic attack, the environment where the panic attack occurred and harmless interoceptive sensations incidentally preceding the panic attack.
Selective conditioning procedures (also known as cue competition or stimulus competition procedures; for reviews see Blaisdell, Reference Blaisdell2003; De Houwer & Beckers, Reference De Houwer and Beckers2002; Shanks, Reference Shanks2010) can provide a valuable laboratory model for gaining insight into such threat appraisal and generalization processes. In a standard selective conditioning procedure, the unconditioned stimulus (US) is not preceded by just one, but by multiple conditioned stimuli (CSs). These CSs typically differ in degree of salience and/or in the degree of information they carry about the occurrence of the US. In the blocking procedure, for example, a CS of interest is trained together with another CS that already predicts the occurrence of the US. That is, pairings of two CSs with the US are preceded by pairings of only one of both CSs with the US (i.e., X+ followed by XY+ training). A large number of fear conditioning studies in non-human animals have demonstrated that fear responding in such procedure typically remains selective to the first CS and, accordingly, that afterwards fear responding to the newly added CS is low, despite its being paired with the aversive US (Kamin, Reference Kamin and Church1969; see e.g., Mitchell & Lovibond, Reference Mitchell and Lovibond2002, for a demonstration in human aversive conditioning). One theoretical interpretation is that the newly added, or blocked, CS does not provide any unique information about the onset of the US -over and above the information provided by the blocking CS- and is therefore treated as redundant. Accordingly, successful blocking presumably reflects a process that tracks the most likely candidate causes or predictors of danger and withholds fear responding to less likely ones (e.g., Blaisdell, Reference Blaisdell2003).
A disruption of such selective conditioning can cause non-specific fear, because in that case all stimuli that incidentally co-occurred with danger get tagged with high threat value. In line with this argument, a recent study provided evidence that a vulnerability factor for the development of anxiety disorders, trait anxiety, is associated with a deficit in selective conditioning (Boddez et al., Reference Boddez, Vervliet, Baeyens, Lauwers, Hermans and Beckers2012).
An important research question that remains largely unexplored is whether selective threat appraisal can be undone after it has been realized. Next to a failure to attain selective threat appraisal in the first place (Boddez et al., Reference Boddez, Vervliet, Baeyens, Lauwers, Hermans and Beckers2012), a loss of initially acquired selective threat appraisal might also promote the development of non-specific fear. The present experiments therefore focus on the maintenance of selective threat appraisal: Is it possible that a blocked CS, initially considered to be (fairly) safe, is later on reappraised as signaling danger, in the absence of further direct information about that CS? Assume someone experiences a panic attack in the shopping mall and initially attributes this panic attack selectively to the mild arousal-related sensations that occur at the onset of the panic attack. Such selective threat appraisal would block the shopping mall from gaining fear-eliciting potential. The current research question concerns whether the shopping mall can still come to gain fear-eliciting potential later on, without further direct experience involving the shopping mall.
We report two experiments in which we induced selective threat appraisal by means of a blocking procedure. In Experiment 1, we subsequently implemented a change in the informational value of the blocking CS. More precisely, we administered presentations of the blocking CS without the US (i.e., X+; XY+; X– training). In Experiment 2, we administered unsignalled US-only presentations following blocking training (i.e., X+; XY+; + training). We tested how these manipulations affected the maintenance of the selective blocking effect. In both cases, we hypothesized that experimental treatment would heighten the threat value of the blocked CS.
EXPERIMENT 1
Lovibond (Reference Lovibond2003) demonstrated that an ambiguous stimulus can be reappraised as being dangerous in a human aversive conditioning paradigm. Participants received presentations of two CSs preceding an aversive US (i.e., XY+), followed by unreinforced presentations of one of both CSs (i.e., X–). Results demonstrated that the unreinforced presentations led to increased threat value of the other CS (i.e., Y), relative to an appropriate control. Arguably, the mere compound training in the Lovibond study made the relation of both CSs to the US ambiguous (either only one of them, or both may lead to the US) and, evidently, such ambiguity leaves room for reappraisal. The present study aimed to investigate whether a stimulus initially considered being safe rather than ambiguous (i.e., a blocked stimulus) is also vulnerable to reappraisal.
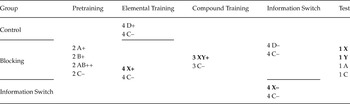
Table 1 summarizes the design of Experiment 1, which included three groups: a Control, a Blocking, and an Information Switch group. The Blocking and the Information Switch group both received blocking treatment: Presentations of the blocking CS with shock preceded presentations of both the blocking CS and the to be blocked CS with shock. Participants of the Information Switch group subsequently received presentations of the blocking CS without shock (i.e., extinction training), whereas participants of the Blocking group received an equal amount of presentations of a novel CS without shock as control treatment. We predicted that the blocked CS would be tagged with a higher threat value in the Information Switch group than in the Blocking group.
Design Summary of Experiment 1

Note
Alphabetic characters represent CSs; – indicates that no US was presented, + indicates that a US was presented, ++ indicates that a double US was presented; numerals refer to the number of trials. The blocking stimulus X and the blocked stimulus Y are represented in bold.
The Control group was included to verify whether a blocking effect could be induced with the present parameters. In the Control group two CSs were paired with shock, preceded by training in which a CS different from the blocking CS was paired with shock. The standard control for blocking indeed requires lower responding to a blocked CS than to a CS merely trained in compound (e.g., De Houwer & Beckers, Reference De Houwer and Beckers2002; Fanselow, Reference Fanselow1998; Kamin, Reference Kamin and Church1969). This is an elegant control for selective threat appraisal, because it singles out the effect of the preceding training with the blocking CS. As said, the causal or predictive status of a CS merely trained in compound is ambiguous: It may or it may not produce a shock when presented by itself. Accordingly, selective threat appraisal would be evident by lower threat appraisal of a blocked CS than of a CS merely trained in compound.
Threat appraisal was measured through shock-expectancy ratings. Cognitive models of anxiety indeed assume that threat appraisal is closely related to the expectancy of a harmful outcome (see General Discussion) and this dependent variable has been used successfully to assess threat appraisal in previous aversive conditioning experiments (e.g., Boddez et al., Reference Boddez, Vervliet, Baeyens, Lauwers, Hermans and Beckers2012; Chan & Lovibond, Reference Chan and Lovibond1996; Davey, Reference Davey1992).
Method
Participants
Participants were 48 first-year psychology students at KU Leuven (13 men and 35 women), aged between 18 and 22 years (M = 19.08, SD = 1.21), who took part in order to fulfill course requirements. They were randomly and evenly allocated to the three experimental groups, resulting in 16 participants per group. All participants gave informed consent and were briefed that they could refrain from participating at any time.
Apparatus and stimuli
We used a task similar to the one used by Boddez, Baeyens, Hermans, and Beckers (Reference Boddez, Baeyens, Hermans and Beckers2011). Participants engaged in a computer task in which they were confronted with a “shock machine”. Switches on this shock machine served as CSs and an electrocutaneous stimulus served as US. Participants were told that closing the switches could generate electric pulses. Accordingly, the task was clearly embedded in a causal scenario.
Six geometrical figures (a rectangle, a rhombus, a triangle, a hexagon, a star and a circle) represented the switches of the shock machine. Outlines of these figures, depicted in black and displayed side-by-side in a one-row table, and a schematic image of a man, were shown on all trials. On every trial, one or two of the geometrical figures were colorcolored with a designated colorcolor (red for the rectangle, purple for the rhombus, yellow for the triangle, blue for the hexagon, black for star and green for the circle). Maximal outer dimensions of the geometrical figures were 1.50 cm wide and 1.50 cm high.
A 2-ms electrocutaneous stimulus served as US, administered to the left wrist and delivered by a Digitimer DS7A constant current stimulator (Hertfordshire, UK) by way of a pair of 11-mm Fukuda Standard Ag/AgCL electrodes filled with K-Y Jelly. The intensity of the electric shock was set for each participant individually, at a level considered to be “unpleasant and demanding some effort to tolerate, but not necessarily painful”.
Stimulus sequence and stimulus presentation were governed by Affect 4.0 computer software (Spruyt, Clarysse, Vansteenwegen, Baeyens, & Hermans, Reference Spruyt, Clarysse, Vansteenwegen, Baeyens and Hermans2010).
Measures
Participants were asked to indicate their expectancy of shock on the basis of the colored geometrical figures. Participants used a computer mouse to indicate their trial-by-trial expectancy of shock on a semi-continuous scale from 0 (I am sure no electric stimulation will follow), over 50 (I do not know) to 100 (I am sure electric stimulation will follow). The rating scale appeared at the bottom of the screen, 1900 ms following CS onset, and stayed onscreen until participants selected a value and confirmed their choice by pushing the enter key on the keyboard. Response registration was governed by Affect 4.0 computer software (Spruyt et al., Reference Spruyt, Clarysse, Vansteenwegen, Baeyens and Hermans2010).
Procedure
At the start of the experiment, participants were asked for their informed consent. The experiment took place in a sound-attenuated experimental room. Following attachment of the electrodes and selection of shock intensity, participants received written instructions in Dutch. Instructions stated that they would be introduced to a shock machine with multiple switches that could be closed by a man that was depicted next to the shock machine. The switches would shine with their characteristic color every time they were closed and closing the switches could generate electric pulses. Participants were told that their task was to figure out the working of the shock machine and to make an effort to find out what would follow the closing of the switches: No electric shock, an electric shock or a double electric shock. Subsequently, the use of the rating scale was clarified. Additivity instructions, shaped after Mitchell and Lovibond (Reference Mitchell and Lovibond2002), were provided: “If two switches, when closed separately, produce an electric shock, then closing both of them at once produces a double electric shock”. Such additivity information is known to enhance blocking and is now a fairly standard procedure in human learning preparations (e.g., Beckers, De Houwer, Pineño, & Miller, Reference Beckers, De Houwer, Pineño and Miller2005; Boddez et al., Reference Boddez, Baeyens, Hermans and Beckers2011; Mitchell & Lovibond, Reference Mitchell and Lovibond2002). It was emphasized that the double shock were in fact two separate shocks with a brief pause in-between and it was made clear that the rating scale did not differentiate between a single and a double electric shock: 100 or I am sure electric stimulation will follow could refer to expecting an electric shock or to expecting a double electric shock. The instructions further stated that after rating their expectancy, participants had to press the enter button to confirm.
The contingency training started after the instructions. All participants underwent additivity pre-training, which is presentations of CSs that were followed by a single shock when presented individually (i.e., 2 A+ and 2 B+ trials) and followed by a double shock when presented together (i.e., 2 AB++ trials). As said, such additivity information is known to enhance blocking. An additional control CS, not followed by shock, was also presented during pre-training (i.e., 2 C– trials). Blocking training started after the additivity pre-training phase. In the Blocking and Information Switch groups, the elemental phase consisted of presentations of the blocking CS with shock (i.e., 4 X+ trials) and presentations of the control CS without shock (i.e., 4 C– trials). Training in the Control group consisted of presentations of a filler CS with shock (i.e., 4 D+ trials) intermixed with presentations of the control CS (i.e., 4 C– trials). The to-be-blocked CS was introduced in the subsequent compound phase and trained in conjunction with the blocking CS that had already been paired with shock in the Blocking and Information Switch group, but had not yet been paired with shock in the Control group (i.e., 3 XY+ trials). All groups received additional training with the control CS (i.e., 3 C– trials). The subsequent phase introduced the change in informational value of the blocking CS in the Information Switch group: Training consisted of presentations of the blocking CS, but now without shock (i.e., 4 X– trials), next to additional presentations of the control CS (i.e., 4 C– trials). Participants in the Blocking and Control groups received unreinforced presentations of the filler CS without shock (i.e., 4 D– trials), also intermixed with presentations of the control CS (i.e., 4 C– trials).
Trials were presented in individually randomized order during the training phases. During testing, CS Y was tested first, followed by CSs X, C and A in random order. The assignment of geometrical figures to CSs was partially counterbalanced. The rhombus served as CS B, the circle as CS C, the hexagon as CS A and the star as CS Y for all participants. CSs X and D were, however, completely counterbalanced.
Shocks were presented 1500 ms following CS offset. If a double shock was presented, the second shock was given 1500 ms after the first one. The inter-trial interval was 4500 ms.
Results
Greenhouse-Geisser corrections were applied if necessary. In line with suggestions of Kirk (Reference Kirk1995), we used mean square error terms and dfs appropriate for the specific contrast when testing planned comparisons.
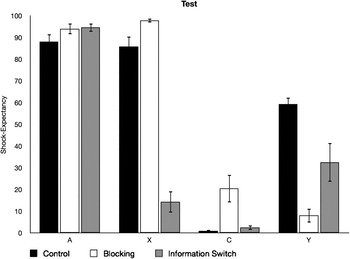
Figure 1 depicts the mean ratings by condition for each CS presented during testing. A 3 (Group: Blocking, Control, Information Switch) × 4 (CS: X, Y, A, E) repeated-measures ANOVA was performed on test data with Group as a between-subject factor and CS as a within-subject factor. The ANOVA revealed main effects of CS and Group, F(2.33, 105.28) = 139.93, p < .001, and F(2, 45) = 24.74, p < .001, respectively, as well as a Group × CS interaction, F(4.68, 105.28) = 25.56, p < .001.
Mean ratings at testing in Experiment 1. Error bars represent the standard error of the means.

Figure 1 suggests that a blocking effect was successfully attained with the present parameters. Planned comparisons indeed revealed lower ratings to blocked CS Y in the Blocking group than in the Control group, F(1, 30) = 60.14, p < .001.
As a manipulation check, we examined whether the change in informational value of the blocking CS X (i.e., extinction training) had an effect on the ratings of this CS. As illustrated in Figure 1, participants in the Information Switch condition indeed rated the effectiveness of the blocking CS X lower than participants in the Blocking and Control groups, respectively F(1, 30) = 167.38, p < .001 and F(1, 30) = 60.15, p < .001.
Our primary interest concerned the difference in anticipatory responding to the blocked CS Y between the Blocking and Information Switch groups. Results indeed revealed such a difference: Shock-expectancy ratings to the blocked CS Y were significantly higher in the Information Switch than in the Blocking group, F(1, 30) = 4.60, p < .05.
Discussion
A comparison of the Control and the Blocking group indicates that selective threat appraisal was successfully induced with the present parameters: Shock-expectancy to CS Y was lower in the Blocking than in the Control group, indicative of a blocking effect. Most interestingly, the Information Switch group showed higher shock-expectancy to CS Y than the Blocking group. This suggests that the change in informational value of the blocking CS led participants to question the inferred safety of the blocked CS. This represents a proof of principle that the maintenance of selective threat appraisal is not guaranteed: Stimuli present during a conditioning event that are initially tagged with a low threat value can still be tagged with a higher threat value later on. Whether such threat reappraisal is always maladaptive, however, is likely to depend upon the circumstances, an issue we return to in the General Discussion.
The present experiment is the first to demonstrate the reappraisal of a safe stimulus in a human selective conditioning procedure with an aversive outcome (in the absence of further direct training of that stimulus). Still, our results fit well with previous studies. Lovibond (Reference Lovibond2003) demonstrated that an ambiguous stimulus can be reappraised as being dangerous in a human aversive conditioning paradigm. Blaisdell, Gunther, and Miller (Reference Blaisdell, Gunther and Miller1999) and Boddez et al. (Reference Boddez, Baeyens, Hermans and Beckers2011) reported that blocking can be undone by unreinforced presentations of the blocking CS, respectively using rats as subjects in a fear conditioning paradigm and using humans as subjects in a contingency learning paradigm with a non-aversive outcome (but see Dopson, Pearce, & Haselgrove, Reference Dopson, Pearce and Haselgrove2009). These studies converge with the present data and conclusions.
Of note, several of the most influential models of associative learning (e.g., Rescorla & Wagner, Reference Rescorla, Wagner, Black and Prokasy1972; Wagner, Reference Wagner, Spear and Miller1981) suggest that threat reappraisal of the kind reported here is impossible because they conceive of blocking as an irreversible encoding deficit. However, van Hamme and Wasserman (Reference van Hamme and Wasserman1994) have revised the Rescorla and Wagner (Reference Rescorla, Wagner, Black and Prokasy1972) model and Dickinson and Burke (Reference Dickinson and Burke1996) have revised Wagner’s (Reference Wagner, Spear and Miller1981) model so that these models can explain reappraisal effects without abandoning the core idea that cue competition effects such as blocking reflect selective association-formation processes during the encoding phase. These models include the additional assumption that performance to a relevant but absent cue will change in the opposite direction to that of a presented cue with which it is linked through a within-compound association. These revised models do a good job at accounting for the present data. If X+ and XY+ trials are followed by X– trials, the representation of Y is retrieved on the X– trials because of the association formed between X and Y during the XY+ trials. The associative strength of X will decrease during the X– trials; consequently, the associative strength of the retrieved but absent cue Y will increase.
EXPERIMENT 2
With the present experiment, we aimed to explore whether other procedures might also lead to a reappraisal of stimuli initially considered to be (fairly) safe. Balaz, Gutsin, Cacheiro, and Miller (Reference Balaz, Gutsin, Cacheiro and Miller1982) reported that exposure to unsignalled US presentations following blocking treatment increased fear responding to the blocked CS in rats. More recently, Pineño, Urushihara, and Miller (Reference Pineño, Urushihara and Miller2005) found that inserting a retention interval between blocking treatment and testing has similar detrimental effects on the maintenance of fear selectivity in rats. Although these studies had a different research question, they clearly demonstrate that fear selectivity is not necessarily permanent. Noteworthy, the results of these animal studies bear striking resemblance to the return-of-fear phenomenon described in the extinction literature. Extinction, repeatedly presenting the CS without US, is known to result in a decrease in anticipatory responding. Such extinction is however not necessarily permanent, as illustrated by the return of anticipatory responding observed when administering unsignalled US presentations or when inserting a retention interval between extinction training and testing (e.g., Bouton, Reference Bouton2002; Hermans, Craske, Mineka, & Lovibond, Reference Hermans, Craske, Mineka and Lovibond2006).
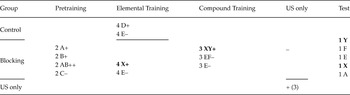
The present study tested the effect of US-only presentations on the maintenance of selective threat appraisal in human aversive conditioning, because the use of such procedure might again provide hints about how fragile selective threat appraisal is. Table 2 summarizes the design, which involved three groups: a Control, a Blocking, and a US-Only group. The Blocking and US-Only groups both received blocking treatment: Presentations of the blocking CS with shock followed by presentations of both the blocking CS and the to-be-blocked CS with shock. Participants in the US-Only group subsequently received unsignalled US presentations, whereas participants of the Blocking group received no such treatment. We predicted that the blocked CS would be tagged with a higher threat value in the US-Only than in the Blocking group. Like in Experiment 1, the Control group served to ascertain the basic blocking effect.
Design Summary of Experiment 2

Note
Alphabetic characters represent CSs; – indicates that no US was presented, + indicates that a US was presented, ++ indicates that a double US was presented; numerals refer to the number of trials. The blocking stimulus X and the blocked stimulus Y are represented in bold.
Threat appraisal was again measured through shock-expectancy ratings. We additionally measured skin conductance as an index of physiological arousal elicited by the CSs.
Method
Participants
Participants were 48 first-year psychology students at KU Leuven (11 men and 37 women, M = 19.08, SD = 1.21), who took part in order to fulfill course requirements. They were randomly and evenly allocated to the three experimental groups, resulting in 16 participants per group. All participants gave informed consent and were briefed that they could refrain from participating at any time.
Apparatus and stimuli
We used the same apparatus, CSs, and US as in Experiment 1. The same geometrical figures were used, but two more figures were added at the right end of the shock machine, a regular pentagon and an octagon (fill colors brown and grey).
Measures
Skin conductance responding was recorded through electrodes (similar as those used for shock administration) attached to the palm of the non-preferred hand. The skin conductance coupler (Coulbourn Instruments, model V71–23, Allentown, PA) provided a constant 0.5V across the electrodes. The analogue signal was passed through a 12 bit AD-converter, digitized at 10 Hz and registered by Affect 4.0 computer software (Spruyt et al., Reference Spruyt, Clarysse, Vansteenwegen, Baeyens and Hermans2010).
Contrary to Experiment 1, a fixed response window was imposed for the shock-expectancy ratings: Because of the skin conductance measurement, CSs were always presented for 8s. The shock-expectancy scale appeared at the bottom of the screen at the time of CS onset and receded from view at CS offset. Participants used a computer mouse to move a red dot from an invalid starting point on the utmost left of the scale to a value between 0 and 100. The value indicated at the end of the CS presentation was registered as measurement. The red dot was reset to the invalid starting point at the beginning of every trial. Whenever participants did not respond before CS offset, the red dot would remain at the invalid starting point, resulting in an empty data cell. Response registration was controlled by Affect 4.0 computer software (Spruyt et al., Reference Spruyt, Clarysse, Vansteenwegen, Baeyens and Hermans2010).
Procedure
The procedure was similar to that of Experiment 1, apart from aspects concerning the contingency training. We will therefore only highlight these differences.
In the present experiment, the control CS used in the pre-training phase (i.e., C–) differed from the control CS never paired with shock in the other training phases (i.e., E–). In addition, we trained a control compound without shock (i.e., EF–) in the compound phase to examine whether the effect of US-only presentations would remain specific to the blocked CS. In an extinction study of Dirikx, Vansteenwegen, Eelen, and Hermans (Reference Dirikx, Vansteenwegen, Eelen and Hermans2009), US-only presentations did not only increase shock-expectancy to the original CS, but also induced anticipatory responding to a control CS never paired with shock. Training of control compound EF– and subsequent testing of CS F allows to examine the extensiveness of the impact of US-only presentations, while additionally controlling for generalization decrement (i.e., anticipated increase in responding from compound training to elemental testing). Other than that, pre-training and blocking training proceeded as in Experiment 1. Following blocking training, in the US-only group, three unsignalled shocks (17s, 20s and 25s after CS-offset) were presented. No shocks were administered in the Blocking and Control groups.
The test phase followed offset of the last CS presentation by 28s in all groups. In the test phase, either the CS of interest (i.e., Y) or control CS F were tested first, in counterbalanced order, followed by testing of stimuli E, X and A in fixed order.
During training, trial order was randomized individually, with an inter-trial interval of 14 seconds. The assignment of geometrical figures to CSs A, B, C, and D was fixed. Assignment of geometrical figures to CSs X, F, Y and E was determined by a Latin square, such that geometrical figures that made up a compound were always separated by another geometrical figure in the display.
Results
Data were analyzed as for Experiment 1. We report only shock-expectancy data, because the skin conductance measure failed to result in any differential effects during the training and test phases.
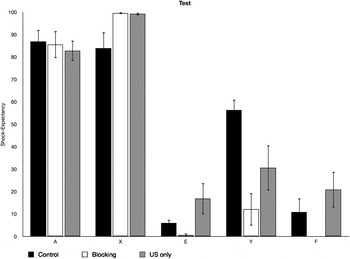
Figure 2 displays the mean ratings by condition for each CS presented during testing. A 3 (Group: Blocking, Control, US-only) × 5 (CS: Y, F, E, X, A) repeated-measures ANOVA was used to analyse the test data with Group as between-subject factor and CS as within-subject factor. The ANOVA revealed main effects of CS and Group, F(4, 160) = 142.2, p < .001, and F(2, 40) = 8.29, p < .001, respectively, and a Group × CS interaction, F(8, 160) = 4.63, p < .001.
Mean ratings at testing in Experiment 2. Error bars represent the standard error of the means.

Figure 2 suggests that a blocking effect occurred with the present parameters. Planned comparisons indeed revealed lower ratings to CS Y in the Blocking than in the Control group, F(1, 28) = 55.11, p < .001.
To evaluate our research question, we compared anticipatory responding to CS Y between the Blocking and US-only group. Shock-expectancy ratings to CS Y were significantly higher in the US-only than the Blocking group, F(1, 27) = 4.69, p < .05. Figure 2 moreover indicates that US-only presentations lead to increased ratings for control stimuli E and F as well. Ratings to CSs E and F were indeed significantly higher in the US-only than in the Blocking group, F(1, 28) = 4.69, p < .05 and F(1, 28) = 6.04, p < .05, respectively. This suggests that the increase in responding due to US-only presentations is not specific to the blocked CS.
Discussion
The lower shock-expectancy ratings to CS Y in the Blocking group than in the Control group indicate that a blocking effect was obtained. Most importantly, shock-expectancy ratings to CS Y were higher in the US-Only than the Blocking group, which suggests that the unsignalled US presentations caused the threat value of the blocked CS to increase. Experiment 2 therefore provides further support for the conclusion of Experiment 1: The maintenance of selective threat appraisal is not guaranteed.
These data replicate the results of Balaz et al. (Reference Balaz, Gutsin, Cacheiro and Miller1982) in a human aversive conditioning paradigm. Balaz et al. (Reference Balaz, Gutsin, Cacheiro and Miller1982) argue that this reinstatement-like effect supports a performance-based account of blocking. Performance-based models differ from traditional associative theories and their revisions in that they assume that information about different events is stored in memory in a noncompetitive manner and that this stored information can or cannot be subject to competition at the time of testing. That is, according to these models, blocking does not reflect a failure to learn about the added element, but is a reflection of interference during testing. Arguably, the US only trials alleviate this interference effect. More precisely, Balaz et al. (Reference Balaz, Gutsin, Cacheiro and Miller1982) hypothesized that US-only trials serve as a reminder that causes the subject to remember that the blocked CS had been paired with shock, supposedly facilitating retrieval of the US and therefore conditioned responding upon presentation of the blocked CS. The animal study of Balaz et al. (Reference Balaz, Gutsin, Cacheiro and Miller1982) did, however, not include control stimuli never paired with shock. Such control stimuli provide valuable information concerning the mechanism underlying the observed increase in responding. Importantly, in the present experiment, unsignalled shock presentations did not only heighten shock-expectancy ratings to the blocked CS in the present study, but also to control stimuli E and F never paired with shock. This demonstrates that the heightened threat appraisal due to US-only presentations did not remain limited to the blocked CS, an observation at odds with the hypothesis of Balaz et al. (Reference Balaz, Gutsin, Cacheiro and Miller1982).
We consider it appropriate to pay some closer theoretical attention to this observation. As said, the effects of unsignalled US presentations following extinction training have also been observed to be quite inclusive: In a study of Dirikx et al. (Reference Dirikx, Vansteenwegen, Eelen and Hermans2009) such treatment did not only reinstate shock-expectancy to the original CS, but also induced anticipatory responding to a control CS never paired with shock. The results of Dirikx et al. (Reference Dirikx, Vansteenwegen, Eelen and Hermans2009) are at variance with the dominant theoretical perspective (e.g., Bouton, Reference Bouton2002) on the reinstatement effect which, very much like the hypothesis of Balaz et al. (Reference Balaz, Gutsin, Cacheiro and Miller1982), assumes that US only trials following extinction wholly reactivate the original acquisition memories. Dirikx et al. (Reference Dirikx, Vansteenwegen, Eelen and Hermans2009) nonetheless argue their results to be in line with several other associative learning theories. Proposed explanations include summation of the (remaining) associative strength of the CS and reconditioning of the CS, respectively with associative strength of the training context or mediated through the training context (see Westbrook, Iordanova, McNally, Richardson, and Harris, Reference Westbrook, Iordanova, McNally, Richardson and Harris2002 for a detailed description of both mechanisms and supportive evidence). Dirikx et al. (Reference Dirikx, Vansteenwegen, Eelen and Hermans2009) additionally argued that the US only presentations might install a level of unpredictability, which might lead participants to expect shock following all test stimuli based on the adage better safe than sorry. Importantly, these explanations might also account for the increase in shock-expectancy to both the blocked CS and the control stimuli never paired with shock, observed in the present study.
General Discussion
The present experiments aimed to investigate the maintenance of selective threat appraisal in human aversive conditioning. In both experiments, we induced selective threat appraisal using the blocking procedure. Two very different treatments subsequently produced similar effects. In Experiment 1, unreinforced presentations of the blocking CS produced a heightening of the threat value of the blocked CS, initially considered to be (fairly) safe. In Experiment 2, unsignalled shock presentations heightened threat value of the blocked CS as well, although the effects of this manipulation did not remain limited to the blocked CS.
It has been argued that the blocking effect is an instance of inferential reasoning: The blocked CS is an unlikely cause of the US, because the relation between the blocked CS and the US disappears if one controls for the relation between the blocking CS and the US (e.g., Cheng & Novick, Reference Cheng and Novick1992). Accordingly, a disturbance of blocking can imply that unlikely causes of the US become tagged with a high threat value or, in other words, that threat becomes disconnected from the most likely causes of the US. Such threat reappraisal might be one of the mechanisms underlying the pathogenesis of non-specific fear. Further research is needed to investigate the plausibility and possible boundary conditions of the mechanism proposed here.
Whether or not threat reappraisal is actually maladaptive is likely to depend upon the circumstances. As discussed, selective threat appraisal presumably results from a process that tracks the most likely candidate causes or predictors of danger and withholds fear responding to less likely ones (Blaisdell, Reference Blaisdell2003). A loss or shift of selective threat appraisal might be indicative of an attempt to adapt to a changing environment, as contingencies between threat signals and actual danger may change over time. Stimuli that are unlikely to be related to danger at one point in time may be more likely to be related to danger at a future point in time. Threat reappraisal of stimuli initially considered to be (fairly) safe may therefore help to adapt fear behavior in changing situations. As such may threat reappraisal result from the same mechanism that also leads to selective threat appraisal: An attempt to tag the most likely causes or predictors of danger with high threat value (e.g., Blaisdell, Reference Blaisdell2003; Cheng & Novick, Reference Cheng and Novick1992). To the extent that reappraisal processes would however result in heightened threat appraisal of stimuli that are realistically non-dangerous, fear would become disconnected from actual danger.
In the present experiments, we measured the threat value of a stimulus through shock-expectancy ratings. Cognitive models of anxiety indeed assume that fear is closely related to the expectancy of a harmful outcome (see Chan & Lovibond, Reference Chan and Lovibond1996 for a selective review). Some researchers, however, argue that caution is warranted when using self-report measures like shock-expectancy. More precisely, these measures have been argued to lack objectivity, as they might be susceptible to effects of social desirability and experimental demand (e.g., Craske, Hermans, & Vansteenwegen, Reference Craske, Hermans and Vansteenwegen2006). This concern might not apply so strongly for the present experiments. Effects of social desirability and experimental demand presuppose the existence of fairly straightforward responses to the questions being asked. In contrast, the present research designs involve a certain degree of complexity and ambiguity: It is not clear why the desired response would be a heightening of shock-expectancy to the blocked CS in the present experiments. The skin conductance measure did not produce interpretable results, because, from acquisition training on, there was no differentiation in skin responding between any of the stimuli. Complex learning situations with plenty of stimuli can complicate the use of the skin conductance measure, as this measure is not always sensitive enough to pick up subtle differences between multiple stimuli (e.g., Chan & Lovibond, Reference Chan and Lovibond1996).
It has been argued that fear learning in a simple conditioning procedure, in which training is limited to a single CS+, is inherently adaptive, because the CS in such procedure signals actual danger (e.g., Baas, van Ooijen, Goudriaan, & Kenemans, Reference Baas, van Ooijen, Goudriaan and Kenemans2008 Michael, Blechert, Vriends, Margraf, & Wilhelm, Reference Michael, Blechert, Vriends, Margraf and Wilhelm2007). Complex training procedures with multiple CSs as used here, may do a better job at modelling more ambiguous real-life situations and may allow to study the transition from adaptive to maladaptive and non-specific fear (Beckers, Krypotos, Boddez, Effting, & Kindt, Reference Beckers, Krypotos, Boddez, Effting and Kindt2013). The present study can be seen as a step toward examining the role of threat appraisal and reappraisal in this transition.