Introduction
Ground-based telescopes detected methane concentrations of the order of parts per billion by volume (ppbv) in the atmosphere of Mars in 2003 (Mumma et al. Reference Mumma, Villanueva, Novak, Hewagama, Bonev, DiSanti, Mandell and Smith2009), a result confirmed by the Mars Express orbiter in 2004 (Formisano et al. Reference Formisano, Atreya, Encrenaz, Ignatiev and Giuranna2004). The methane is widely but heterogeneously distributed, with maxima of about 50 ppbv over the Elysium, Tharsis and Arabia Terrae regions in the northern hemisphere (Fonti & Marzo Reference Fonti and Marzo2010). Methane concentrations peak during Northern Hemisphere Summer and decline thereafter, with an inferred atmospheric lifetime of only ∼200 Martian days (Lefèvre & Forget Reference Lefèvre and Forget2009). A major science objective of forthcoming ESA and NASA missions is to identify the processes that produce, release and destroy methane on Mars.
Possible near-surface release mechanisms include dissociation from clathrate hydrates and desorption from mineral grains (e.g. clays and zeolites) in the regolith. Although near-surface microbial activity is the most prolific source of terrestrial atmospheric methane, its viability in the Martian near surface is limited by the presence of strong oxidants and the absence of liquid water, among other factors (Clark Reference Clark1998).
Potential deep subsurface methane release mechanisms include Fischer–Tropsch-type organic synthesis, thermal degradation of higher hydrocarbons, carbonate reduction, serpentinization reactions and microbial methanogenesis, which may form part of a deep biosphere (Fisk & Giovannoni Reference Fisk and Giovannoni1999). All of these processes are associated with hydrothermal activity on Earth (Jones et al. Reference Jones, Leigh, Mayer, Woese and Wolfe1983; Horita & Berndt Reference Horita and Berndt1999; McCollom et al. Reference McCollom, Ritter and Simoneit1999; Lowell & Rona Reference Lowell and Rona2002; Svensen et al. Reference Svensen, Planke, Malthe-Sørenssen, Jamtveit, Myklebust, Eidem and Rey2004). Hydrothermal systems are thought to have mediated some of the largest fluxes of methane to the atmosphere in Earth's history, triggering global warming across the Precambrian–Cambrian transition (Chen et al. Reference Chen, Wang, Qing, Yan and Li2009) and in the earliest Eocene (Svensen et al. Reference Svensen, Planke, Malthe-Sørenssen, Jamtveit, Myklebust, Eidem and Rey2004).
Sampling of methane on Mars is desirable for isotopic and other studies that may help to determine its origin. Although atmospheric concentrations are prohibitively low for direct sampling, it may be possible to extract methane from geological materials associated with extant or extinct hydrothermal activity. Such materials include direct precipitates and mineral alteration products generated by hydrothermal fluids. On Earth, methane and other fluids are trapped both within crystals (as ‘fluid inclusions’) and at crystal grain boundaries during the crystallization (or recrystallization) of calcite, quartz and other minerals along fractures and at discharge sites.
Given the likelihood that Martian methane is (or was originally) produced in or channelled through hydrothermal systems, hydrothermal mineral deposits represent attractive candidates for methane sampling sites on Mars. Such sites may also yield chemical and geological evidence of the mechanism of methane formation and associated biological activity; microfossils, microbial fabrics and microbially mediated mineral precipitates have all been recovered from hydrothermal systems on Earth (Parnell et al. Reference Parnell, Boyce and Blamey2010).
Objectives
We investigated the potential for sampling and detecting methane in hydrothermally precipitated calcite veins using an incremental-crushing mass spectrometry technique previously found to detect methane in serpentinites (Parnell et al. Reference Parnell, Boyce and Blamey2010), basalt (McMahon et al. Reference McMahon, Parnell and Blamey2012a) and artificial impact craters (McMahon et al. Reference McMahon, Parnell, Burchell and Blamey2012b). Key questions were the following:
(i) Can we detect methane in the calcite veins?
(ii) If so, can we detect higher quantities of methane in areas of greater methane generation?
Hydrothermal systems and methane-generating processes are heterogeneously distributed in the subsurface, requiring particular tectonic settings, rocks, minerals, fluids and pressure/temperature conditions. The quantity of methane trapped in minerals varies accordingly. If we can detect this variation, we can map the distribution of methane across localities and better understand its geological context and history.
(iii) Does particle size affect the sampling or analysis of gas?
A limited range of particle sizes may be available for in situ analysis on Mars. Europe's 2018 ExoMars rover, for example, will carry a Sample Preparation and Distribution System (SPDS) capable of crushing geological samples to a broad grain-size distribution up to 400 μm (Schulte et al. Reference Schulte, Widani, Hofmann, Bönke, Re and Baglioni2008). It is therefore of particular interest to establish how methane recoverability varies with particle size within this range.
(iv) Would the oxidizing conditions prevalent on Mars preclude or obscure measurements of ancient methane?
Oxidative weathering is an important process in the Martian near-surface and may affect the composition of interstitial fluids. Methane may be gradually oxidized or analytically masked by carbon species in higher oxidation states.
Method
Sampling programme
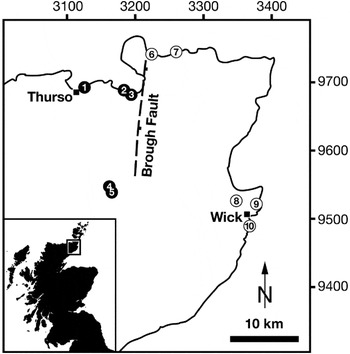
The hydrothermal calcite veins were sampled in the Devonian Orcadian Basin, northern Scotland (Fig. 1). The basin contains a non-marine, mixed fluviatile–lacustrine succession, in which the lacustrine rocks contain sedimentary carbonate and organic matter, both precipitated by algae (Donovan Reference Donovan1975; Trewin Reference Trewin1986). The organic matter has a high potential for hydrocarbon generation (Marshall et al. Reference Marshall, Brown and Hindmarsh1985; Parnell & Rahman Reference Parnell and Rahman1990). The thermal maturity of the organic matter varies from immature to overmature, i.e. varying quantities of hydrocarbons have been released in different areas (Hillier & Marshall Reference Hillier and Marshall1992). In particular, there is a contrast in thermal maturity across a major lineament, the Brough Fault, whereby rocks to the west are thermally mature and rocks to the east are mature to overmature (Hillier & Marshall Reference Hillier and Marshall1992).
Sample localities. West of the Brough Fault (black circles): (1) Thurso Bay; (2, 3) Castletown; (4, 5). Spittal. East of the Brough Fault (white circles): (6) Brough; (7) The Haven; (8) Ackergill; (9) Staxigoe; (10) Wick. Tick marks indicate the downthrown side of the fault.

Calcite veins are widespread and contain aqueous fluid inclusions of average diameter about 10 μm. The inclusions are primary, entrapped during calcite precipitation. Microthermometry of inclusions from calcite veins at Thurso yields homogenization temperatures (minimum trapping temperatures) of 110–135°C and final melting temperatures of −5 to −1°C, equating to moderate salinities up to 8 wt% NaCl equivalent. These are typical temperatures and salinity values for sedimentary basins (Goldstein & Reynolds Reference Goldstein and Reynolds1994).
The veins derive from aqueous remobilization of the sedimentary carbonate without associated organic matter (Milodowski et al. Reference Milodowski, Pearce and Basham2000). Organic material in the veins is therefore dominated by thermogenic hydrocarbons, whose abundance should reflect the maturity of their source rock. Thus, methane should be more abundant in veins to the east than to the west of the Brough Fault; this provides a test for question (ii) above.
Some localities exhibit secondary reddening due to late oxidative weathering, an evidently ubiquitous process on Mars. Entrapped fluids, particularly at grain boundaries, may therefore be altered. These localities were sampled as an approximate Mars analogue with which to address question (iv) above.
Crush-fast scan (CFS) mass spectrometry
Mass spectrometry was used to investigate question (i) above. Calcite vein samples were first separated from the carbonate matrix. The samples from Staxigoe (Fig. 1) were then fly-pressed to obtain a mixture of grain sizes and sieved through four different mesh sizes – 63, 125, 212 and 425 μm – in order to investigate question (iii) above. These sieves were chosen to include the range of grain sizes generated by the crushing station intended for the ExoMars SPDS (Schulte et al. Reference Schulte, Widani, Hofmann, Bönke, Re and Baglioni2008). Samples from the other localities were fly-pressed to obtain match-head-sized grains. All samples were then washed for about 5 minutes in H2O2 to remove surface organics, rinsed in deionized water, and dried at room temperature.
Analysis of fluid inclusion volatiles was performed by the CFS method (Norman & Moore Reference Norman and Moore1997; Moore et al. Reference Moore, Norman and Kennedy2001; Parry & Blamey Reference Parry and Blamey2010), which offers very low detection limits (Blamey et al. Reference Blamey, Parnell and Longerich2012). Samples were loaded into a crushing chamber under an ultra-high vacuum (approximately 10−8 Torr) and incrementally crushed, liberating volatiles. Two to ten bursts of fluid (up to ∼2×10⁻¹¹ l) per sample were released into the chamber, remaining there for 8–10 analyser scans before removal. Bursts were analysed for H2, He, CH4, H2O, N2, H2S (or O2), Ar, CO2, C2H4, C2H6, SO2, C3H6, C3H8, C4H8, C4H10 and benzene using Pfeiffer Prisma quadrupole mass spectrometers operating in fast-scan, peak-hopping mode. Calibration was checked against commercial standard gas mixtures, atmospheric capillary tubes and three fluid-inclusion standards as described by Norman & Blamey (Reference Norman and Blamey2001). Instrumental blanks are also analysed routinely.
The amount of each species was calculated by proprietary software to provide a quantitative analysis, but crushing does not liberate all the entrapped gas from samples, so data are generated as molar percentages rather than moles. To cancel the dependence of individual percentages on irrelevant species, we report methane abundances as the ratio (mol% CH4)/(mol% CO2) and oxygen abundances as (mol% O2)/(mol% N2) (hereafter CH4/CO2 and O2/N2, respectively).
Results
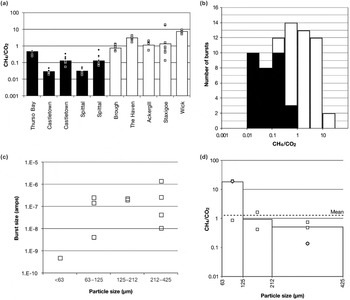
Methane was detected in all samples (Fig. 2(a)). Castletown (west of the Brough Fault) yielded the lowest weighted average CH4/CO2 (2.9×10⁻²); Wick (east of the Brough Fault) yielded the highest (7.2). Samples west of the Brough Fault consistently yielded lower weighted average CH4/CO2 than samples east of the fault (Fig. 2(b)). Higher n-alkanes were also present in trace amounts that could not be quantified.
(a) Composition of gas in hydrothermal calcite. CH4/CO2 molar ratio recorded by individual bursts (squares) and locality means weighted by burst volume (bar chart). Localities west of the Brough fault are depicted in black; those to the east are white. Staxigoe data are from particle sizes 63–425 μm. (b) Gas composition: dichotomy across Brough Fault. Histogram of CH4/CO2 molar ratios for all individual bursts (except the Staxigoe fraction below 63 μm, which yielded too little gas for analysis). Localities west of the Brough fault are depicted in black; those to the east are white. (c) Fluid burst sizes from three particle-size fractions. Calcite from Staxigoe was crushed and sieved before CFS. The individual bursts are represented as squares. One amp is generated by approximately 10−3 moles of gas. (d) Molar CH4/CO2 ratios in three particle-size fractions. The weighted mean ratio for each size fraction is presented as a bar; the individual bursts are presented as squares (or diamonds where points overlap). The dashed line represents the mean of all CH4/CO2 measurements of particles between 63 and 425 μm, weighted by burst size.

The four Staxigoe size fractions showed trends in both recoverable gas quantities and CH4/CO2 ratio. Burst sizes increased with particle size as shown in Fig. 2(c). Grains under 63 μm released an insufficient quantity of gas, which was compositionally dominated by the instrumental blank. Of the remaining three fractions, the 63–125 μm grains yielded the highest weighted mean CH4/CO2 ratio (18.3) followed by the 125–212 μm (0.9) and the 212–425 μm (0.5). Individual bursts are shown in Fig. 2(d).
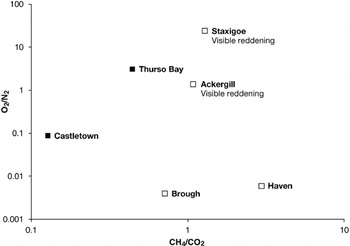
Oxygen (O2) contents ranged from trace levels up to around 80% of liberated fluid. Higher oxygen contents were associated with visible oxidative weathering (surface reddening) of samples in the field, which is especially advanced in Ackergill and Staxigoe. However, no clear correlation between oxygen and methane content was observed (Fig. 3).
O2/N2 plotted against CH4/CO2 weighted mean ratios from six localities. Localities west of the Brough fault are depicted in black; those to the east are white. Staxigoe data are from particle sizes 63–425 μm.

Discussion
Objectives
(i) Can we detect methane in the calcite veins?
The detection of methane in all samples demonstrates that methane is readily available for extraction and analysis from hydrothermal veins on Earth and may be similarly available on Mars. This result is consistent with previous work showing that the CFS technique can yield ancient methane from hydrothermal minerals (e.g. Moore et al. Reference Moore, Norman and Kennedy2001).
(ii) Can we detect higher quantities of methane in areas of greater methane generation?
The contrast in burial depth, and hence thermal maturity, across the Brough Fault provided a test with which to approach this question. Methane was consistently found in greater relative abundances in calcite on the more thermally mature east side of the fault, where the degradation of organic material has proceeded further and liberated more gas. Thus, the CFS technique is sensitive enough to map the distribution of methane between ancient hydrothermal calcite localities, which are preserved over geological time and yield information about geological history.
(iii) Does particle size affect the sampling or analysis of gas?
Analysis of the sieved Staxigoe calcite samples revealed that particle size limits the quantity of recoverable gas and influences the measured CH4/CO2 ratio.
The finest size fraction (<63 μm) did not yield sufficient gas for analysis, having already liberated its fluids during crushing and milling. This result provides an approximate lower limit to the particle size required for CFS, which is low enough not to compromise the utility of the technique on Mars. About 75–85% of the powder generated from basalt by the jaw crusher intended for the ExoMars rover falls within the range of 63–400 μm (Schulte et al. Reference Schulte, Widani, Hofmann, Bönke, Re and Baglioni2008). All samples analysed within this range yielded sufficient gas for analysis.
There was a clear increase in CH4/CO2 ratio with decreasing particle size, indicating that carbon dioxide was lost faster than methane during comminution. This could suggest a consistent difference in CH4/CO2 ratio between grain boundaries and inclusions. Most inclusion fluid is present in relatively large (10s of μm) inclusions, which are opened and evacuated when grains are broken, whereas finer samples, having already lost these large volumes of fluid, yield proportionally more grain-boundary gas when crushed. Thus, a plausible interpretation of our data is that the CH4/CO2 ratio of grain-boundary fluid was higher than that of inclusion fluid. Information of this kind may be used to infer the evolution of fluid composition in a hydrothermal system and hence the sources of fluids.
(iv) Would the oxidizing conditions prevalent on Mars preclude or obscure measurements of ancient methane?
Reddening by oxidative weathering was commonly observed in the field. However, there was no association between the ratios O2/N2 and CH4/CO2, which can be taken as indicative of oxygen abundance and carbon oxidation state, respectively. In particular, several samples were highly enriched in both oxygen and methane, notably those from Staxigoe, where interstitial gas was found to be richer in methane than grain boundary gas (see (iii) above). Therefore, no evidence was found to suggest that oxidative weathering affected the composition of interstitial fluids.
Conclusions: application to Mars
We have demonstrated that an incremental-crushing mass spectrometry technique, potentially adaptable to Mars rovers, can release methane from hydrothermal mineral samples and detect variations in quantity related to the ancient geological history of the area. Given the potential for isotopic analysis of methane and for the recovery of other biomarkers from hydrothermal sites, the technique deserves consideration for Mars if such sites can be identified.
There is now confidence that hydrothermal deposits occur at the Martian surface. This confidence is based on a range of criteria that could point towards hydrothermal activity, including volcanic activity, magmatic-driven tectonism, impact cratering in icy terrains, hydrous alteration of minerals and typical hydrothermal mineralogies (Schulze-Makuch et al. Reference Schulze-Makuch, Dohm, Fan, Fairén, Rodriguez, Baker and Fink2007). Mound-shaped structures in Arabia Terra are proposed as hydrothermal spring deposits (Allen & Oehler Reference Allen and Oehler2008); alteration zones may be developed around fault zones in Valles Marineris (Davatzes & Gulick Reference Davatzes and Gulick2007) and the haematite deposits found in Meridiani Planum by MER rover Opportunity could reflect regional heating (Golden et al. Reference Golden, Ming, Morris and Graff2008). MER rover Spirit also encountered hydrothermal deposits in Gusev Crater (Squyres et al. Reference Squyres2008).
The technique could be coupled with an isotopic analysis of the carbon in methane, perhaps by the adaptation of existing mass spectrometry techniques for Mars (e.g. the Sample Analysis at Mars package flying on NASA's Mars Science Laboratory). On Earth, biological fractionation generates anomalously light carbon which distinguishes biogenic methane from abiogenic methane. However, interpretation of isotopic compositions, which is not always straightforward on Earth, will be particularly challenging on Mars. Although the carbon-isotopic compositions of Martian atmospheric CO2, sedimentary carbonates and primary magmatic carbon have been constrained within broad limits using meteorites (Grady & Wright Reference Grady and Wright2006), more work is needed to understand the planetary carbon cycle and possible sources of fractionation within it. In any case, additional measurements including ratios of light hydrocarbons and hydrogen isotopes would be required to demonstrate fluid biogenicity. These data may also be recoverable from hydrothermal mineral deposits, alongside a range of other possible biomarkers (Parnell & Baron Reference Parnell and Baron2004).
Acknowledgements
Fluid inclusion microthermometry data were measured by Jason Kelly. Alison Wright provided samples from Spittal. Sean McMahon's PhD studentship is funded by the STFC. The paper was improved by comments from Dirk Schulze-Makuch and one anonymous reviewer.