I. INTRODUCTION
Most of the niobium nitride (NbNx) studies were focused on their superconducting properties.Reference Chockalingam, Chand, Jesudasan, Tripathi and Raychaudhuri1, Reference Wong, Sproul, Chu and Barnett2 Besides their excellent superconducting properties, interests have recently grown in studies related to their mechanical properties.Reference Benkahoul, Martinez, Karimi, Sanjines and Levy3 NbNx films exist in many crystal structures, including γ-Nb4N3 (tetragonal), δ-NbN (face-centered cubic), δ′-NbN (hexagonal), ε-NbN (hexagonal), η-NbN (hexagonal), and β-Nb2N (hexagonal). NbNx films could be found in any of these phases and/or in most cases present a mixed phase composition.Reference Oya and Onodera4 The cubic phases of NbNx are softer than the hexagonal phases (β-Nb2N, δ′-NbN).Reference Sanjines, Benkahoul, Papagno, Levy and Music5
Several deposition techniques were used to fabricate NbNx thin films such as ion beam assisted deposition,Reference Gotoh, Nagao, Ura, Tsuji and Ishikawa6 reactive magnetron sputtering,Reference Olaya, Rodil and Muhl7 and pulsed laser deposition (PLD).Reference Senapati, Pandey, Nagar and Budhani8, Reference Sundgren and Hentzell9 In PLD, experimental parameters can easily be modified, making it a highly flexible thin-film growth technique suitable for fabrication of many types of oxides, nitrides, carbides, and complex compounds. For NbNx films deposited by PLD, the composition and structural properties of the films are mainly influenced by nitrogen pressure, laser power, and substrate deposition temperature. Many researchers reported on the influence of PLD deposition parameters, such as background gas pressure and substrate temperature on the structure of NbNx thin films deposited on MgO and Si substrates.Reference Benkahoul, Martinez, Karimi, Sanjines and Levy3–Reference Hassan, Oguz, Ufukepe, Myneni and Elsayed-Ali10 The importance of fabricating NbNx thin films on Nb substrate is because of their application in high electric field superconducting radio frequency cavities used in nuclear physics. Other important applications for NbNx coatings on Nb are for potentially increasing surface hardness and/or providing a barrier layer for hydrogen diffusing into Nb.
In this work, a series of experiments have been performed to study the effect of deposition temperatures in the temperature range 250–850 °C on structural, phase formation, and mechanical properties of NbNx films on Nb prepared by PLD.
II. EXPERIMENTAL
Nb substrates of 8.6 × 6.6 × 0.7 mm were cut using wire electrodischarge machining from a Nb slice of ingot. The Nb slice surface was mechanically polished using alumina (Al2O3) prior to further cutting into smaller pieces. The Nb samples were etched using the buffered chemical polishing method as described in Ref. Reference Hassan, Oguz, Ufukepe, Myneni and Elsayed-Ali10. Subsequent to cleaning, the substrate was attached to a heater and positioned at ∼6 cm from the target. An atomic force microscopy scan revealed that the root-mean-square (RMS) surface roughness of the Nb substrate was in the order of 0.6 nm for 2 × 2 μm2 scan area. The Nb sample was degassed for several hours at ∼800 °C in the ultra high vacuum (UHV) chamber under a base pressure of ∼1 × 10⁻⁹ Torr prior to PLD.
A nanosecond pulsed neodymium-doped yttrium aluminium garnet; Nd:Y3Al5O12 (Nd:YAG) laser (repetition rate 10 Hz, pulse duration ∼40 ns) operating at λ = 1064 nm was used to grow NbNx films on the Nb substrate. The laser beam was focused with a 50-cm focal length lens at 45° onto Nb metal target (99.99% pure). The Nb target was rotated during the deposition to avoid formation of particulates in the film with a speed of (25 rpm). The laser energy was kept constant at 15 J/cm2 during the deposition. An ultrahigh purity nitrogen gas (99.999%) was introduced in the chamber to achieve a constant background pressure in static conditions at 100 mTorr. Different substrate temperatures in the range of 250–850 °C were used. The substrate temperature was measured using a chromel–alumel (K-type) thermocouple that was mechanically attached to the substrate surface. Temperature can be measured reproducibly with an estimated accuracy of ±20 °C at 250 °C and ±50 °C at 850 °C; this accuracy is limited by the sample contact to the heater surface and the temperature gradient across the heater. An electron probe microanalyzer (EPMA) equipped with point scan from Cameca SX100 (CAMECA, Société par Actions Simplifiée, Gennevilliers Cedex, France) was used to determine the chemical composition (N/Nb = x) of the NbNx samples.
Bruker-AXS (Bruker AXS Inc., Madison, WI) three-circle diffractometer equipped with a SMART Apex II CCD detector and graphite-monochromated CuKα radiation were used for x-ray diffraction (XRD) measurements. The morphology of the films was examined using a Digital Instruments Dimension 3100 atomic force microscope (AFM) and a JEOL JSM-6060 LV scanning electron microscope (SEM). All AFM images were taken in air using tapping mode, while the SEM was operated at an accelerating voltage of 30 kV. The average thickness of the 250 °C processed film is ∼45 nm as calibrated by the cross-sectional SEM.
The nanomechanical properties of the NbNx thin film were measured using a Nanoindenter XP from Agilent Technologies (Agilent Technologies, Inc., Santa Clara, CA). The nanoindenter XP is equipped with a Dynamic Contact Module (DCM II) with a three-sided diamond Berkovich indenter. Tests were performed with and without Continuous Stiffness Measurement (CSM) approach. Each specimen was tested in both DCM II and XP modules with and without the CSM engagement. For all tests, the indenter tip approached the surface from a distance of 1000 nm at a rate of 10 nm/s. The depth limit was set as 1000 nm for XP and 500 nm for DCM tests. For tests with the CSM mode off, multiple steps of cyclic loading approach were used to capture the film property from depth below 10 nm. The surface approach sensitivity was set at 20%. Loading time was varied to keep the loading rate as uniform as possible for different tests. The depth limit was varied from sample to sample to obtain data for depth within 10% of the film thickness. Oliver–Pharr analysisReference Oliver and Pharr11 is used to measure the contact stiffness from the load and displacement data during the unloading segments of the tests to determine the mechanical properties of the samples.
III. RESULTS AND DISCUSSION
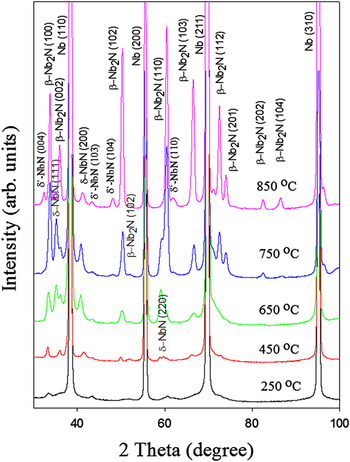
Figure 1 shows the XRD patterns of the NbNx films on Nb prepared at different substrate deposition temperatures. The diffraction peaks of NbNx films and the Nb substrate are labeled in the figure. XRD diffraction of the Nb substrate exhibits crystallographic planes of (110), (200), (211), and (310) orientations. As temperature increases from 250 to 850 °C, the degree of crystallinity of the NbNx film increases.Reference Alfonso, Buitrago, Torres, Marco and Santos12 It is noted that increasing the temperature results in textured film structure. It is also observed that increasing the substrate temperature from 650 to 850 °C changes the phases of the film from mixed (cubic + hexagonal) to hexagonal phases (β-Nb2N + δ′-NbN). The δ-NbN cubic phase was detected in the substrate temperature range of 450–850 °C. The reflections of the orientations (111), (200), and (220) of the cubic δ-NbN phase were present at the initial growth of the crystallized NbNx with highest intensities at 750 °C. Literature reports indicate the formation of cubic and hexagonal phases of NbNx films at the same temperature range.Reference Gotoh, Nagao, Ura, Tsuji and Ishikawa6, Reference Chaudhuri, Nevala, Hakkarainen, Niemi and Maasilta13
XRD patterns of NbNx thin films deposited on Nb substrate at different substrate temperatures.

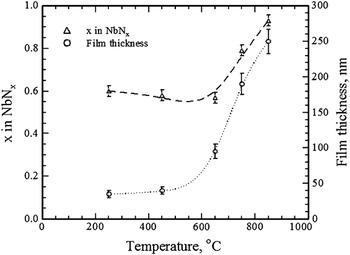
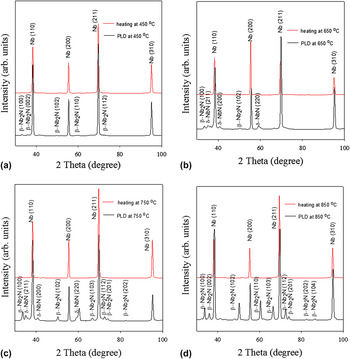
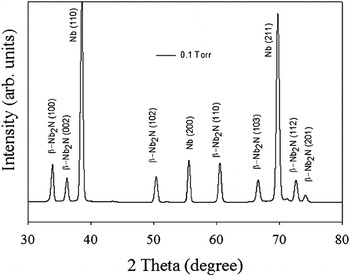
It is possible that surface nitridation occurs during the deposition process due to the heating of the substrate, and hence, the role of PLD as the sole source of nitride film growth will be compromised. Figure 2 depicts film thickness versus temperature and the stoichiometric coefficient x in NbNx as a function of deposition temperature using EPMA. The figure is produced from nanoindentation testing and the results were confirmed from SEM cross-sectional measurements. It is particularly interesting to notice that the film thickness surged to twice as much and even more for temperatures above 650 °C. We suspected that nitridation is inexorable and is competing with film growth due to PLD. We performed separate sets of experiments to examine the nitridation effect in the absence of PLD for all temperatures between 250 and 850 °C at the same 100 mTorr nitrogen background pressure and the same exposure time to molecular nitrogen during PLD, which was 60 min. The results of these tests for nitridation (red) as well as those in the presence of PLD (black) of four of these temperatures are shown in Fig. 3. The XRD plots of Fig. 3 indicate that no NbN peaks were identified due to heating for all temperatures between 250 and 850 °C in 100 mTorr N2 for 60 min, only bulk Nb crystal structure was obtained. Therefore, we can rule out the possibility that the NbNx growth detected in the PLD experiment was due to thermal heating under the considered molecular nitrogen gas background for the exposure time used. Nevertheless, the surge in film thickness (∼250 nm) for temperatures over 650 °C is palpable. We believe that for film thickness ∼45 to ∼ 100 nm, i.e., the data for temperatures below ∼650 °C, the NbNx film growth is due to PLD deposition alone and beyond that is due to formation of atomic nitrogen in the PLD plasma coupled with its enhanced reactivity with Nb. The reactive PLD process involves the formation of atomic nitrogen species in the plasma. These atomic species are highly reactive compared to molecular nitrogen and interact with the ablated Nb plume and the surface. The higher the substrate temperatures, the higher the amount of atomic nitrogen is incorporated into the films.Reference Desbiens and El Khakani14 The Nb plume in PLD contains energetic species that include atoms and ions that can range in energy from the eV range to thermal, depending on the laser conditions used. The Nb–N system as a result of nonequilibrium PLD presents several nitrides and the corresponding phase diagram is very complex, as the nitrogen content in the NbNx system is varied. Various interrelated types of crystallographic structures are encountered, in particular it is not easy to control phase composition.Reference Musenich, Fabbricatore, Gemme, Parodi, Viviani, Zhang, Buscaglia and Bottino15–Reference Joguet, Lengauer, Bohn and Bauer17 In fact, NbNx is often observed to be in mixed phases and also transforms from one to another phase, and the details of the involved processes are not yet well understood. As we mentioned above, in the separate set of experiments where we only conducted thermal processing (no PLD), we observed that no nitridation is formed in the range of 250–850 °C, whereas at 900 °C, there is a compelling evidence of NbNx as observed from the XRD results of Fig. 4. We also observe that the resulting crystal structure is completely different from the one that is obtained using PLD at the same substrate temperature and molecular nitrogen pressure (β-NbN for thermal processing versus mixed δ-NbN and β-Nb2N for PLD). We note that the failure to produce δ-NbN at lower temperature using thermal processes alone is due to the fact that the nitrogen in the chamber is not in a form of ammonia (NH3), which can readily crack under thermal heating generating atomic nitrogen. We also note that the plasma generated in PLD resulted in electron collisional dissociation of molecular nitrogen generating atomic nitrogen in ground and excited states. Atomic nitrogen diffuses into Nb at a higher rate than molecular nitrogen because of the reduced mass and increased translational energy resulting in larger random walk steps.
Film thickness versus substrate temperature and stoichiometric coefficient x in NbNx films as a function of deposition substrate temperature.

XRD of PLD and heating of the substrate for temperatures, 450, 650, 750, and 850 °C.

XRD for a sample prepared at 100 mTorr nitrogen pressure, 60 min thermal processing time at 900 °C

The stoichiometric coefficient x in NbNx as a function of deposition temperature in Fig. 2 shows that the atomic nitrogen ratio in the films increases as temperature goes up to 850 °C. The error bars represent a standard deviation of five data points for each sample. The atomic nitrogen ratio in the films increases as temperature goes up to 850 °C. The cubic δ niobium nitride can be obtained within the range of x: (0.57 < x < 0.99),Reference Benkahoul, Martinez, Karimi, Sanjines and Levy3 whereas for the β hexagonal phase, a wide range of x = 0.57–0.93 is observed, which is in agreement with the phase diagram of the Nb–N system.Reference Benkahoul, Martinez, Karimi, Sanjines and Levy3 The calculated c/a lattice parameter ratio, where c is the height of the hexagonal prism of the HCP crystal structure and a is the basal side, for the hexagonal β-Nb2N phase increases the N/Nb ratio upon the deviation of x from 0.5 in the films. The c/a ratio increases as the stoichiometric coefficient x increases, and similar effect has been observed for tetragonal phase of NbNx.Reference Joguet, Lengauer, Bohn and Bauer17 The c/a ratio of the hexagonal phase depends on the phase and space group of the crystal structure, which has been reported between 0.95 and 1.99.Reference Ivashchenko, Turchi and Olifan18 Our results of c/a = 1.61 are consistent with literature values.Reference Ivashchenko, Turchi and Olifan18 The lattice parameter strongly depends on the crystal imperfection.Reference Farha, Er, Ufuktepe, Myneni and Elsayed-Ali19 The lattice constant a is independent of composition, but c increases with nitrogen content.Reference Farha, Er, Ufuktepe, Myneni and Elsayed-Ali19 Phase changes from mixed (cubic + hexagonal) to hexagonal (β-Nb2N and δ′-NbN) resulted from the temperature increase. The cubic δ-NbN phase was detected with (111), (200), and (220) reflections. The texture of δ-NbN phase changes from a strong (200) orientation at 450 °C to a dominant (220) orientation at 650 °C and that followed by (111) orientation as the substrate deposition temperature was increased to 750 °C.
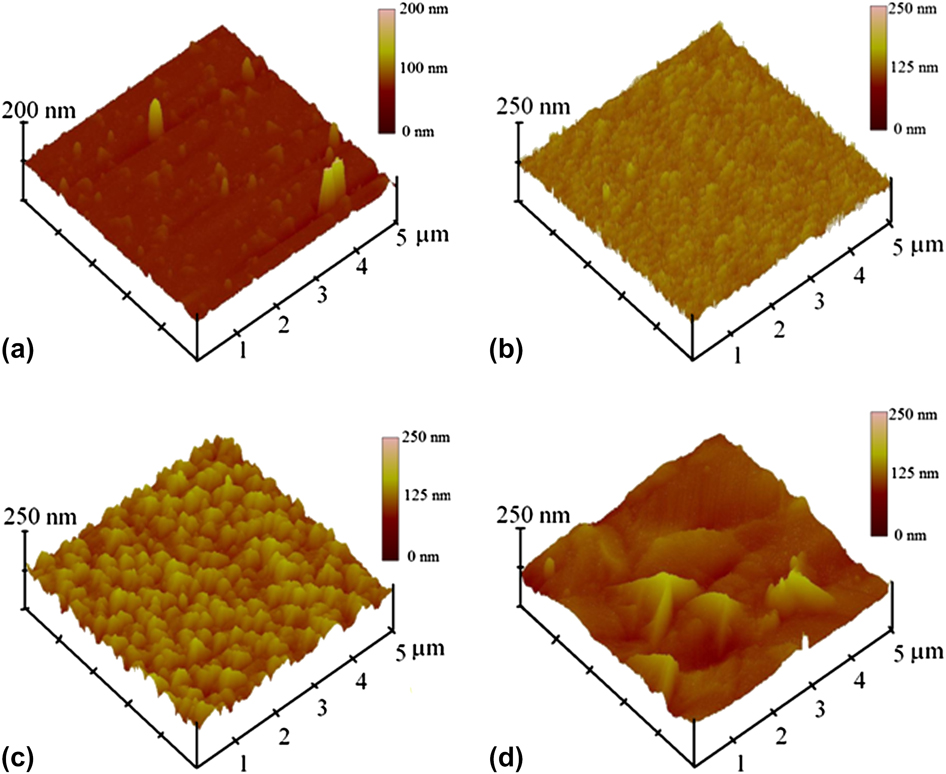
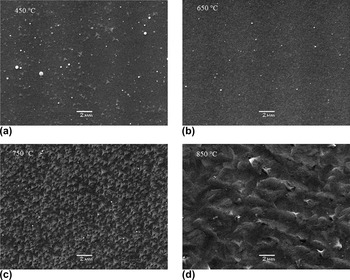
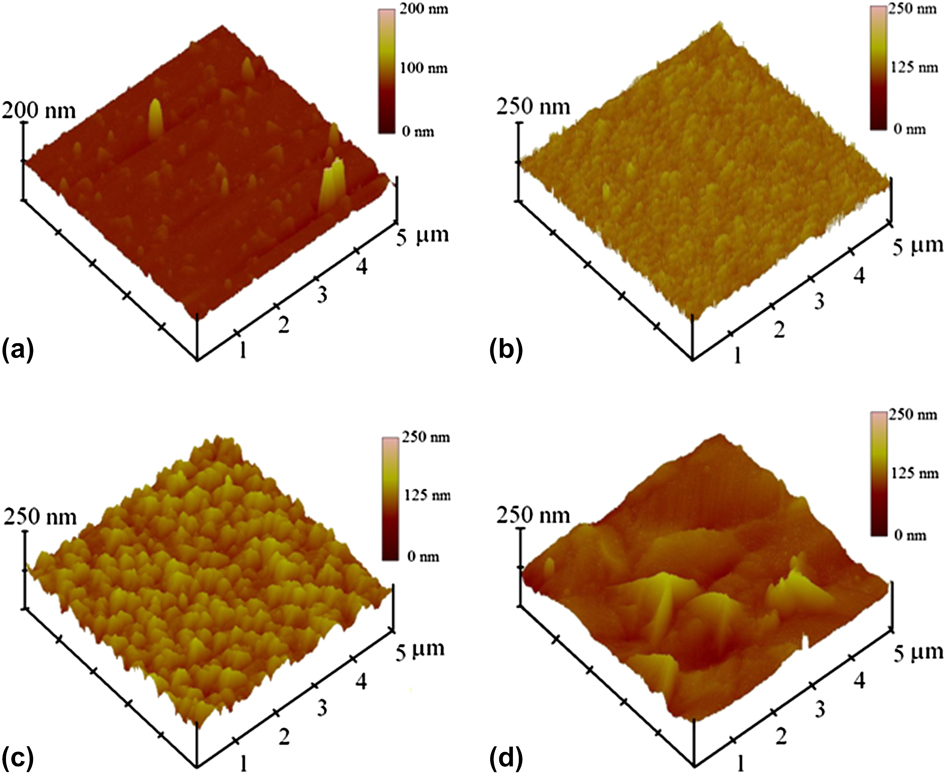
The characteristics of microstructure and surface properties as impacted by the substrate deposition temperature were examined by AFM and SEM. Figure 5 shows three-dimensional AFM images of NbNx films deposited at different substrate temperatures. At 450 °C, submicron-sized features of irregular shapes were observed, Fig. 5(a). As the substrate temperature is increased to 650 °C, very dense and almost uniform in height islands were visible as shown in Fig. 5(b). These islands developed into regular array of more islands and their average height increased, whereas their density declined as a result of the temperature surge to 750 °C, Fig. 5(c). Once the temperature was increased to 850 °C, we observed low density micron-sized islands. The AFM image for this condition reveals better crystalline structure and more uniform size distribution. The RMS values of the surface roughness were obtained from the AFM images as a function of substrate temperature. The roughness of the film increases as the substrate temperature increases. The RMS roughness values of 7, 10, 21, and 23 nm for the corresponding substrate temperatures of 450, 650, 750, and 850 °C respectively were recorded. This is consistent with the results for the crystallite sizes that were obtained from the XRD that range from 3 to 18 nm. The smaller the crystallite sizes the smoother the surface. Figure 6 shows SEM images for films grown at different substrate temperatures. As shown in Figs. 6(a)–6(d), the same behaviors observed by AFM are confirmed by SEM images for films grown on substrates with temperatures that range from 450 to 850 °C.
The three-dimensional AFM images of films grown at (a) 450 °C, (b) 650 °C, (c) 750 °C, and (d) 850 °C.
SEM images of the NbN films deposited at different substrate temperatures (a) 450 °C, (b) 650 °C, (c) 750 °C, and (d) 850 °C.

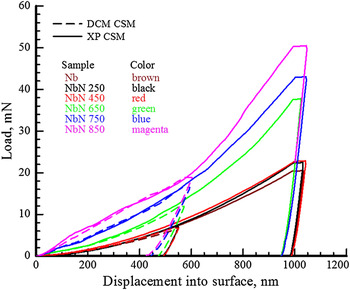
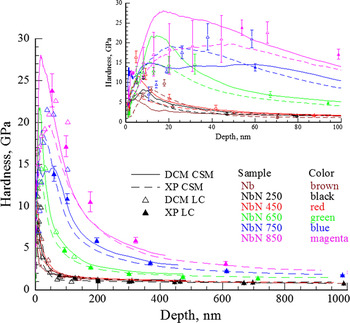
The load–depth curves from DCM II and XP tests are shown in Fig. 7. The data represent an average of five data sets from each protocol, DCM II and XP. The DCM II data at deep depth of indentation overlap the XP data at shallow depth of indentation. For visual clarity, only CSM test data are illustrated. The slope of the loading curve exhibits a gradual increase as the process temperature increases for different samples, which resulted in sequential increase of hardness as a function of process temperature as depicted in Fig. 7. An abrupt change in the loading portion of the 750 and 850 °C XP load–depth curve is observed due to surface roughness. The hardness versus the depth of indentation is shown in Fig. 8. The data represent DCM II and XP protocols in CSM and load control modes. Subplots are shown in Fig. 8 for data between 0 and 100 nm depth of indentation. The CSM curves represent an average of 10 tests and the load control (LC) data represent an average of 5 tests as depicted by the error bars. The error bars represent three times the standard error. The hardness gradually increases as the process temperatures increase beyond 450 °C. This results in the development of hexagonal phase structures. Close observation on the inflection points in the transition region of the hardness curves indicates a rough estimate of the film thickness, which was shown as a function of process temperature in Fig. 2. The estimated thickness using this approach agrees well with the film thickness measured for samples processed at 250 and 450 °C as explained in the Sec. II.
Load versus displacement into surface.

Hardness versus contact depth of indentation. The insert plot shows data for depth between 0 and 100 nm.

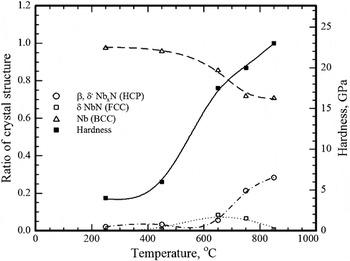
In general for metals, metal oxides, metal nitrides, and metal carbides, the ratio of hardness to flow stress is 2.9–3.0 and the ratio of hardness to critical resolved shear stress (CRSS) is ∼9.0.Reference Tabor20 The CRSS is defined by the slip direction and slip plane. Pure elements have relatively low hardness, while alloying and radiation (which produces dislocation) generally increase strength and hardness. The indentation hardness is expected to increase as soon as the HCP crystal structures develop within the NbNx above 650 °C due to the fact that HCP crystal structures are more brittle since they posses fewer slip systems as compared to the FCC and BCC crystal structures.Reference Brooks, O’Neill and Redfern21 At 250 °C, only BCC Nb is formed and no NbNx peaks were detected according to the XRD of Fig. 1, whereas at 850 °C, we observe the formation of δ-NbN (FCC), δ′-NbN (HCP), and β-Nb2N (HCP). With the aid of the XRD data of Fig. 1, we plot in Fig. 9, the ratio of crystal structure on the left axis and hardness on the right axis versus the substrate deposition temperature on the bottom axis. In this figure, the hardness values represent the average of test data from all test approaches at 50% film thickness. Data from a combination of β-Nb2N (HCP) and δ′-NbN (HCP) are shown as open circles and data from δ-NbN (FCC) are shown as open squares. Nb (BCC) data are shown as well as open triangles. We observe that β-Nb2N (HCP) and δ′-NbN (HCP) crystal structures increase with the increase in the substrate deposition temperature, whereas the Nb (BCC) crystal structures decrease with the increase in the substrate deposition temperature, an obvious outcome. The hardness plot on the right axis synchronizes with this result.
Ratio of crystal structure and hardness versus substrate temperature in NbNx films as a function of deposition substrate temperature.

IV. CONCLUSIONS
In this study, the structural and nanomechanical properties of niobium nitride thin films grown by PLD on niobium substrate at different temperatures were studied. The change of the substrate temperature during deposition of NbNx films shows considerable effects on the phase, morphologies, nanomechanical properties, and crystallinity of the films. A systematic increase in lattice parameters with substrate deposition temperature along with an increase in the size of the grains was observed. NbNx film with mainly β-Nb2N hexagonal phase was obtained for substrate temperature of 850 °C. Also at that temperature, the highest values of N/Nb = 0.93 ratio and lattice constant ratio of β phase (c/a) were obtained. The cubic phase of NbNx was formed for deposition at 450, 650, and 750 °C, although it was mixed with the hexagonal phase. A regular increase in hardness was observed as a function of substrate temperature above 450 °C. The atomic ratio of nitrogen in the film depends on the substrate temperature. XRD and AFM results showed that the crystallite sizes and surface roughness of the NbNx films increase as the substrate temperature increases.