The connection between family affect and the development of depressive symptoms has been established through two primary lines of research (e.g., Allen & Sheeber, Reference Allen and Sheeber2008; Cole & Rehm, Reference Cole and Rehm1986; Restifo & Bogels, Reference Restifo and Bogels2009; Sheeber, Hops, & Davis, Reference Sheeber, Hops and Davis2001). One is the affective quantity approach, wherein the amount (frequency or duration) of negative or positive affect expressed during family interactions differentiates depressed from nondepressed offspring. For example, parent negativity in the form of angry or hostile affect (Sheeber, Davis, Leve, Hops, & Tildesley, Reference Sheeber, Davis, Leve, Hops and Tildesley2007) as well as sad or dysphoric affect (Sheeber & Sorensen, Reference Sheeber and Sorensen1998) has been tied to depressive disorder. Moreover, depressed adolescents sustain negative affective states for longer durations during family interactions than do their nondepressed counterparts (Sheeber, Allen, Davis, & Sorenson, Reference Sheeber, Allen, Davis and Sorensen2000). Hence, the affective quantity approach attends to individual behavior considering the rest of the family as background context, rather than examining each as active participants that elicit and respond to each other. The second line of inquiry, the affective process approach, examines the contingent reactions among family members while they are engaged in an emotionally challenging interaction. Here the focus is on parental responses to children's affect and behavior that foster the development of depressive symptomatology (Lindsey, MacKinnon-Lewis, Campbell, Frabutt, & Lamb, Reference Lindsey, MacKinnon-Lewis, Campbell, Frabutt and Lamb2002; Oldehinkel, Veenstra, Ormel, de Winter, & Verhulst, Reference Oldehinkel, Veenstra, Ormel, de Winter and Verhulst2006; Yap, Schwartz, Byrne, Simmons, & Allen, Reference Yap, Schwartz, Byrne, Simmons and Allen2010) as well as on adolescent responses to parental affect and behavior (Davis, Sheeber, Hops, & Tildesley, Reference Davis, Sheeber, Hops and Tildesley2000). For example, maternal facilitative responses (e.g., approval) to adolescent depressive behavior has predicted the duration of adolescent depressive affect (Sheeber et al., Reference Sheeber, Allen, Davis and Sorensen2000). This process approach, therefore, is more directly focused on affective socialization behaviors that facilitate adolescent depression.
Although these two research areas have revealed a number of important affective components of family processes, there are some issues yet to be fully addressed. One set of issues concerns the family context. With few exceptions (e.g., Davis et al., Reference Davis, Sheeber, Hops and Tildesley2000), observational research has focused on the parent–child dyad as the unit of analysis. This may be a methodological convenience: it is challenging to get both parents to participate and bivariate relations dominate the analytical toolbox; it nonetheless places an upper limit on ecological validity in several ways. First, the majority of family interactions occur with three or more individuals present (Fivaz-Depeursinge, & Corboz-Warnery, Reference Fivaz-Depeursinge and Corboz-Warnery1999; Larson, Richards, Moneta, Holmbeck, & Duckett, Reference Larson, Richards, Moneta, Holmbeck and Duckett1996). Thus, the assumption that the isolated dyad represents the entirety of a family's affective processes may be questioned. The parent, most often the mother, involved in such studies implicitly functions as a proxy for the family as a whole. Dyadic studies that have separated father effects from mother effects show differential results (e.g., Lunkenheimer, Olsen, Hollenstein, Sameroff, & Winter, Reference Lunkenheimer, Olson, Hollenstein, Sameroff and Winter2011; Sheeber et al., Reference Sheeber, Davis, Leve, Hops and Tildesley2007), indicating that each family member can provide a unique contribution to the family affective climate. Moreover, families comprising a single parent with a single child notwithstanding, a family unit in its most rudimentary form is typically triadic; thus both individual and dyadic foci cannot fully capture all of the affective processes that may shape a child's development.
Second, families have long been acknowledged, formally or implicitly, as integrated systems formed by the pattern of behavior during day-to-day interactions (Cox & Paley, Reference Cox and Paley2003; Granic, Reference Granic, Lewis and Granic2000; Minuchin, Reference Minuchin1974; Restifo & Bogels, Reference Restifo and Bogels2009; Sameroff, Reference Sameroff and Mussen1983). Despite this general acceptance of families as systems, there has been a relative paucity of research on families as systems. Thus, empirical focus on the individual or dyad does not fully map on to ecological or systems theory. To address these issues, rather than making a sudden leap to research involving four or more family members, the logical next research step is to add just one more individual into the mix. As we delineate below, the shift from dyad to triad is not trivial and may require novel analytical approaches.
Triadic Family Affective Processes
The family affective process approach has made inroads toward a more systemic understanding of developmental mechanisms of depression. Studies of dyadic parent–child interactions have revealed that adolescent depression is associated with elevated levels of parental criticism (Asarnow, Goldstein, Thompson, & Gothrie, Reference Asarnow, Goldstein, Thompson and Guthrie1993; McCleary & Sanford, Reference McCleary and Sanford2002), overall negative affect (NA; Schwartz et al, Reference Schwartz, Dudgeon, Sheeber, Yap, Simmons and Allen2011), and more specifically, anger (Sheeber et al., Reference Sheeber, Davis, Leve, Hops and Tildesley2007) and dysphoria (Schwartz, Sheeber, Dudgeon, & Allen, Reference Schwartz, Sheeber, Dudgeon and Allen2012; Sheeber & Sorenson, Reference Sheeber and Sorensen1998), as well as lower levels of parental positivity (Sheeber, Hops, Alpert, Davis, & Andrews, Reference Sheeber, Hops, Alpert, Davis and Andrews1997; Yap, Allen, & Ladouceur, Reference Yap, Allen and Ladouceur2008). However, only relatively few studies have examined triadic processes, most commonly mother–father–child triads, and associations with depression.
By far the most prevalent triadic research is on interpersonal conflict, with most focusing on the child's response to marital conflict (e.g., Cummings, El-Sheikh, Kouros, & Keller, Reference Cummings, El-Sheikh, Kouros and Keller2007; Davis, Hops, Alpert, & Sheeber, Reference Davis, Hops, Alpert and Sheeber1998). In general, greater amounts of conflict among family members predict youth depression (Kane & Garber, Reference Kane and Garber2004; Marmorstein & Iacono, Reference Marmorstein and Iacono2004). Even triadic family interaction patterns at very young ages can predict depression. For example, enmeshed, controlling, and disengaged triadic family patterns with 2-year-old children have been shown to predict depressive symptoms in children 5 years later (Jacobvitz, Hazen, Curran, & Hitchens, Reference Jacobvitz, Hazen, Curran and Hitchens2004). In one of the few studies to examine contingent responding across triad members, the sequence of mothers’ aggression toward fathers followed by adolescents’ dysphoric behavior to mother was found to predict an increase in adolescent depression over the course of 1 year (Davis et al., Reference Davis, Hops, Alpert and Sheeber1998). Thus, both global assessments of family functioning and more specific three-person sequences have predicted depression in youth.
In addition to the limitations of a dyadic focus presented earlier, there are further issues not yet fully addressed in triadic research. First, there are several ways that direct person–person interactions in dyads are qualitatively different from interactions that include three (or more) individuals: (a) functional roles emerge in triads that cannot exist in a dyadic contexts, such as the “peacekeeper” who helps to resolve the conflict between the other two triad members, the aggressive child as “cocombatant” with parents, or the “withdrawn witness” who passively ceases to participate in the interaction (Davis et al., Reference Davis, Hops, Alpert and Sheeber1998; Emery, Reference Emery1982; Pincus, Reference Pincus2001; Vuchinich, Emery, & Cassidy, Reference Vuchinich, Emery and Cassidy1988); (b) the primary mechanisms of intimate communication such as eye gaze are necessarily compromised and divided. It is more complex to look at or direct behavior toward two people at once; (c) when triads have been considered, they typically have been conceptualized as a set of three dyadic relationships, each of which may be affected by the presence of the third person (e.g., Davis et al., Reference Davis, Hops, Alpert and Sheeber1998). However, it may be problematic to “infer the property of the triad from its dyadic components rather than taking a leap to the triadic gestalt” (Fivaz-Depeursinge & Corboz-Warnery, Reference Fivaz-Depeursinge and Corboz-Warnery1999, p. xxiv); (d) a unique set of relational processes are available with triads that are not available with dyads, such as the exclusion of one triad member by the other two (Tremblay-Leveau & Nadel, Reference Tremblay-Leveau and Nadel1996), triangulation as when one parent complains to the child about the other parent (Fivaz-Depeursinge & Corboz-Warnery, Reference Fivaz-Depeursinge and Corboz-Warnery1999), or coalitions of two triad members in an alliance against the third (Minuchin, Reference Minuchin1974); and (e) in relating parent–child interactions to the development of psychopathology in children, the parent present in dyadic research may not be the most influential to the etiology; hence, with both parents present, unique problematic processes may be revealed.
Second, a primary barrier to triadic research is analytic complexity (Davis et al., Reference Davis, Hops, Alpert and Sheeber1998). Most measurement or analytical tools in observational research rely on binary pairings (e.g., conditional probabilities, correlations) or statistical interactions. For example, mom's average valence and dad's average valence plus the interaction between those two variables might be used to predict child's average valence. This purely content-driven approach is not altogether wrong but neglects the temporal dynamics or structural patterns unique to triadic interactions. What are needed are techniques that bridge the gap between the rich, systems-based theoretical accounts of developmental psychopathology and the empirical means to test these claims (Granic & Hollenstein, Reference Granic and Hollenstein2003; Richters, Reference Richters1997). Recent advances with a two-dimensional technique based on dynamic systems principles, state space grids (SSGs; Lewis, Lamey & Douglas, Reference Lewis, Lamey and Douglas1999; Hollenstein, Reference Hollenstein2007, Reference Hollenstein and Kunnen2012, Reference Hollenstein2013), has opened a window into understanding the dynamics of three interacting individuals (Lavictoire, Snyder, Stoolmiller, Hollenstein, Reference Hollenstein and Kunnen2012).
The Present Study
The purpose of the present study was to explore differences in triadic family affective dynamics between triads with or without a depressed adolescent. We sought to examine differences in the structure (i.e., variability), content (i.e., specific affective states), and degree of affective matching across triad members. Because this was the first attempt to examine patterns of triadic interaction using SSGs, a technique that provides a wide range of indices of structure and content (described below) for analysis, our approach was primarily descriptive and exploratory.
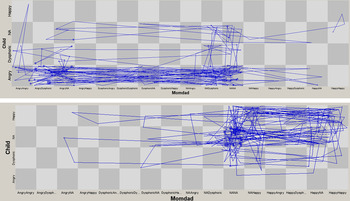
Families were observed while engaging in three interaction tasks in a set order: an event-planning task, a problem-solving task, and a family consensus task. Rather than just focusing on the problem solving task, as is typical in family interaction research, we included all three tasks to be able to distinguish both context-independent effects across all tasks as well as comparisons of affective dynamics that depended on the interaction context. Each triad member was coded separately and continuously to capture his or her moment-to-moment affective states. Consistent with previous applications of the Living in Family Environments (LIFE; Hops, Biglan, Tolman, Arthur, & Longoria, Reference Hops, Biglan, Tolman, Arthur and Longoria1995) coding system (Allen, Kuppens, & Sheeber, 2012; Ehrmantrout, Allen, Leve, Davis, & Sheeber, Reference Ehrmantrout, Allen, Leve, Davis and Sheeber2011; Kuppens, Allen, & Sheeber, Reference Kuppens, Allen and Sheeber2010; Sheeber et al., Reference Sheeber, Allen, Leve, Davis, Shortt and Katz2009), each triad member's behavior was categorized as angry, dysphoric, happy, or NA. These synchronized categorical time series were analyzed with SSGs, an analytical technique based on dynamic systems principles that provides visualizations of real-time trajectories and various measures capturing the structure and content of these trajectories (Hollenstein, Reference Hollenstein2013). This technique is well suited to research on families as systems with each cell of the grid representing a simultaneous triadic state. Each triadic trajectory (sequence of triadic states) was plotted on the SSG and measures were derived based on frequency and duration. Figure 1 shows two triadic SSGs from this study. The y axis has the four categories for the child while the x axis has each of the 16 mother–father category combinations. The plotted trajectories track the changes in triadic affect.
(Color online) Two example triadic state space grids. The grid on the top is from the interaction of family with an adolescent who frequently expressed angry affect. The grid on the bottom is from a triad with a high degree of happy affect. Labels on the x axis depicting the parents' affect are identified by the mother's affect then the fathers' affect. DysphoricAngry pertains to a state in which the mother was dysphoric and the father was angry.

This study was organized around three primary research questions. First, we wanted to examine the overall variability in the triadic dynamics. In dyadic parent–child interactions, structural indices of variability derived from SSGs have been associated with children's internalizing and externalizing problems (Granic, O'Hara, Pepler, & Lewis, Reference Granic, O'Hara, Pepler and Lewis2007; Hollenstein, Granic, Stoolmiller, & Snyder, Reference Hollenstein, Granic, Stoolmiller and Snyder2004; Lunkenheimer et al., Reference Lunkenheimer, Olson, Hollenstein, Sameroff and Winter2011; Lunkenheimer, Hollenstein, Wang, & Shields, Reference Lunkenheimer, Hollenstein, Wang and Shields2012) and adolescents’ stress (Hollenstein & Lewis, Reference Hollenstein and Lewis2006). In general, lower affective variability (i.e., greater rigidity) has been associated with elevated problems; greater variability (i.e., flexibility) has been associated with healthy socioemotional functioning. Consistent with these findings, we predicted that the triads with depressed adolescents would be more rigid by dint of lower overall variability in triadic affective states than triads with typically developing adolescents.
Second, we wanted to explore differences in specific triadic affective states between the depressed and nondepressed groups. From the literature on individual affective states, we know that depressed adolescents as well as their parents tend to express more NA (Buist, Dekovic, & Gerris, Reference Buist, Dekovic and Gerris2011; Schwartz et al., Reference Schwartz, Sheeber, Dudgeon and Allen2012; Sheeber & Sorenson, Reference Sheeber and Sorensen1998). What we do not know from this literature is how these individual states combine in a triadic social context. For example, do mothers and fathers alternate negativity or express it simultaneously? For this research question, we were interested in exploring which of the possible triadic combinations of simultaneous affect were different among groups. We predicted that the parent and adolescent dysphoric and angry states would differentiate the depression groups, but we were unable to specify which specific triadic combinations would be most important.
Third, to complement and further narrow our focus on group differences, we took our content analyses a step further to examine whether the discrepancy or matching of triadic affective states would differentiate groups. One line of research would suggest that mutually aversive states would characterize the depressogenic family interactions (e.g., Yap et al., Reference Yap, Allen, O'Shea, Di Parsia, Simmons and Sheeber2011). Another perspective is that the mismatching of affect creates an emotionally confusing climate that is not predictable and thus facilitates depressive symptoms (Tronick & Cohn, Reference Tronick and Cohn1989). We tested these competing predictions in two ways. First, we tested whether the depressed group spent more time in triadic states with each triad member in a different state than the other two (e.g., child angry, mother dysphoric, father happy) and if they returned to those states more quickly than the nondepressed group. Second, we tested whether the depressed group spent more time in mutual states (e.g., child angry, mother angry, father angry) and returned to these states more quickly than the nondepressed group.
Methods
Participants
Participants were 107 adolescents (42 boys) and their parents, selected from a larger sample of families participating in a study of adolescent unipolar depressive disorder (N = 152; Sheeber et al., Reference Sheeber, Allen, Leve, Davis, Shortt and Katz2009). Of participating parents, 93% of mothers and 74% of fathers were the child's biological or adoptive parent; the remaining were stepparents (5% mothers; 23% fathers) or grandparents/permanent guardians. Because we were interested in examining triadic processes, only two-parent families in which both parents participated were included (more recruitment details follow below). Of two-parent families in the larger study, both parents participated in 93% of families. Relative to the larger study, this subsample had higher family income, χ2 (n = 152) = 21.52, p < .001, more boys χ2 (n = 152) = 5.74, p < .05, and fewer depressed participants, χ2 (n = 152) = 4.24, p < .05.
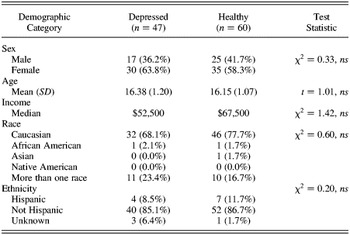
The adolescents were between the ages of 14 and 18 and met research criteria for placement in one of two groups (depressed, n = 47, or healthy, n = 60). Depressed adolescents met DSM-IV diagnostic criteria for current major depressive or dysthymic disorder (n = 1) based on the Schedule for Affective Disorders and Schizophrenia for School Aged Children (K-SADS) diagnostic interview (Orvaschel & Puig-Antich, Reference Orvaschel and Puig-Antich1994). Healthy adolescents had no current or lifetime history of psychopathology based on the K-SADS and no history of mental health treatment. Twenty-three depressed adolescents were excluded (19 due to comorbid externalizing or substance dependence disorders, and 4 who were taking either serotonin norepinephrine reuptake inhibitors or tricyclic antidepressants) because of their potential to influence psychophysiological measures collected as part of the larger investigation. Demographic information is provided in Table 1.
Demographic data

Screening and recruitment
Families were recruited using a two-gate procedure consisting of an in-school screening and an in-home diagnostic interview. In order to facilitate recruitment of a representative sample of students, we used a combined passive parental consent and active student assent protocol for the school screening (Biglan & Ary, Reference Biglan, Ary, Bell and Battjes1990). Active parent consent and adolescent assent for the full assessment were obtained prior to the diagnostic interview. The study was conducted with approval of the appropriate IRB and in accordance with American Psychological Association ethical standards.
In-school screening
High school students (N = 4,182) completed the Center for Epidemiological Studies, Depression Scale (CES-D; Radloff, 1977) and a demographic data form during class. Approximately 70% of enrolled students participated in the screening (12% declined, 18% absent). The CES-D is a widely used self-report measure that has a well-established record as a screener for depressive symptomatology in adolescent samples (e.g., Sheeber et al., Reference Sheeber, Davis, Leve, Hops and Tildesley2007). The CES-D cutoff scores for selecting potential participants represented the 93rd percentile in the distribution of scores obtained in an earlier screening of high school students (N = 4,495) in the same area (Sheeber et al., Reference Sheeber, Davis, Leve, Hops and Tildesley2007). Relatively high scores (≥31 for males and ≥38 for females) were selected to maximize the positive predictive power to identify adolescents experiencing depressive disorder. Approximately 8% of students in the current sample scored above these cutoffs. The pool for the healthy group was defined as students not more than 0.5 SD above the mean in the earlier sample (<21 for males and <24 for females). The mean score in the current sample was 16.04 (SD = 11.4, range = 0–59).
In-home diagnostic assessment
Interviewers conducted the K-SADS (Orvaschel & Puig-Antich, Reference Orvaschel and Puig-Antich1994) with adolescents who had elevated CES-D scores in order to obtain current and lifetime diagnoses for mood, anxiety, psychotic, externalizing, eating, and substance use disorders. After each adolescent in the depressed group completed the lab assessment, a healthy comparison participant matched, to the extent possible, on sex, race/ethnicity and school was recruited from the pool of students who scored within the normal range on the CES-D. Approximately 9% of families contacted by phone were not eligible to participate as per criteria described above (e.g., not living with parent, treatment history not appropriate for condition). Of families invited to participate (N = 498), approximately 26% declined. Rates of decline did not vary as a function of preinterview group status (i.e., elevated or healthy CES-D score), age, or race, though more males than females declined (31.6% vs. 23%), χ2 (1, n = 498) = 4.57, p < .05. Reliability ratings were obtained on approximately 20% of the interviews, chosen at random. Average agreement on an item-by-item basis was κ = 0.94, across diagnoses. Agreement at the level of diagnosis for depressive disorder was κ = 0.80.
Family-based lab assessment
Families who met criteria for the investigation after the diagnostic interview were invited to participate in the lab assessment. Approximately 4% of families declined. The decline rate did not vary as a function of group status, age, race, or sex. The lab assessment included three family interaction tasks designed to elicit varying degrees of happy, angry, and dysphoric affect. Each interaction lasted 18 min, evenly divided across two discussions. In the first task, families were first instructed to plan a vacation and then to reminisce about a fun time they had experienced together (event-planning interaction). The second task consisted of two consecutive problem-solving interactions in which families were asked to discuss and resolve two areas of conflict (problem-solving interaction). In the last interaction, families were asked to discuss two areas of family life: one focused on identifying and describing the best and most difficult years the adolescent had experienced and the other focused on the most challenging and most rewarding aspects of parenting the adolescent (family consensus interaction).
Measures
Observational coding
The LIFE coding system (Hops, Biglan, Tolman, Arthur, & Longoria, Reference Hops, Biglan, Tolman, Arthur and Longoria1995) was used to code the triadic interactions. Observers, blind to diagnostic status, coded each family members’ nonverbal affect and verbal content in real time. Because we were specifically interested in affects that are core to depression, three constructs (angry, dysphoric, and happy) were derived from individual affect and affect-laden content codes in the present investigation. Angry behavior included aggressive or contemptuous nonverbal behavior and cruel or provoking statements captured by three LIFE codes (contempt, anger, and belligerence). Dysphoric behavior was defined by sad nonverbal behavior or complaining statements. Happy behavior reflected happy nonverbal behavior or humorous statements. Other verbal content with neutral affect, as well as three other affect codes (caring, whining, anxious), were combined into the NA category. Approximately 25% of videos were coded by a second observer for reliability purposes. The κ values for the coding were 0.73, 0.70, and 0.88 for adolescent angry, dysphoric, and happy, respectively.
Diversity, flexibility, and unpredictability
Three measures of variability were derived from the SSGs using GridWare 1.1 (Lamey, Hollenstein, Lewis, & Granic, Reference Lamey, Hollenstein, Lewis and Granic2004) to capture the overall structure of the interaction. First, diversity was measured by dispersion, which reflects the range of triadic affect by effectively summing the number of unique cells occupied controlling for the proportional durations in each cell. The formula for dispersion is
 $$1{\rm }-{\rm }\lsqb {\lsqb {\lpar {n\sum {{\lpar {{d_i}/D} \rpar }^2}} \rpar {\rm }-{\rm }1} \rsqb /n-{\rm }1} \rsqb \comma \;$$
where D is the total duration, d i is the duration in cell i, and n is the total number of cells in the grid (64 for this study). The dispersion values range from 0 (all affect is in one cell for the entire interaction) to 1 (affect is equally distributed with the same duration in every cell). The second measure was flexibility, computed by transitions per minute: a count of the number of times the triad changed affect to occupy a different cell, divided by the total duration of the discussion. Unpredictability was the third variability measure taken from Shannon's entropy (Shannon & Weaver, Reference Shannon and Weaver1949), which is an index of the predictability of the sequence of triadic states (Dishion, Nelson, Winter, & Bullock, Reference Dishion, Nelson, Winter and Bullock2004; Lunkenheimer et al., Reference Lunkenheimer, Olson, Hollenstein, Sameroff and Winter2011):
 $$\sum\limits_i {{\,p_i}\, \log {\,p_i}},$$
where p i is the probability of a visit to each cell (e.g., number of visits to cell i divided by total visits across all cells). Low entropy values reflect interaction sequences that repeat the same patterns over and over again, whereas high entropy values indicate unpredictability in those sequences.
Triadic affective states
Using GridWare 1.1 (Lamey et al., Reference Lamey, Hollenstein, Lewis and Granic2004), the mean durations of events in each of the 64 cells of the SSGs were obtained for each triad. This measure uses both duration and frequency information (duration in a cell divided by the number of visits to that cell) to reflect the degree to which triads got “stuck” in these states. High values reflect that states lasted a long time each time they occurred, on average.
Discrepant and matching states
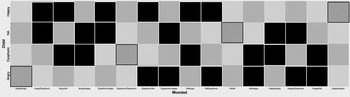
Two subsets of state space grid cells were identified based on whether the triad members expressed (a) three different affects simultaneously (e.g., child angry, mother dysphoric, and father happy) and (b) three identical affects (e.g., child angry, mother angry, and father angry). Out of the 64 cells, there were 24 unique discrepant states and 4 unique matching states (see Figure 2). Two measures were obtained for these two regions of the SSG: the total duration and the return time. Duration was simply the total amount of time summed across all the cells in the discrepancy or matching regions. The return time was the average amount of time between visits to the region. For example, a return time of 12 s for the matching region would mean that on average the triad returned to a matched triadic state after being in nonmatched states for 12 s. Thus, shorter return times reflect a more habitual repetition of either discrepant or matching states.
State space grid cells included in the discrepancy region (black cells) and matching region (striped cells).

Results
Diversity, flexibility, and unpredictability
Our first set of analyses was conducted to test for group differences in the overall structure or variability of the interactions. Each of the three measures was analyzed in separate 2 × 2 × 3 between-within repeated measures analyses of variance with depression group and sex as between-subjects factors and the three interaction tasks as the within-subjects factor.
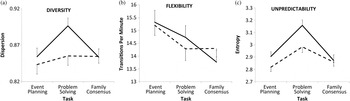
For diversity, there was a significant quadratic effect of task, F (1, 100) = 9.14, p = .003,
 ${\rm \eta }_{\rm p}^2$
= 0.08, as well as a significant Task × Group interaction, F (1, 100) = 5.06, p = .03,
 ${\rm \eta }_{\rm p}^2 $
= 0.05. As shown in Figure 3a, the triads with depressed adolescents had greater range of affective states in the problem-solving task than did the control triads. Follow-up contrasts showed that this was a significant difference between groups for just the problem-solving task (p = .02), and that diversity during the problem-solving task for the depressed group was significantly higher than diversity in the previous interaction task (p = .006) and the subsequent interaction task (p = .002).
Triadic diversity, flexibility, and predictability across the three discussions by depression group. In each graph, the depressed group is plotted in solid lines and the control group in dashed lines. (a) The pattern for diversity, (b) the pattern for flexibility, and (c) the pattern for unpredictability.

For flexibility, there was a linear decrease across tasks, F (1, 100) = 10.76, p = .001,
 ${\rm \eta }_{\rm p}^2 $
= 0.10 (see Figure 3b). Contrary to hypotheses, there were no significant group effects.
For unpredictability, there was a significant quadratic effect of Task, F (1, 100) = 52.56, p < .001,
 ${\rm \eta }_{\rm p}^2$
= 0.35, a significant Task × Group interaction, F (1, 100) = 4.83, p = .03,
 ${\rm \eta }_{\rm p}^2 $
= 0.05, and a between-subjects main effect of group, F (1, 100) = 4.15, p = .04,
 ${\rm \eta }_{\rm p}^2 $
= 0.04. As shown in Figure 3c, the triads with depressed adolescents had greater affective unpredictability in the problem-solving task than did the control triads. Follow-up contrasts showed that the between-group effect was significant for just the problem-solving task (p = .008), and that unpredictability during the problem-solving task for the depressed group was significantly higher than unpredictability in the previous interaction task (p < .001) and the subsequent task (p < .001). This difference was also found for the control group with significantly less unpredictability (i.e., more predictability) in the first task (p < .001) and the last task (p = .005) in comparison to the middle problem-solving task.
Triadic affective states
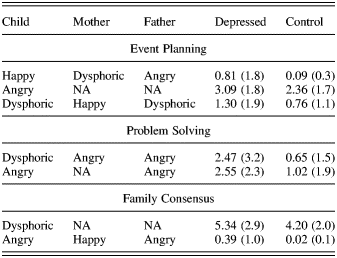
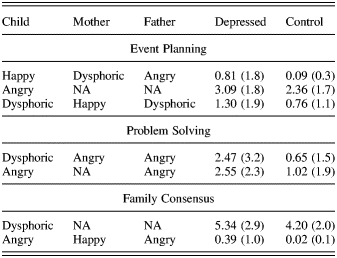
In order to detect group differences in simultaneous triadic affective states, we ran a stepwise discriminant function analysis on the 64 mean durations in the cells for each interaction task separately (see online-only supplemental Table S.1). The dependent variable was depression group. In the first step of the analysis, all 64 cell values were included and variables that contributed the least to the group discrimination were eliminated one by one in each step until only the variables that contributed to that discrimination remained. Thus, following previous triadic analyses (Lavictoire et al., Reference Lavictoire, Snyder, Stoolmiller and Hollenstein2012), the analysis detected which triadic states maximally discriminated groups. The results are summarized in Table 2. Criteria for inclusion were based on Wilks’ Λ at p < .05.Footnote 1 For all cells identified by the analysis, the depression group had higher mean durations. In the event-planning task, three triadic states were identified, whereas for each of the other two tasks only two triadic states were identified. All seven states were different from one another. The pattern of results revealed that none of the states included matched affect with the child and mother, but three of the seven states included matched affect with the father, who shared dysphoric affect in event-planning task and angry affect during the problem-solving and family-consensus tasks.
Mean (standard deviation) durations of triadic affect states in which the depressed group had higher mean durations
Discrepant and matching states
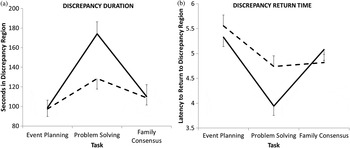
As a final exploration into triadic state differences between groups, we examined regions of cells, rather than individual cells. First, we combined the 24 triadic states in which each triad member was in a different affective state from the other two to create a discrepancy region (see Figure 2). The two measures of total duration and latency to return to this region were analyzed with a repeated-measures (task) analysis of variance, as described for the variability analyses. For duration in the discrepancy region, there was a significant quadratic effect of task, F (1, 100) = 42.74, p < .001,
 ${\rm \eta }_{\rm p}^2 $
= 0.30, as well as a significant Task × Group interaction, F (1, 100) = 9.41, p = .003,
 ${\rm \eta }_{\rm p}^2 $
= 0.09. As shown in Figure 4a, the triads with depressed adolescents spent more time in mutually discrepant states in the problem-solving task than did the control triads. Follow-up contrasts revealed that this was a significant difference between groups for just the problem-solving task (p = .006). Furthermore, the duration in the discrepancy region during the problem-solving task was significantly higher than in the previous task for both the depressed (p < .001) and control (p = .005) groups but greater in the subsequent task for the depressed group only (p < .001).
Duration and return time in discrepancy region across discussions. In each graph, the depressed group is plotted in solid lines and the control group in dashed lines. (a) The pattern for duration, and (b) the pattern for return time.

For return time to the discrepancy region, there was a significant quadratic effect of task, F (1, 100) = 36.64, p < .001,
 ${\rm \eta }_{\rm p}^2$
= 0.27, as well as a significant Task × Group interaction, F(1, 100) = 8.30, p = .005,
 ${\rm \eta }_{\rm p}^2$
= 0.08. As shown in Figure 4b, the triads with depressed adolescents returned more rapidly to mutually discrepant states in the problem-solving task than did the control triads. Follow-up contrasts revealed that the between-group difference was significant only in the problem-solving task (p = .004). Furthermore, return time during the problem-solving task was significantly shorter than in the previous task (p < .001) and the subsequent task (p < .001). For the control group, return time was significantly higher in the first task than both the problem-solving (p < .001) and family-consensus (p = .002) tasks.
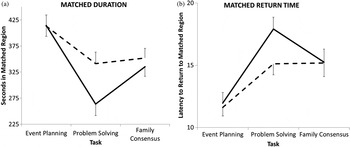
Using the same analysis strategy, we examined duration and return time in the region defined by the four cells of triadic matched affect (see Figure 2). For duration in the matched affect region, there was a significant quadratic effect of task, F (1, 100) = 30.24, p < .001,
 ${\rm \eta }_{\rm p}^2$
= 0.23, as well as a significant Task × Group interaction, F (1, 100) = 6.38, p = .01,
 ${\rm \eta }_{\rm p}^2 $
= 0.06. As shown in Figure 5a, the triads with depressed adolescents spent less time in matched affective states in the problem-solving task than the control triads. Follow-up contrasts revealed that this was a significant difference between groups for just the problem-solving task (p = .01). Moreover, for the depressed group the duration in the matched affect region was significantly different between Tasks 1 and 2 (p < .001), 2 and 3 (p < .001), and 1 and 3 (p = .002). For the control group, duration of matched affect in the first task was significantly different from both problem-solving (p = .002) and family-consensus (p = .007) tasks.
Duration and return time in matching region across discussions. in each graph, the depressed group is plotted in solid lines and the control group in dashed lines. (a) The pattern for duration, and (b) the pattern for return time.

For return time to the matched affect region, there was a significant quadratic effect of task, F (1, 100) = 24.48, p < .001,
 ${\rm \eta }_{\rm p}^2 $
= 0.20, as well as a significant Task × Group interaction, F (1, 100) = 4.51, p = .04,
 ${\rm \eta }_{\rm p}^2 $
= 0.04. As shown in Figure 5b, the triads with depressed adolescents returned more slowly to matched affect states in the problem-solving task than did the control triads. Follow-up contrasts revealed that this was a significant difference between groups for just the problem-solving task (p = .04). Moreover, for the depressed group the return time to the matched affect region was significantly different between Tasks 1 and 2 (p < .001), 2 and 3 (p = .03), and 1 and 3 (p = .006). For the control group, return time to the matched affect region in the first task was significantly different from both problem-solving (p < .001) and family-consensus (p = .001) tasks.
Discussion
The purpose of this study was to explore the patterns of triadic affect in families with or without a depressed adolescent. Compared to families with nondepressed adolescents, triads with depressed adolescents displayed a wider range of affect with less predictability of triadic affective sequences, spent more time and returned more quickly to discrepant affective states, and spent less time and returned more slowly to matched affective states, particularly while engaged in a problem-solving interaction. Furthermore, we identified seven specific triadic states in which triads with depressed adolescents spent significantly more time than triads with healthy controls.
The present study was designed to investigate families as dynamic systems (Granic, Reference Granic, Lewis and Granic2000). One of the fundamental premises in a dynamic systems approach to development is that variability or the overall structure of changes in states is an important signal of a system (Granic & Hollenstein, Reference Granic and Hollenstein2003; Thelen & Ulrich, Reference Thelen and Ulrich1991; van Geert & van Dijk, Reference van Geert and van Dijk2002). The ability to move in and out of states with relative ease is indicative of a system that can more readily adapt to changing environmental demands. Depressed individuals have been shown to get stuck in affective states (e.g., inertia; Kuppens et al., Reference Kuppens, Allen and Sheeber2010). In general, in dyadic parent–child interactions, lower affective variability has been associated with both internalizing and externalizing problems in children (Granic et al., Reference Granic, O'Hara, Pepler and Lewis2007; Hollenstein et al., Reference Hollenstein, Granic, Stoolmiller and Snyder2004). However, one study in a preschool sample found that higher mother–child variability but lower father–child variability was associated with children's problem behavior (Lunkenheimer et al., Reference Lunkenheimer, Olson, Hollenstein, Sameroff and Winter2011). Though our results showed that variability was indeed a signal that differentiated the affective dynamics of these triads, depression was unexpectedly associated with greater dispersion and unpredictability but was unrelated to flexibility. Moreover, this was shown most clearly in the problem-solving task. This means that triads with depressed adolescents expressed affect in a greater number of combinations, and the patterns of their state-to-state transitions were less predictable. It is interesting that the number of transitions was not different between groups, indicating that the greater diversity of triadic states did not arise from making more frequent changes in states. Instead, depressed triads differed with respect to range and sequence but not to flexible movement in and out of states.
In previous parent–child dyadic variability studies, measures of diversity and flexibility have consistently been positively correlated (Hollenstein, Lichtwarck-Aschoff, & Potworowski, Reference Hollenstein, Lichtwarck-Aschoff and Potworowski2013). There are several possible reasons for the difference in the current study. First, triadic and dyadic variability may be functionally different with respect to psychopathology, although it is simply too soon to evaluate this possibility until further triadic examinations are made. Second, the present study utilized an affective coding scheme that resulted in a higher base rate of nonneutral codes. This resulted in higher values for these three measures than seen in previous studies (e.g., Hollenstein et al., Reference Hollenstein, Granic, Stoolmiller and Snyder2004; Hollenstein & Lewis, Reference Hollenstein and Lewis2006). As variability detected with SSGs is a nascent analytical approach, in the future it will be necessary to systematically compare the effect of these measurement differences across studies. Nonetheless, each study that has attempted this structural approach has found modest to strong connections with psychopathology: there is a signal in variability that is complementary to the effects of affective content.
As expected, there were consistencies with previous research on the emotional states of individual family members and reciprocal affective dynamics within dyads (Sheeber et al., Reference Sheeber, Davis, Leve, Hops and Tildesley2007; Schwartz et al., Reference Schwartz, Dudgeon, Sheeber, Yap, Simmons and Allen2011). Families with depressed adolescents expressed more NA (dysphoria and anger) and less positive affect relative to controls. However, the results revealed combinations that went beyond a simple more-negative and less-positive interpretation. First, only one of the seven significant combinations was formed by one triad member in a neutral state and the other two in a nonneutral state, a combination that would support the conclusion that dyadic states are sufficient for understanding family processes. Second, two of the seven significant triadic states included dysphoric or angry states for the adolescent but neutral for both the parents. This is consistent with research that has focused on the depressed individual's affective expression during interpersonal interactions (e.g., Sheeber et al., Reference Sheeber, Allen, Leve, Davis, Shortt and Katz2009). Parents were affectively unperturbed by their depressed child's anger during the event-planning task and dysphoria during the family-consensus task. This could have resulted from the parents’ habituation to their child's mood states or disruptions in contingent affective reactions that have been shown to be etiologically relevant to adolescent depression (Sheeber, Hops, Andrews, Alpert, & Davis, Reference Sheeber, Hops, Andrews, Alpert and Davis1998). Third, and of the most importance, the majority of differentiated states were uniquely triadic with each person expressing an affect that was different from the other two, patterns that would be obscured by a dyadic approach. In the problem-solving interaction (the task which exposed most of the group differences), there was dyadic mutual anger but not triadic mutual anger, showing that dyadic findings do not extend to triads. With the adolescent in a dysphoric affect or the mother in NA, the mutual anger involving the father may be evidence of the withdrawn or passive witness role emerging in the depressed group (e.g., Davis et al., Reference Davis, Hops, Alpert and Sheeber1998). Furthermore, across interaction tasks, none of these triadic states were significant more than once, suggesting that the interactional context is an additional factor that can significantly moderate family processes associated with psychopathology.
Exploring these triadic states further, we found that depression was associated with greater mismatching and, conversely, less matching. This means that triads with depressed adolescents were less likely to share their anger, dysphoria, and happiness than were those without depressed adolescents. On the surface this may be somewhat surprising as it might be expected that getting locked into three-way mutual anger or dysphoria would be indicative of dysfunctional family processes. However, these results may better reflect the functional roles that may be fixed in the distressed families. For example, when anger is expressed by two triad members, the third may be a peacekeeper using humor to try to regulate their anger or a withdrawn witness who becomes dysphoric or neutral (Davis et al., Reference Davis, Hops, Alpert and Sheeber1998; Emery, Reference Emery1982; Pincus, Reference Pincus2001; Vuchinich et al., Reference Vuchinich, Emery and Cassidy1988). As highlighted above, the mutual adolescent–father anger with mother NA or the mutual mother–father anger with adolescent dysphoric implicate a withdrawn witness role. Alternatively, because of the ipsative nature of mutually exclusive and exhaustive affect codes, these results may reflect differences between groups in the amount of NA observed. Triads with depressed adolescents expressed more non-NA states, which may be reflected in their lower triadic mutual NA (NA/NA/NA) durations. Thus, matching and mismatching differences could have been driven by differences in the most common triadic state. However, if the triadic mutual NA was a significant difference above and beyond other states, it would have been one of the states found in the discriminant function analyses. Thus, our interpretation is that the NA explanation cannot fully account for the present results.
Theoretical implications
The present results can be interpreted through several theoretical models. First, interpersonal theories of depression are predicated on the primacy of intimate relationships in the formation and maintenance of depression (Joiner & Coyne, Reference Joiner and Coyne1999). Typically, this approach emphasizes the importance of each dyadic relationship. It is now possible to expand this understanding beyond dyadic relationships in the presence of others to more directly incorporate larger relationship systems. Second, family systems theory has provided rich accounts of family processes in the therapeutic context (Minuchin, Reference Minuchin1974; Restifo & Bogels, Reference Restifo and Bogels2009). Incorporation of dynamic systems methodologies, such as SSGs that can quantify the hypotheses derived from family-systems theory, is an important contribution to reduce the theory–method gap in developmental psychopathology (Granic & Hollenstein, Reference Granic, Hollenstein, Cicchetti and Cohen2006; Richters, Reference Richters1997). Third, several emerging models of adolescent psychopathology focus on the regulation of emotional arousal as a critical developmental process (Allen & Sheeber, Reference Allen and Sheeber2008; Steinberg, Reference Steinberg2007). In an interpersonal context such as the family system, both self- and coregulation modulate the rise and fall of affective states (Butler & Randall, Reference Butler and Randall2013). The present study integrated these interpersonal, systemic, and regulatory frameworks to move beyond a simple quantitative approach and to enhance the process approach to understanding depression.
Clinical implications
In the treatment of depression in youth, individual therapies are far more common (68%) than family-based interventions (Sander & McCarty, Reference Sander and McCarty2005). The evidence from previous research indicates quite clearly that affective processes within the family system are associated with the onset and continuation of depressive symptoms in youth (Davis et al., Reference Davis, Hops, Alpert and Sheeber1998; Schwartz et al., Reference Schwartz, Dudgeon, Sheeber, Yap, Simmons and Allen2011; Sheeber et al., Reference Sheeber, Davis, Leve, Hops and Tildesley2007; Sheeber & Sorenson, Reference Sheeber and Sorensen1998). Moreover, research on attachment-based family therapy indicates that the amelioration of caustic family processes and the emergence of warmer and more nurturing ones, reflective of improved relationship quality, results in the reduction of symptoms (Diamond, Siqueland, & Diamond, Reference Diamond, Siqueland and Diamond2003). This evidence suggests that adverse family processes are a prospective, modifiable risk factor that represent a target for preventative interventions. The present study adds to this growing body of evidence by identifying simultaneous affective states that distinguish the families of depressed teenagers. Family-based prevention and intervention strategies, like attachment-based family therapy, could focus on resistance to matched affect across all family members as a marker of distressed relationships or inability to coregulate affect that warrants attention in the intervention context. Furthermore, the present results indicate that a decontextualized therapeutic approach to regulating specific affective states (e.g., angry or dysphoric affect) neglects the functions of emotions in specific interpersonal contexts. Rather than a simple reduction of anger or dysphoria, informed interventions would focus on how, when, and with whom these affective states are expressed.
Limitations and future directions
The present study has extended previous investigations on family processes related to the development of depression. These data were well suited to examine triadic effects, yet there were some limitations. First, this study was cross-sectional. Thus, it is not clear whether these triadic processes would be prospectively associated with the emergence of depression in these adolescents or are phenomena that only emerge once symptoms are present. A prospective longitudinal design would be ideal to show the importance of triadic affect. Second, though we made the assertion that dyads are different from triads, this has not been shown directly. An ideal design would be to be able to compare depressed adolescents’ dyadic interactions with each parent to their interactions with both parents simultaneously. Third, though parents are primary socializers of emotion, siblings are also a significant influence and adolescents are also developing more intimate peer relationships. Because adolescents tend to socialize in small groups, peer affective processes related to depressive symptoms may be best understood in a broader social context. Such approaches would provide a richer understanding of how interpersonal affect transpires in diverse contexts and across multiple relationship types. Fourth, we have focused on a coherent subset of the wide range of analytical possibilities afforded by triadic state space research. Other conceptual regions such as NA from one or more of the interactants (Hollenstein & Lewis, Reference Hollenstein and Lewis2006), parenting categories such as harsh or permissive (Granic & Lamey, Reference Granic and Lamey2002; Granic et al., Reference Granic, O'Hara, Pepler and Lewis2007), mutual positivity (Lunkenheimer et al., Reference Lunkenheimer, Olson, Hollenstein, Sameroff and Winter2011), and even several others that are uniquely triadic (e.g., both parents negative while child is neutral or positive) have yet to be explored. Moreover, the state space grid technique allows for the analysis of state–state transitions and multistep transition sequences (e.g., mother dysphoric followed by father anger followed by child dysphoric; Butler, Hollenstein, Shoham, & Rohrbaugh, Reference Butler, Hollenstein, Shoham and Rohrbaugh2013). The present analyses only scratch the surface of possibilities. Fifth, analyzing families as systems, we have shown the utility of shifting the focus from dyads to triads. With this shift, it is also possible to go beyond the triad to examine families as they are (e.g., more than three members) rather than as we need them to be for our methodological pragmatics. Siblings, extended families, and complex family configurations (e.g., divorced and remarried) are all possible with the present approach. In addition to state space analyses, small group research also may provide tools for understanding family processes beyond the dyad (Arrow, McGrath, & Berdahl, Reference Arrow, McGrath and Berdahl2000; Pincus, Reference Pincus2001; Pincus, Ortega, & Metten, Reference Pincus, Ortega, Metten, Guastello and Gregson2010).
Conclusions
As a mood disorder, depression is fundamentally a disturbance in the experience, expression, and regulation of affect (Allen & Sheeber, Reference Allen and Sheeber2008). Emotions and affect are inherently social and, even when experienced without the physical presence of others, these states are fundamentally related to social goals (van Kleef, Reference van Kleef2010). Over the course of development, the primary interpersonal contexts in which affects and moods become habitual involve the family system. Thus, to be able to analyze patterns of interaction within a family as a system is an important advance for future research. State space grids are one way to realize this analytical need, and we look forward to continued advances in the understanding of the development of psychopathology with this and other techniques in the future.
Supplementary Materials
The supplementary materials for this article can be found online at http://dx.doi.org/10.1017/S0954579415000309.