Self-injurious behavior can be either suicidal or nonsuicidal (e.g., Nock, Reference Nock2010), but in both cases it, by definition, involves the deliberate infliction of harm on oneself. This definition bears a certain resemblance to classical ways of defining aggression in terms of behavior intended to induce physical or psychological harm (Berkowitz, Reference Berkowitz1993) and raises the question how self-harm is associated with the infliction of harm that occurs in aggression. Although aggressive behavior is often directed against others, there is hardly any doubt that it can be self-directed as well. In fact, self-injury has sometimes even been labeled “auto-aggression” (Kay, Wolkenfeld, & Murrill, Reference Kay, Wolkenfeld and Murrill1988; Muratori, Pisano, Milone, & Masi, Reference Muratori, Pisano, Milone and Masi2017).
Because self-harm involves the induction of physical harm, it is clearly relevant to ask to what extent it represents a form of aggression toward oneself. Could it be that such behavior is, by definition, a form of self-directed aggression, meaning that we could label it as “auto-aggression”? One argument against this conclusion is that the deliberate destruction of body tissue that occurs as part of nonsuicidal self-injury (NSSI) need not have self-harm as its ultimate goal.Footnote 1 On the contrary, the ultimate goal may be to serve well-being, and would be partly analogous to surgical procedures in medicine: although they destroy body tissue, they do not count as aggressive behavior because their goal is to improve the patient's well-being. Indeed, according to the emotion regulation model of NSSI (Andover & Morris, Reference Andover and Morris2014; Edmondson, Brennan, & House, Reference Edmondson, Brennan and House2016; Klonsky, Reference Klonsky2007, Reference Klonsky2009), individuals might self-injure to regulate their negative emotions (e.g., using physical pain to reduce emotional pain). If so, it may be misleading to label the behavior as aggressive by definition.
Even if self-harm is not defined as a form of self-directed aggression, it remains an important question as to what extent aggressive feelings are involved in self-harm. Although there are studies that have reported correlations between NSSI and aggression (Klonsky, Reference Klonsky2007; Laye-Gindhu & Schonert-Reichl, Reference Laye-Gindhu and Schonert-Reichl2005; Tang et al., Reference Tang, Ma, Guo, Ahmed, Yu and Wang2013), the nature of this association has seldom been examined. One possibility, which is compatible with the emotion regulation model of self-harm, is that the emotions regulated by self-harm are primarily aggressive (Lundh, Reference Lundh2016). The results from studies using ecological momentary assessment clearly suggest that aggressive feelings (both toward others and toward oneself) might be more strongly associated with NSSI than might other negative emotions such as fear or sadness (Armey, Crowther & Miller, Reference Armey, Crowther and Miller2011; Nock, Prinstein, & Sterba, Reference Nock, Prinstein and Sterba2009). For example, Nock et al. (Reference Nock, Prinstein and Sterba2009) found that the likelihood of engaging in NSSI was significantly greater when the participants felt anger toward themselves, self-hatred, or anger toward others, whereas feelings of fear and anxiety did not predict the occurrence of NSSI at all; the likelihood even decreased in the presence of feelings of sadness or worthlessness. Armey et al. (2012) similarly found support for the emotion regulation model, specifically regarding feelings of guilt, shame, and anger directed toward the self and others. This suggests that self-harm does not serve to regulate negative affect in general, but rather a specific subcategory of negative affect that centrally involves aggressive feelings, both toward others and toward oneself.
This notion is also consistent with research showing that increased levels of aggression toward others are associated not only with suicidal behavior and suicidal ideation (Conner, Swogger, & Houston, Reference Conner, Swogger and Houston2009; Gvion & Apter, Reference Gvion and Apter2011), but also with NSSI (Tang et al., Reference Tang, Ma, Guo, Ahmed, Yu and Wang2013). Barker, Arseneault, Brendgen, Fontaine, and Maughan (Reference Barker, Arseneault, Brendgen, Fontaine and Maughan2008), for example, found that adolescents who engaged in bullying (i.e., were repeatedly aggressive toward others) also tended to engage in self-harm. Similarly, Boxer (Reference Boxer2010) reported that self- and other-directed aggression covaried in a clinical inpatient sample of children and adolescents. There is also some evidence of a common neurobiology among suicide, self-harm, and other forms of aggressive behavior (Groschwitz & Plener, Reference Groschwitz and Plener2012; Mann & Currier, Reference Mann, Currier, Wasserman and Wasserman2009; Siever, Reference Siever2008). Taken together, these findings suggest that some individuals may engage in self-harm either because they are generally more aggressive (both toward others and themselves) than others are or because aggression and self-harm share underlying mechanisms.
However, it is also possible that aggression is associated with self-harm primarily in individuals who are at the same time victimized by others’ aggressive behaviors. Previous studies have shown that aggressive behavior can have both adaptive and maladaptive outcomes (Kawabata, Tseng, & Crick, Reference Kawabata, Tseng and Crick2014), which suggests that the relationship between aggression and self-harm might vary accordingly. It is possible that individuals who report elevated aggression and victimization are most strongly predisposed to engage in self-harm. Indeed, an overlap between aggression and victimization has been shown for various forms of aggression, from more violent forms of offending (Jennings, Higgins, Tewksbury, Gover, & Piquero, Reference Jennings, Higgins, Tewksbury, Gover and Piquero2010; Schreck, Stewart, & Osgood, Reference Schreck, Stewart and Osgood2008) to bullying (Barker et al., Reference Barker, Arseneault, Brendgen, Fontaine and Maughan2008; Farmer et al., Reference Farmer, Petrin, Robertson, Fraser, Hall, Day and Dadisman2010). In research on bullying in children and adolescents, the subgroup that exhibits this overlap are referred to as “bully-victims” to differentiate them from individuals who are aggressive but not the object of others’ aggression (“bullies”) and from nonaggressive individuals who are the object of others’ aggression (“victims”). Cook, Williams, Guerra, Kim, and Sadek (Reference Cook, Williams, Guerra, Kim and Sadek2010) conducted a meta-analysis to compare the predictors of these three groups (bullies, victims, and bully-victims). Interestingly, whereas holding negative attitudes and beliefs about others was a predictor of being a bully (i.e., either a bully or a bully-victim) but not a victim, possessing negative attitudes and beliefs about oneself was a predictor of being a victim (i.e., either a victim or a bully-victim) but not a bully.
This is consistent with Hooley, Ho, Slater, and Lockshin's (Reference Hooley, Ho, Slater and Lockshin2010) suggestion that the experiences of being victimized by others leads to the development of a “defective self-model,” whereby the experience of pain might be egosyntonic and self-affirming for people who believe themselves deserving of punishment and hold profoundly negative beliefs about themselves (see also Nock, Reference Nock, Prinstein and Sterba2009). If so, it is conceivable that victimization is associated with self-harm even in the absence of generally elevated levels of aggression. Victimization, including childhood abuse (Glassman, Weierich, Hooley, Deliberto, & Nock, Reference Glassman, Weierich, Hooley, Deliberto and Nock2007; Hecht, Cicchetti, Rogosch, & Crick, Reference Hecht, Cicchetti, Rogosch and Crick2014) and peer victimization (Fisher et al., Reference Fisher, Moffitt, Houts, Belsky, Arseneault and Caspi2012; Garisch & Wilson, Reference Garisch and Wilson2015; Heilbron & Prinstein, Reference Heilbron and Prinstein2010) is associated with self-harm. However, it is also possible that a certain degree of aggression is required if this “defective self-model” is to become expressed in direct, deliberate self-harm. In the latter case, victimization would be more strongly associated with self-harm in individuals who show elevated levels of aggression.
There is some evidence that the risk of self-harm is especially pronounced in individuals who suffer from both elevated aggression and victimization. Indeed, previous research has indicated that bully-victims exhibit more self-harm than do either bullies or victims (Barker et al., Reference Barker, Arseneault, Brendgen, Fontaine and Maughan2008), and that adolescents who are involved in “mutually hostile relationships” (i.e., hostility toward and from others) show more self-harm than do adolescents who are merely hostile to others or are the victims of others’ hostility (Latina & Stattin, Reference Latina and Stattin2016).
In this context, it is also important to take account of the differentiation between direct and indirect aggression. Research on aggressive behavior in children and adolescents originally focused on direct, physical forms of aggression, and found that these were more common among boys than among girls (Hyde, Reference Hyde1984). However, when research began to focus on less direct forms of aggression (e.g., gossiping, spreading rumors, social exclusion), which may damage the victim's self-esteem or social status rather than his or her body, other results were found. These forms of aggression, which have been labeled “indirect” (Björkqvist, Reference Björkqvist1994) or “relational” (Crick & Grotpeter Reference Crick and Grotpeter1995), were not more common among boys; in fact, some studies even indicated that they were more frequent among girls (Crick, Reference Crick1997). The validity of the distinction between direct and indirect aggression is supported by a number of factor-analytic studies (e.g., Crick & Grotpeter, Reference Crick and Grotpeter1995; Grotpeter & Crick, Reference Grotpeter and Crick1996; Vaillancourt et al., Reference Vaillancourt, Hymel and McDougall2003). Although Card, Stucky, Sawalani, and Little (Reference Card, Stucky, Sawalani and Little2008) described the gender difference in indirect aggression as “trivial,” other results indicate that it might not be so trivial. For example, Ettekal and Ladd (Reference Ettekal and Ladd2015) found that girls exhibiting a high relational (indirect) aggression trajectory from late childhood to early adolescence exhibited considerably higher levels of relational aggression compared with boys exhibiting a similar trajectory. Further, Lundh, Daukantaitė, and Wångby-Lundh (Reference Lundh, Daukantaitė and Wångby-Lundh2014) found a significant gender difference in victimization: Boys reported being more frequent victims of direct aggression, whereas girls reported being more frequent victims of indirect aggression. Although there is some evidence that not only direct but also indirect aggression is associated with NSSI (Tang et al., Reference Tang, Ma, Guo, Ahmed, Yu and Wang2013), we are not aware of any existing research that has studied this association from a person-oriented approach. Consequently, it may be of interest to include the direct and indirect differentiation in research on patterns of aggression and victimization and their relation to self-harm.
The present study
The main purpose of this study was to investigate which patterns of direct and indirect aggression and victimization are most clearly associated with self-harm in young adolescents, both cross-sectionally and prospectively, using a person-oriented approach. For this purpose, we used data from a two-wave longitudinal study of a community cohort, with a 1-year interval between the two measurements.
First, we hypothesized that a cluster analysis would reveal at least four major patterns of aggression and victimization in adolescent girls and boys, as follows: (a) high on both aggression and victimization, (b) high on aggression only, (c) high on victimization only, and (d) low on both. We expected to find the same clusters at both time points (i.e., the clusters would show structural stability) and that the same individuals would, for the most part, belong to the same clusters at both time points (i.e., the clusters would show individual stability). Additionally, because previous research has revealed gender differences in direct vs. indirect aggression and victimization, we explored the roles of these different forms of aggression and victimization in the profiles of the various subgroups of boys and girls.
Second, we tested two cross-sectional hypotheses: (a) all subgroups high in aggression and/or victimization would exhibit greater self-harm than would the subgroup of nonaggressive nonvictims and (b) the subgroup high in both aggression and victimization would exhibit the greatest levels of self-harm. These analyses were carried out at both time points to increase the validity of our conclusions.
Finally, we tested two hypotheses about the incidence of new cases of repetitive self-harm over the one-year period: (c) the aggressive victims pattern at Time 1 (T1) is a risk factor for the development of repetitive self-harm at Time 2 (T2), and (d) the aggressive nonvictims and nonaggressive victims patterns at T1 are also risk factors.
Method
Participants
The present study involves a community cohort containing all regular school students in Grade 7 (N = 532) and Grade 8 (N = 520) in a municipality with around 40,000 inhabitants in southern Sweden. To obtain data from as many students as possible, we offered extra questionnaire sessions following the first at each school for those students who were absent at that first session. Altogether, 991 of the 1052 students (94%) completed the questionnaires at T1. At T2 (1 year later), 984 students completed the questionnaire. The longitudinal sample included 883 individuals (452 girls and 431 boys) who had complete data for all direct and indirect aggression and victimization indicators at both time points.
Statistical analyses
Cluster analysis using LICUR
We performed a cluster analysis within the framework of the LICUR procedure (Bergman, Reference Bergman, Cairns, Bergman and Kagan1998) to identify direct and indirect aggression and victimization profiles; all subjects belonging to a single cluster were considered to have a similar profile. We used the SLEIPNER statistical package (Bergman & El-Khouri, Reference Bergman and El-Khouri2002) to conduct the cluster analyses because it affords several advantages over traditional methods of cluster analysis, including an analysis of the explained variance of cluster solutions, homogeneity coefficients of the clusters, and an explicit procedure to test the statistical significance of the cluster solution (using Monte Carlo simulations to create random data for comparison).
The cluster analysis was performed in three steps separately for boys and girls. First, multivariate outliers were identified and removed via the RESIDUE module. Second, the remaining subjects were cluster analyzed using Ward's (Reference Ward1963) agglomerative hierarchical method. Four criteria guided our extraction of an appropriate number of clusters: (a) theoretical meaningfulness of the cluster solution; (b) a pronounced drop in explained error sum of squares (EESS) occurs when a cluster solution with one less cluster is extracted; (c) the number of clusters is no more than 15 and no less than 5; and (d) the size of EESS for the chosen cluster solution should preferably not be less than 67%, and at the very least, exceed 50% (Bergman, Reference Bergman, Cairns, Bergman and Kagan1998). Finally, a data simulation was carried out to verify that the EESS was higher than could be expected on a random data set.
Our evaluation of the trustworthiness and explanatory power of the clusters was done in the following ways.
1. We examined the degree of homogeneity of the clusters (i.e., the extent to which the cluster means in the variables represented the individual profiles belonging to each cluster). To do this, we computed the averaged squared Euclidean distances (ASEDs) between all of the members of a cluster, thus arriving at the homogeneity coefficient (hc). For the total cohort (i.e., a one-cluster solution), the hc is 2.00 for standardized variables. As a rule of thumb, an hc <1.00 for a cluster is highly desirable and a value <.50 indicates a reasonably homogenous cluster.
2. The RELOCATE module of SLEIPNER was used to improve the homogeneity of the clusters. The module starts from an initial classification and moves cases from one cluster to another if that leads to a reduction in the total error sum of squares of the cluster solution. In this way, ill-fitting objects are moved to better fitting clusters, thereby leading to more homogeneous clusters.
3. The CENTROID module of SLEIPNER was used to study the structural stability of the cluster solution by comparing the results obtained at T1 with those obtained at T2 separately for girls and boys. The clusters were matched pairwise over time, starting with the two most similar clusters (i.e., the two clusters with the shortest ASED). An ASED of 0 indicates a perfect match.
4. The EXACON module in SLEIPNER was used to examine the individual stability over the 1-year period. The cluster solutions from T1 and T2 within each gender were cross-tabulated and exact tests on single cells in two-way contingency tables using hypergeometric probabilities were performed. In addition to conducting these analyses of individual stability, we tested the significance of the possible developmental pathways that indicate individual changes from one cluster to another.
Questionnaires
Aggression and victimization were measured using four five-item subscales from the Positive and Negative Interpersonal Behaviors Inventory (for details, see Lundh, Daukantaitė, & Wångby-Lundh, Reference Lundh, Daukantaitė and Wångby-Lundh2014). The scales used were: Direct aggression (e.g., “How often do you hit or kick somebody?”); Indirect aggression (e.g., “How often do you try to make others dislike someone?”); Direct victimization (e.g., “How often does somebody yell negative words at you?”); and Indirect victimization (e.g., “How often does somebody spread untrue or mean rumors about you?”). Each item is rated on a 5-point response format ranging from 1 (never) to 5 (very often). The subscales all show good internal consistency, with Cronbach alpha values ranging from α = .70 to α = .86 in the present study.
Deliberate self-harm was measured using a shortened and modified form of the Deliberate Self-harm Inventory (DSHI) validated by Gratz (Reference Gratz2001) and adapted to adolescents by Bjärehed and Lundh (Reference Bjärehed and Lundh2008). In the present revised nine-item version of the inventory (DSHI-9r; Lundh, Wångby-Lundh, & Bjärehed, Reference Lundh, Wångby-Lundh and Bjärehed2011), respondents are asked if they have deliberately engaged in any of nine different forms of self-harm (i.e., cutting, minor cutting causing bleeding, burning, carving, severe scratching, biting, sticking sharp objects into the skin, punching/banging oneself, and preventing wounds from healing) over the past 6 months, using a scale from 0 (never) to 6 (more than five times). Repetitive self-harm is defined as at least five instances of self-injury over the past 6 months. The total score (between 0 and 54) of the DSHI-9r is calculated by summing the item scores. A principal component analysis was conducted on these nine items using an orthogonal (varimax) rotation. A single component meeting the Kaiser criterion (eigenvalue >1) and explaining 57.6% of the variance was revealed (Lundh et al., Reference Lundh, Wångby-Lundh and Bjärehed2011). In the present study, the internal consistency (Cronbach alpha) was α = .90.
Procedure
This study was approved by the Regional Ethics Committee at Lund University. Contact was established with the school headmasters, who permitted their schools’ participation in the study. Information about the procedure and purpose of the study was sent to the parents, who were asked to contact the schoolteachers or researchers if they did not want their child to participate. The respondents were then informed that this was a research project about young people today, seeking to understand how they feel as well as how they perceive themselves, their feelings, their relations, and their life situation. They were also informed that their participation was voluntary, that their answers would be treated confidentially, and that no school personnel would have access to their answers. The respondents did not receive any compensation for their participation.
The instruments used in the present study were contained in an 11-page questionnaire also assessing other phenomena not relevant to this study. All participants completed the questionnaires in school as part of a separate lecture hour. The questionnaires were administered by research assistants from Lund University who were either licensed psychologists or graduate students of psychology. A teacher was present during, but did not participate in, the data collection. The students were instructed to answer all questions as best they could, but to not think too much about their answers. Furthermore, they were instructed to not write their names anywhere on the questionnaire. Each questionnaire was assigned a code number so that the students’ answers on the two test occasions could be matched while preserving confidentiality. After participants completed the questionnaire, they sealed it in an envelope.
Results
How does self-harm correlate with aggression and victimization?
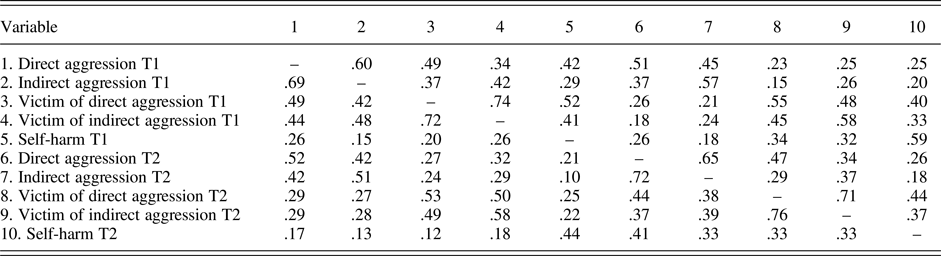
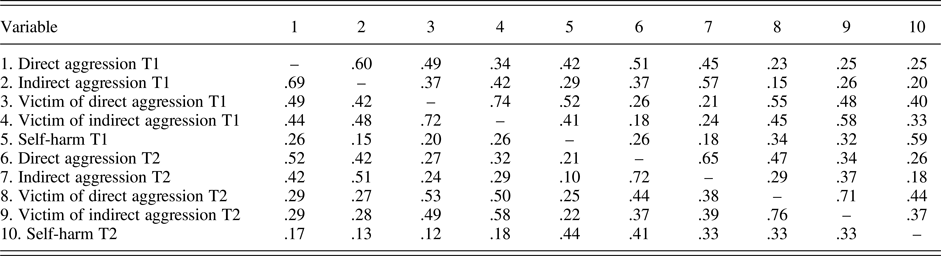
Pearson correlational analyses were conducted separately for boys and girls to evaluate the relationships of self-harm with direct and indirect aggression and victimization at T1 and T2. As shown in Table 1, among girls (but not boys) self-harm showed consistently larger correlations with victimization (ranging from .37 to .52) than with aggression (ranging from .18 to .42). A comparison using the z test showed that the correlations with victimization were significantly larger for both the direct and indirect forms at T2 (p = .002), and for the indirect forms at T1 (p < .05), but only marginally for the direct forms at T1 (p = .066).
Zero-order correlations between the Positive and Negative Interpersonal Behaviors Inventory Aggression and Victimization Scales and Self-Harm for girls (n = 452) above the diagonal, and boys (n = 431) below the diagonal
Note: All correlations ≥ .17 are significant at p < .001. All other correlations significant at p < .05.
Highly significant longitudinal relationships were found between the two time points for each type of aggression and victimization (ranging from .51 to .58 for both genders) and for self-harm (.59 for girls and .44 for boys), indicating relative stability of the behaviors for both genders.
The identification of aggression-victimization patterns
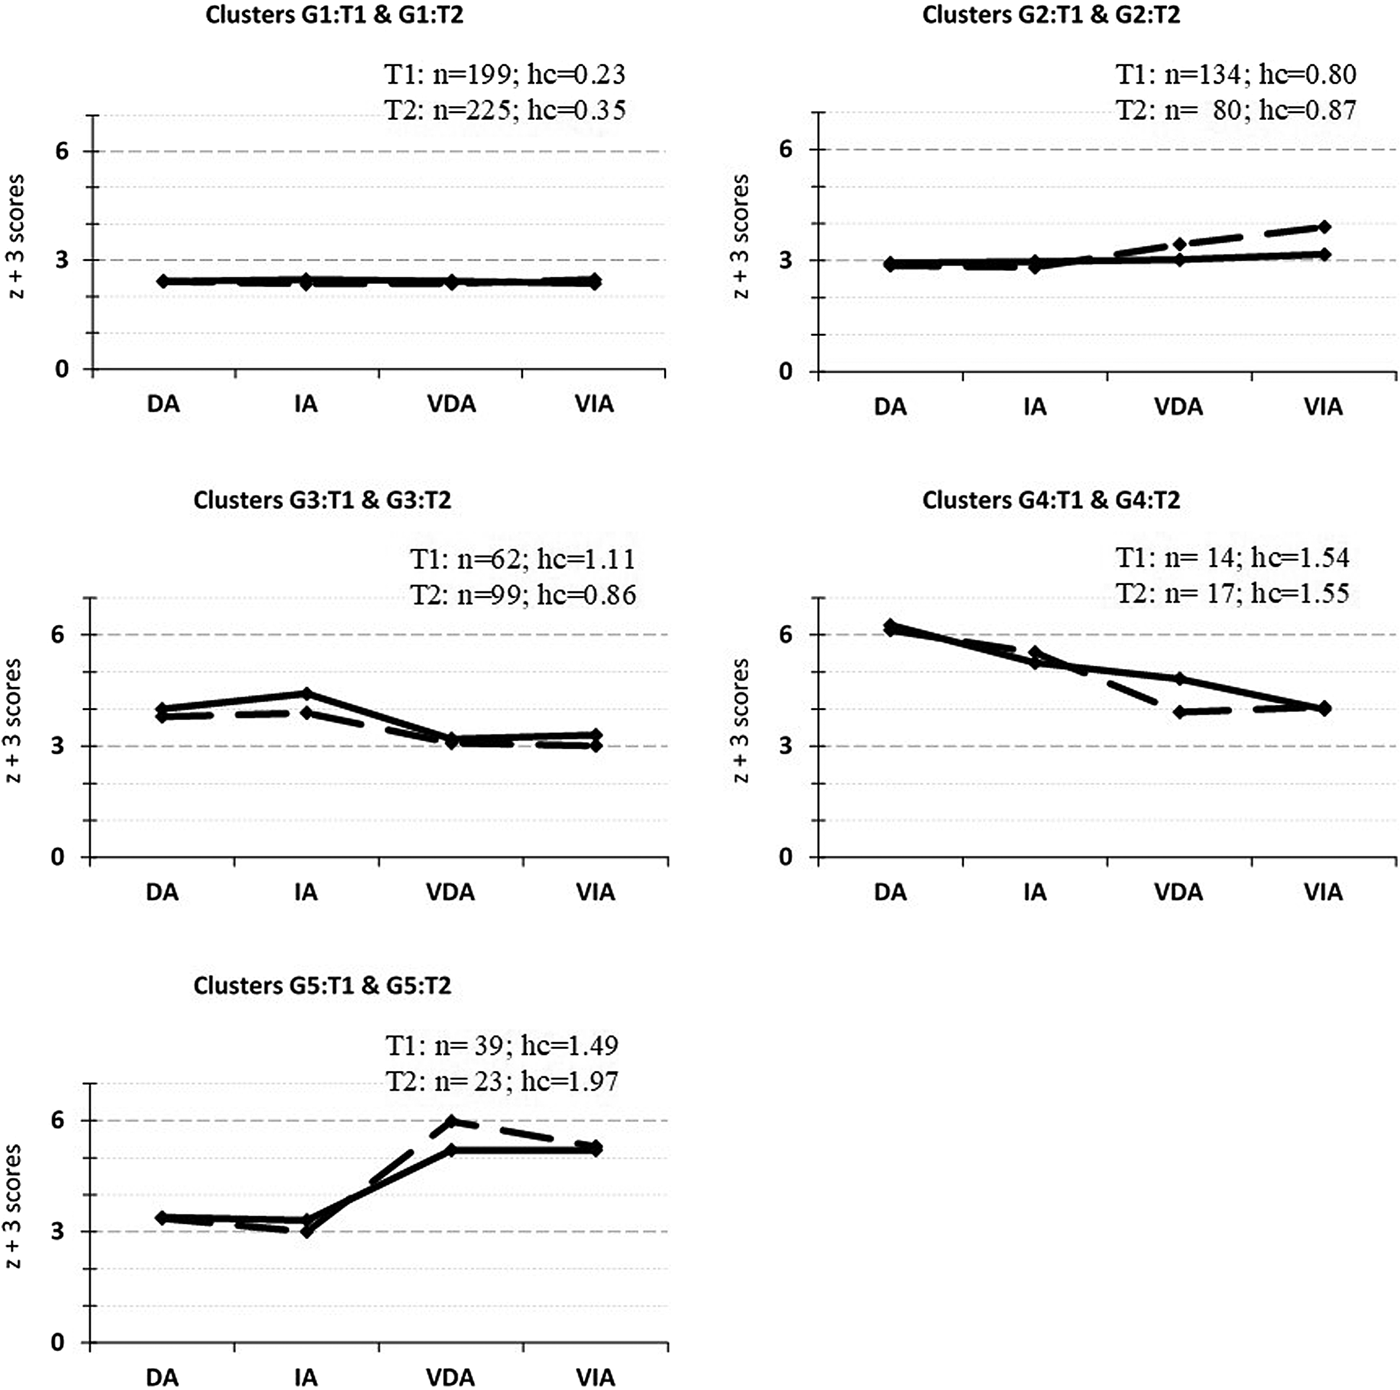
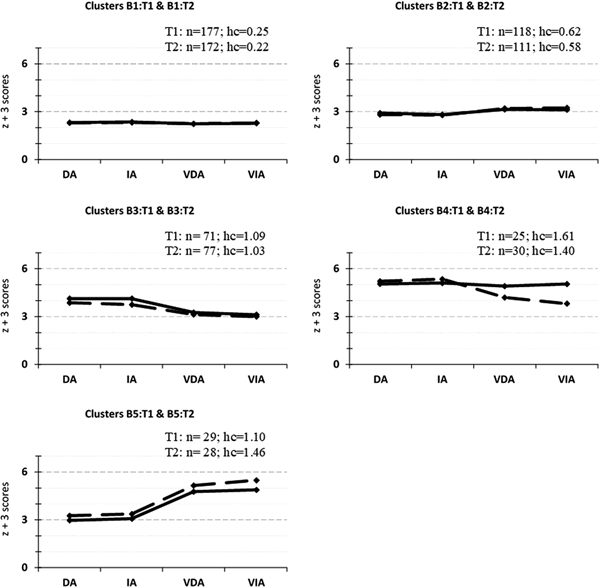
Following the rationale outlined in the Methods section, we performed four separate cluster analyses. Before doing so, we removed 15 outliers (4 girls and 11 boys) at T1 and 21 outliers (8 girls and 13 boys) at T2; thus, the final samples with complete direct and indirect aggression and victimization data included 448 girls and 420 boys at T1, and 444 girls and 418 boys at T2. Following the LICUR criteria for deciding on the suitable number of clusters, a five-cluster solution was chosen for both girls and boys at both time points. The explained variances were highly similar for all solutions, 67% and 66% for girls and 69% and 69% for boys, at T1 and T2, respectively, and were regarded as satisfactory. In Figures 1 and 2, the mean profiles are presented graphically for the cluster solutions. Based on the ASEDs examined by the CENTROID procedure in SLEIPNER, the clusters were matched pairwise over time, separately for each gender, starting with the two most similar clusters (i.e., the two clusters with the shortest ASED) and proceeding with the two most similar of the remaining clusters, etc., until all clusters from T1 were paired with a cluster from T2.
Graphical illustration (solid line for T1 and dotted line for T2) of the typical PANIBI profiles in a 5-cluster solution of four indicators related to the girls’ own aggressive behaviour and the aggressive behaviour that they experience from others. All variables were transformed to z+3 scores based on the subsample of girls. Note. DA = Direct Aggression; IA = Indirect Aggression; VDA = Victim of Direct Aggression; VIA = Victim of Indirect Aggression; hc = homogeneity coefficient.

Graphical illustration (solid line for T1 and dotted line for T2) of the typical PANIBI profiles in a 5-cluster solution of four indicators related to the boys’ own aggressive behaviour and the aggressive behaviour that they experience from others. All variables were transformed to z+3 scores based on the subsample of boys. Note. DA = Direct Aggression; IA = Indirect Aggression; VDA = Victim of Direct Aggression; VIA = Victim of Indirect Aggression; hc = homogeneity coefficient.

Aggression-victimization patterns in girls
As shown in Figure 1, similar clusters were obtained at both time points, indicating a generally good structural stability. Data simulation indicated that the EESS at both time points was significantly higher than what would be expected by chance (p < .01).
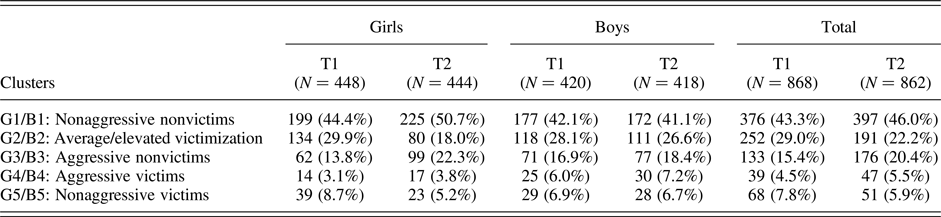
Clusters G1:T1 (44.4%) and G1:T2 (50.7%) were defined as the nonaggressive nonvictims clusters and included girls who reported low levels of both direct and indirect aggression and victimization. Cluster G2:T1 (29.9%) was defined as the average aggression/victimization cluster and included girls who reported average levels of direct and indirect aggression and victimization, whereas Cluster G2:T2 (18.0%) was defined as an elevated victimization cluster and included girls who reported above average on victimization and average levels of aggression. Clusters G3:T1 (13.8%) and G3:T2 (22.3%) were both defined as the aggressive nonvictims and included girls who reported above average on aggression and about average on victimization. Clusters G4:T1 (3.1%) and G4:T2 (3.8%) were defined as the aggressive victims and included girls who reported very high levels of both aggression and victimization. Finally, clusters G5:T1 (8.7%) and G5:T2 (5.2%) were defined as the nonaggressive victims and included girls who reported average levels of aggression but very high levels of victimization.
Homogeneity
Three clusters (G1–G3) were reasonably homogeneous; however, G4 and G5 (at both time points) were less homogeneous, with the homogeneity coefficients substantially >1. As such, these clusters could be characterized as “extreme clusters,” whose lower homogeneity is the result of having more extreme cases.
Individual stability
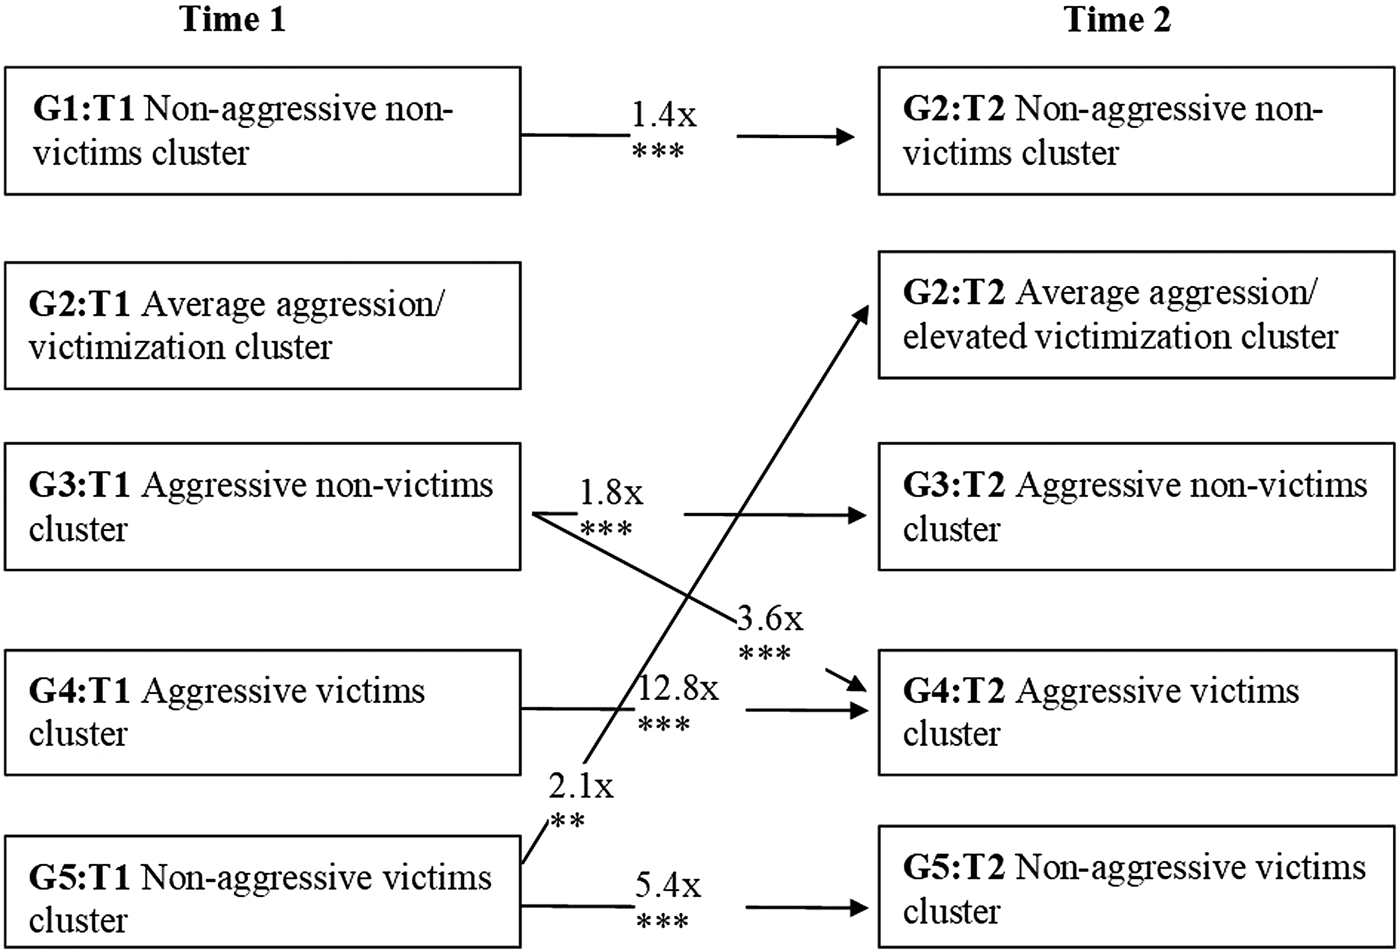
In addition to being structurally stable, four of these clusters showed individual stability. As shown in Figure 3, girls who started in one of these four clusters at T1 were 1.4–12.8 times more likely to be in a similar cluster 1 year later than would be expected by chance. Interestingly, the relatively extreme clusters (Clusters G4 and G5) showed high individual stability over the 1-year period; in contrast, the average aggression/victimization cluster did not. There also were two pathways indicating individual changes: Aggressive nonvictims were significantly more likely than would be expected by chance to end up in the aggressive victims cluster. In the other direction, nonaggressive victims were significantly more likely than would be expected by chance to move to the less problematic elevated victimization cluster (G2:T2).
Significant longitudinal stability of the clusters between Time 1 and Time 2 for girls. Note. Numbers on the arrows indicate how many times more the developmental pathway was observed as compared to what would be expected from chance alone.

Aggression-victimization patterns in boys
As shown in Figure 2, the results indicated good structural stability in boys; as for girls, similar clusters were obtained at both time points. Data simulation showed that the EESS at both time points was significantly greater than what would be expected by chance (p < .01).
Clusters B1:T1 (42.1% of the boys at T1) and B1:T2 (41.1% of the boys at T2) were defined as the nonaggressive nonvictim clusters, and included boys who reported low levels of aggression and victimization. Clusters B2:T1 (28.1%) and B2:T2 (26.6%), defined as the average aggression/victimization clusters, included boys who reported average levels of aggression and victimization. Clusters B3:T1 (16.9%) and B3:T2 (18.4%) were defined as the aggressive nonvictims and included boys who reported above average aggression and about average victimization. Clusters B4:T1 (6.0%) and B4:T2 (7.2%), defined as the aggressive victims, included boys who reported very high levels of both aggression and victimization. Finally, Clusters B5:T1 (6.9%) and B5:T2 (6.7%) were defined as the nonaggressive victims and included boys with average aggression and very high levels of victimization.
Homogeneity
Clusters B1 and B2 were reasonably homogeneous at both time points; however, B3, B4, and B5:T2 were less homogenous, showing homogeneity coefficients >1.
Individual stability
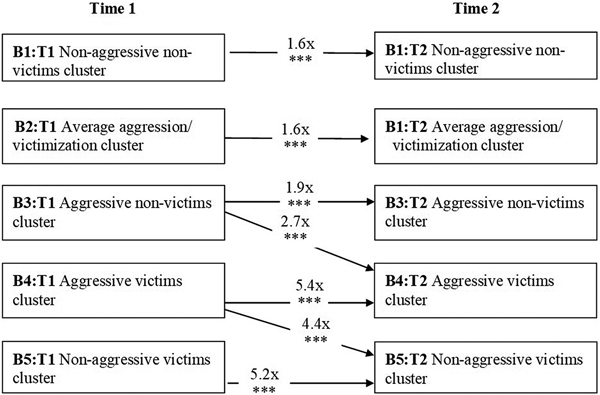
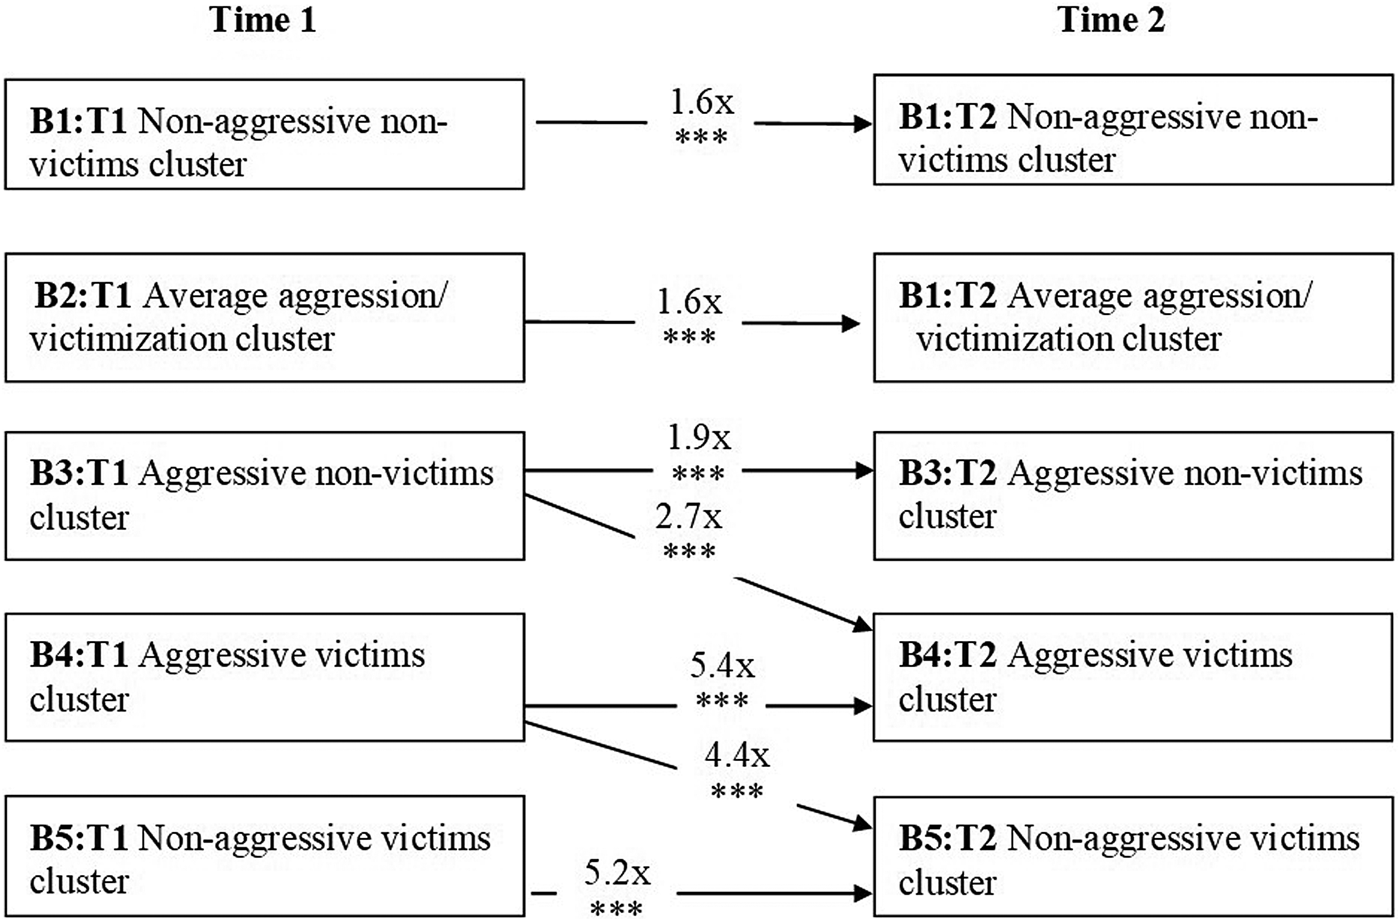
As shown in Figure 4, all five patterns showed individual stability; that is, boys who started in a specific cluster at T1 had a 1.6–5.4 times greater likelihood than would be expected by chance of ending up in a similar cluster 1 year later. Two specific pathways also showed notable individual change: A significant proportion of the boys in the aggressive non-victims cluster moved to a more extreme cluster, the aggressive victim cluster, at T2. Additionally, a significant proportion of the boys who belonged to the aggressive victims cluster moved to the nonaggressive victim cluster; in other words, even as their levels of aggression decreased, their levels of victimization remained high.
Significant longitudinal stability of the clusters between Time 1 and Time 2 for boys. Note. Numbers on the arrows indicate how many times more the stability was observed as compared to what would be expected from chance alone.
Gender comparison of patterns across 1 year
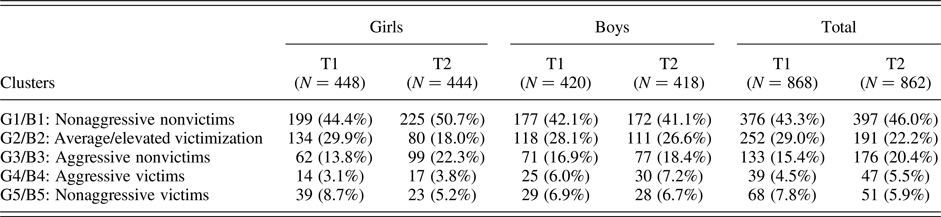
As seen in Table 2, the percentage of boys included in different clusters remained almost the same over the 1-year period, whereas the percentage of girls included in different clusters fluctuated much more. For instance, the percentage of girls included in the nonaggressive nonvictims cluster (44.4% and 50.7% for T1 and T2, respectively) and the aggressive nonvictims cluster (13.8% and 22.3% for T1 and T2, respectively) increased markedly at T2. On the other hand, the percentage of girls included in the average/elevated victimization cluster (29.9% and 18.0% for T1 and T2, respectively) and the nonaggressive victims cluster (8.7% and 5.2% for T1 and T2, respectively) decreased at T2. There were not any significant gender differences at any of the time points.
Comparison of cluster sizes between the genders at two time points
How is self-harm associated cross-sectionally with the aggression-victimization patterns?
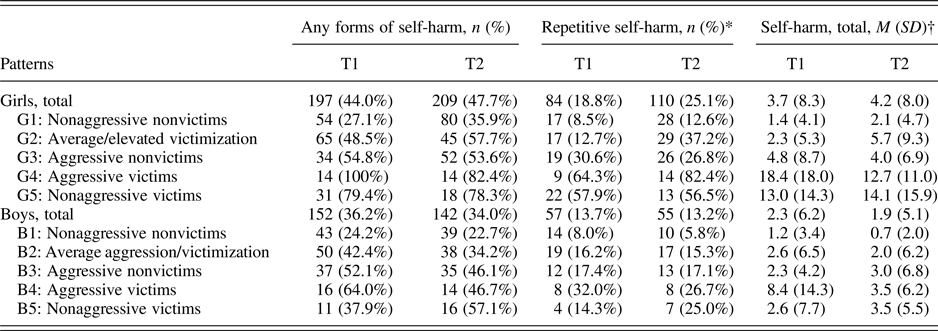
Table 3 presents the mean scores and prevalence of self-harm for the different clusters among boys and girls.
Mean (SD) and prevalence (%) of different forms of self-harm for the typical aggression and victimization patterns at T1 and T2 among girls and boys
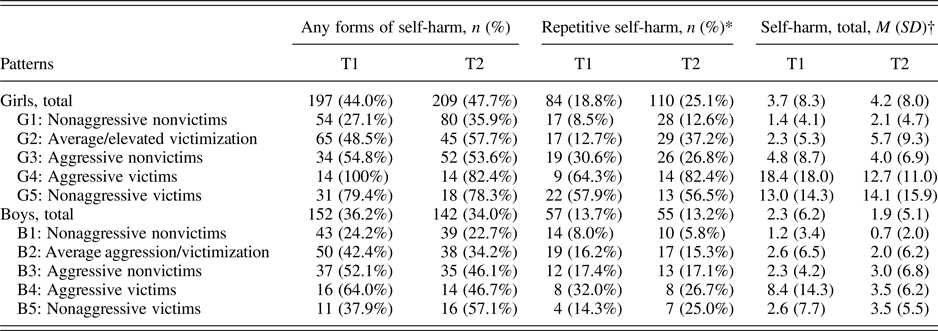
Note: *Repetitive self-harm defined as at least five instances of self-injury. †Results of two one-way analyses of variance indicate significant differences on self-harm among girls’ clusters at T1, F (4,442) = 36.1, p < .001, partial η2 = .25; Tukey post hoc: G4, G5 > G3 > G1, G2, and at T2, F (4,433) = 21.5, p < .001, partial η2 = .17, Tukey post hoc: G4, G5 > G2, G3 > G1.
Results of two one-way analyses of variance indicate significant differences on self-harm among boys’ clusters at T1, F (4,410) = 8.2, p < .001, partial η2 = .07; Tukey post hoc: B4 > B1, 2, 3, 5, and at T2, F (4,412) = 4.8, p < .001, partial η2 = .05, Tukey post hoc: B3, B4, B5 > B1.
Girls
As shown in Table 3, Hypothesis (a) received support at both T1 and T2: the aggressive victims, aggressive nonvictims, and nonaggressive victims all showed greater self-harm than did the nonaggressive nonvictims. Hypothesis (b), on the other hand, was only partly supported: Although the aggressive victims showed greater self-harm than did the aggressive nonvictims at both T1 and T2, they did not differ significantly from the nonaggressive victims at any time point. The aggressive victims and the nonaggressive victims clusters also reported the highest percentage of repetitive self-harm at both time points (aggressive victims: 64.3% and 82.4%; nonaggressive victims: 57.9% and 56.5% at T1 and T2, respectively). Interestingly, repetitive self-harm was found to have increased in two of the remaining clusters over the 1-year period (nonaggressive nonvictims from 8.5% to 12.6% and average/elevated victimization cluster from 12.7% to 37.2% at T1 and T2 respectively), although the levels of self-harm were not as striking as in the most problematic clusters.
Boys
As shown in Table 3, the results differed between T1 and T2. There was clear support for Hypothesis (b), but only at T1: the aggressive victims showed significantly greater self-harm than did all the other clusters. In contrast, Hypothesis (a) was supported only at T2: the aggressive victims, the aggressive nonvictims, and the nonaggressive victims all showed greater self-harm than did the nonaggressive nonvictims.
The prospective prediction of new cases of repetitive self-harm
As shown in Table 3, repetitive self-harm, defined as at least five instances of self-injury, was reported by 18.8% of the girls at T1 and 25.1% of the girls at T2; among the boys, the corresponding figures were 13.7% and 13.2%, respectively. A new case of repetitive self-harm was defined to occur when a participant reported at least five instances of self-harm at T2 but reported less than five instances at T1. The incidence of new cases of repetitive self-harm at T2 was 15.6% (56 of 359) among the girls and 10.2% (37 of 364) among the boys.
To test Hypotheses (c) and (d) we used logistic regression analysis to determine whether direct and indirect aggression and victimization patterns at T1 would predict the incidence of new cases of repetitive self-harm at T2 among girls and boys. The original categorical cluster variable, which had five different values, was recoded into four dummy variables with the nonaggressive nonvictims cluster (G1:T1 and B1:T1 for girls and boys, respectively) as the reference. These dummy variables were then used as predictors. Repetitive self-harm was also recoded as a dummy variable (1 = individuals who reported repetitive self-harm at T2, but not at T1; 0 = individuals who did not report repetitive self-harm at T1 or T2) and used as an outcome variable.
Girls
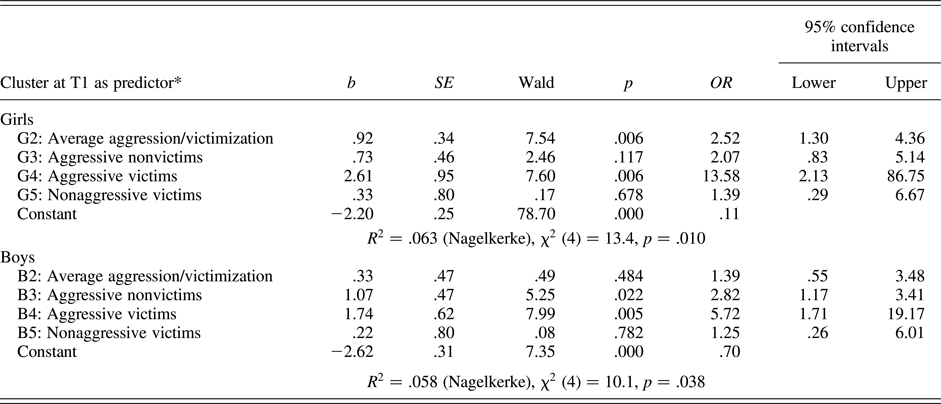
As shown in Table 4, the model was significant for girls, χ2 (4) = 13.4, p = .010, explaining 6.3% of the variance (Nagelkerke R2 = .063). Two aggression and victimization patterns made unique statistically significant contributions to the model: the average aggression/victimization cluster (p = .006) and the aggressive victims cluster (p = .006). Therefore, although Hypothesis (c) was supported, Hypothesis (d) was not. The strongest predictor of developing repetitive self-harm was being part of the aggressive victims pattern (odds ratio 13.58). In other words, among girls who did not show repetitive self-harm at T1, those in the aggressive victims pattern had 13-fold greater odds of developing repetitive self-harm over a 1-year period compared with those who did not have this pattern (while controlling for the other factors in the model).
Results of logistic regressions predicting incidence of new cases of repetitive self-harm at T2
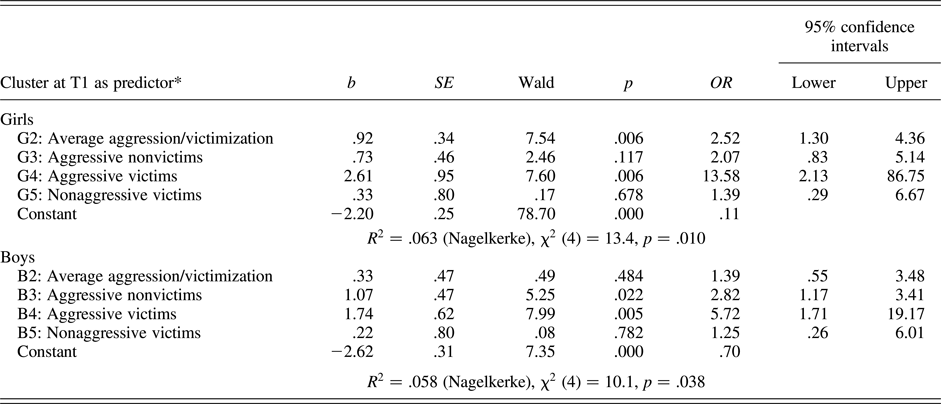
Note: *The original categorical cluster variable, taking five different values, was recoded into four dichotomous dummy variables with the nonaggressive nonvictims cluster (G1:T1 and B1:T1 for girls and boys, respectively) as the reference. For instance, cluster G2:T1 and cluster B2:T1 is coded “1” if a person is a member of that cluster, otherwise coded “0.”
Boys
As shown in Table 4, the model was also significant for boys, χ2 (4) = 10.2, p = .038, explaining 5.8% of the variance (Nagelkerke R2 = .058). Again, two aggression and victimization patterns made unique statistically significant contributions to the model: the aggressive victims cluster (p = .005) and the aggressive nonvictims cluster (p = .022). Therefore, Hypothesis (c) was supported, but Hypothesis (d) was not. Just like for girls, the strongest predictor of developing repetitive self-harm over the 1-year period was being in the aggressive victims pattern (odds ratio 5.42). More specifically, among boys without repetitive self-harm at T1, those who had an aggressive victims pattern had 5-fold greater odds of developing repetitive self-harm over the 1-year period compared with those who did not have this pattern (while controlling for the other factors in the model).
Discussion
The present study confirms that deliberate self-harm is associated with both aggression and victimization, and particularly with the combination of high aggression and high victimization. The expected subgroups of aggressive victims, nonaggressive victims, and aggressive nonvictims were identified in both boys and girls, along with a subgroup of nonaggressive nonvictims and a “middle” (i.e., average aggression/victimization) group. With the exception of the middle cluster among girls, all of these patterns showed significant individual stability over 1 year.
Of the two cross-sectional hypotheses, the first hypothesis (that aggressive victims, aggressive nonvictims, and nonaggressive victims would all show greater self-harm than would nonaggressive nonvictims) was confirmed among the girls at both time points, and among the boys at T2. The second hypothesis (that aggressive victims would show more self-harm than would all the other groups) was confirmed only among boys, and only at T1.
The importance of the aggressive-victims pattern for developing self-harm appeared clearly in the prospective analyses. This pattern turned out as a significant risk factor for the incidence of new cases of repetitive self-harm among both girls and boys. Although one other pattern also showed up as a risk factor in this regard in each gender, it is interesting to note that these differed between the genders: Among the girls, the pattern of average aggression and victimization showed up as a predictor, whereas among the boys an aggressive nonvictim pattern was a significant predictor. We discuss these results in more detail in the following section.
Aggression-victimization patterns and self-harm
The correlational analysis showed consistently stronger associations of self-harm with victimization than with aggression among girls, whereas no such pattern was seen among boys. This seems to indicate that victimization is more important than is aggression for understanding self-harm in girls, whereas this is not true among boys. The person-oriented analyses, however, reveal a considerably more nuanced picture of these associations.
First, regarding the relation between aggression and self-harm, the person-oriented analysis identified a subgroup of girls who scored high on aggression but not on victimization (aggressive nonvictims). These girls reported significantly greater self-harm than did those who were low on both victimization and aggression (nonaggressive nonvictims), which suggests that aggression might have a role also at low levels of victimization. Simultaneously, the results indicate that high victimization is associated with self-harm even at low levels of aggression, as seen most clearly in the high scores on self-harm reported by the subgroup of nonaggressive victims. Altogether, our findings indicate that there are important subgroups of self-harming girls, where some are high on aggression (but not victimization), others are high on victimization (but not on aggression), and still others are high on both aggression and victimization. Therefore, girls who engage in self-harm may be a heterogeneous group requiring a differentiated treatment approach.
This conclusion is partly corroborated by the prospective analyses among girls. Although the aggressive victim pattern was a risk factor of the development of repetitive self-harm, this was also the case with a pattern of average aggression/victimization. This latter result was unexpected: why would a pattern of average scores on aggression and victimization be a risk factor? One possible clue to an explanation is the demonstrated instability of this pattern- in fact, the average aggression/victimization cluster was the only cluster at T1 that did not show individual stability over the one-year period. Furthermore, the average aggression/victimization cluster was not found at T2. We also did not observe a significant stream from this cluster to any other cluster at T2. Taken together, these results suggest that this average pattern represents an unstable state among girls of this age, which leads to the question of whether the instability itself is a risk factor of negative outcomes.
The results among the boys differed from those among the girls. First, the subgroup of boys who reported high victimization in the absence of high aggression (nonaggressive victims) did not report consistently elevated levels of self-harm like those observed in girls. Second, being in the subgroup with high aggression in the absence of high victimization (aggressive nonvictims) was a risk factor for repetitive self-harm at T2, a pattern not seen among the girls. This suggests that patterns characterized by high aggression might have a larger role in the development of self-harm among boys than might the patterns characterized by high victimization, whereas the opposite may be true among girls.
The present results are partly consistent with some previous studies that found higher levels of self-harm in bully-victims than in either bullies or victims (Barker et al., Reference Barker, Arseneault, Brendgen, Fontaine and Maughan2008), and in adolescents involved in “mutually hostile relationships” (i.e., hostility both toward and from others) than in adolescents who are merely hostile to others or are the victims of others’ hostility (Latina & Stattin, Reference Latina and Stattin2016). However, the present results paint a more differentiated picture: in particular, these patterns differ between the genders.
Of interest is also that the person-oriented analysis did not point to any important differentiation between indirect and direct varieties of aggression or victimization in the cluster profiles. On the contrary, in the clusters that showed the most self-harm, the levels of direct and indirect forms of aggression and victimization were similar. These results partially coincide with those of Marsee et al. (Reference Marsee, Frick, Barry, Kimonis, Cenifanti and Aucoin2014), who similarly found a strong correspondence between physical and relational aggression in adolescent boys and girls classified as aggressive, although the correspondence was slightly weaker for girls, who showed clearer signs of higher relational aggression.
Individual stability and change
Although almost all the cluster profiles showed significant individual stability, we did also observe some interesting gender-specific developmental changes at the individual level. As previously mentioned, (a) the average aggression/victimization cluster among the girls was no longer found at T2. Furthermore, (b) the nonaggressive nonvictims cluster among girls became considerably more common over the year, (c) a new cluster appeared at T2 (i.e., the elevated victimization cluster), and (d) there was a significant flow from the aggressive nonvictim to the aggressive victim cluster. These changes led to an overall increase in the proportion of girls with problem profiles (i.e., profiles characterized by elevated scores of aggression and/or victimization). Taken together, they signify a polarization among girls: that is, there was an increase in both girls with nonproblem profiles and girls with problem profiles.
Among the boys, no evidence of polarization was found, but some significant developmental pathways appeared, indicating a movement from aggression to victimization among boys, in two separate “steps.” As for girls, there was a significant flow from the aggressive nonvictim to the aggressive victim cluster. In addition, however, there was a significant flow from the aggressive victim to the nonaggressive victim cluster. That some boys’ profiles changed from an aggressive to an aggressive-victimized pattern is consistent with findings by Kawabata et al. (Reference Kawabata, Tseng and Crick2014), who showed that physical aggression predicted more physical victimization, as well as those by Giesbrecht, Leadbeater, and MacDonald (Reference Giesbrecht, Leadbeater and MacDonald2011), who found that teacher-rated aggression was associated with increases in physical and relational victimization over 3 years. The results, however, contradict the findings by Barker et al. (Reference Barker, Arseneault, Brendgen, Fontaine and Maughan2008) and Haltigan and Vaillancourt (Reference Haltigan and Vaillancourt2014), which proposed that overall victimization in adolescents increases the likelihood of bullying to a greater extent than bullying increases the likelihood of victimization.
The high level of self-harm reported by both genders (particularly girls) in the aggressive victims clusters, coupled with the fact that the aggressive victims pattern was a risk factor for the development of repetitive self-harm, is a cause for concern. In particular, about 30% of boys and 70% of girls in the aggressive victims cluster reported repetitive self-harm (i.e., at least five instances of self-injury) at each time point. Moreover, having this pattern at T1 was the strongest predictor of repetitive self-harm at T2. The individual stability of this pattern and its consistent association with high and increasing levels of self-harm suggest that adolescents of both genders who show this aggression-victimization profile probably require more advanced help than can be provided at schools (which typically takes the form of antibullying interventions) (Rigby, Reference Rigby2010). Repetitive self-harm, in addition to extremely high levels of aggression and victimization, might provide warning signs of severe psychopathology, for example in the form of adolescent borderline personality disorder (Kaess, Brunner, & Chanen, Reference Kaess, Brunner and Chanen2014). It has been suggested that early identification and treatment of youth with borderline personality disorder can reduce the chronicity and related adverse health outcomes for adolescents (Lenzenweger & Cicchetti, Reference Lenzenweger and Cicchetti2005; McGorry, Reference McGorry2013; Patel, Flisher, Hetrick, & McGorry, Reference Patel, Flisher, Hetrick and McGorry2007; Shiner, Reference Shiner2009) and thereby improve the psychological and learning climate at home and in school for their parents, schoolmates, and school personnel.
Strengths and limitations
This study has several strengths. First, this is, to our knowledge, the first study that uses a longitudinal design in the study of direct and indirect aggression, victimization, and self-harm among young adolescents. Second, we used an advanced form of cluster analysis that allowed us to validate the cluster solutions in a more sophisticated way, including the amount of variance explained, homogeneity coefficients, and the statistical significance of the cluster solutions. Third, the sample was a large, representative community sample of adolescents with at 94% of response rate at T1 and 85% at T2.
The study also has some weaknesses. First, the data analyzed were entirely from self-reports. The main shortcomings of such data concern the shared-method variance, conscious distortion, social comparison, and situational and contextual factors that, to some degree, limit drawing stronger conclusions. To verify these results, researchers might employ a multimethod approach including structured interviews, peer reports, or parent and teacher reports in future studies. Second, although we used a large sample, the participants were all drawn from a single municipality in Sweden, which means that some potential local bias might exist, although this municipality was specifically chosen because it was, in many respects, representative of Sweden as a whole.
Conclusions
Despite the previously mentioned limitations, our study has a number of important findings. First, five similar patterns of direct and indirect aggression and victimization were found for girls and boys, which (with the exception of the average aggression/victimization pattern among girls) were structurally and individually stable over 1 year. Second, a central finding was that a pattern combining high aggression with high victimization was consistently associated with high levels of self-harm, both cross-sectionally and prospectively. This aggressive victims pattern was also a clear risk factor for the development of repetitive self-harm over a 1-year period in both girls (odds ratio 13.58) and boys (odds ratio 5.72). Third, there were some gender differences. Among the girls, the subgroups characterized by high victimization (aggressive victims and nonaggressive victims) had the highest levels of self-harm. However, high aggression in the absence of high victimization was also consistently associated with high levels of self-harm among girls, and having an average aggression/victimization pattern was a risk factor for the development of repetitive self-harm. These findings together indicate that self-harming girls are a heterogeneous group requiring a differentiated treatment approach. In boys, patterns characterized by high aggression (aggressive victims and aggressive nonvictims) seemed to play a relatively more important role, because both were risk factors of repetitive self-harm. Fourth, the high level of repetitive self-harm reported by both genders (especially girls) in the aggressive victim clusters, along with the fact that this pattern is a strong risk factor for the development of repetitive self-harm, is a cause for concern. These findings suggest that repetitive self-harm in combination with extremely high levels of aggression and victimization are warning signs of severe psychopathology and possible psychiatric diagnosis. Thus, these adolescents are likely to require advanced help. This should be communicated to health care professionals who specialize in treating adolescents.