INTRODUCTION
The unsaturated zone (USZ) is the ground section between the surface level and the groundwater table. Rain water percolates downward through it, to recharge the underlying aquifer. As the water descends, the isotopic composition of oxygen in the water may change due to evaporation and the isotopic composition of carbon will change along the path in response to chemical interactions between the soil CO2, the water, the resultant carbonic acid and the solid phase (e.g. Clark and Fritz Reference Clark and Fritz1997).
The study of the USZ has served as the basis of ongoing research (Carmi et al. Reference Carmi, Stiller, Kronfeld, Yechieli, Boaretto, Bar-Matthews and Ayalon2006, Reference Carmi, Kronfeld, Yechieli, Yakir, Stiller and Boaretto2007, Reference Carmi, Kronfeld, Yechieli, Yakir, Boaretto and Stiller2009, Reference Carmi, Yakir, Yechieli, Kronfeld and Stiller2013, 2015) whose goal is to understand the isotopic processes that determine the initial 14C of groundwater. The latter is essential for the age dating of groundwater by the radiocarbon method.
14C is created in the atmosphere. Its activity and that of 13C in modern atmospheric CO2 is being routinely measured and well known (Levin et al. Reference Levin, Kromer and Hammer2013). The radiocarbon activity and the δ13C of the dissolved inorganic carbon (DIC) in groundwater can be accurately measured. However, what is still less well known are the various processes that take place within the USZ under various geological and climatic conditions that determine the carbon isotopic makeup of groundwater bicarbonate. In addition, better understanding of the changes that affect the δ13C of the soil-gas CO2 and the δ18O of the water as it percolates through the USZ can yield important hydrologic understanding of the recharge conditions of the aquifer. These are the main goals of the present research that was carried out within the extensive USZ section overlying the coastal plain aquifer of Israel, south of the city of Ashdod.
SAMPLING AND SITE DESCRIPTION
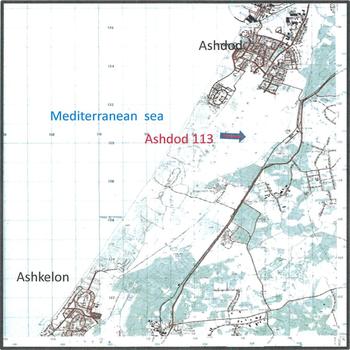
In the beginning of October 2010, the drilling of a well (well #113, at 1301N 1136E local grid), (Figure 1) was carried out in the dunes south of the city of Ashdod. The dunes are essentially unconsolidated beach sands that have been transported northwards from the Nile River by the Mediterranean Long Shore Current and then moved inland by waves and winds. These dunes do not support trees. The plant cover is patchy but there is an abundance of retem (Retama raetam), whose roots can go down in excess of eight meters in search of water. These low lying shrubs provide a fertile environment for an abundance of land snails.
Map of the region, showing the site of Ashdod 113.

The USZ of Well #113 was sampled by spiral drilling to a depth slightly greater than 22 m, from the ground surface until the top of the water table. No drilling fluids were employed. The well was situated not far from a site where the water flow rate through the USZ was previously studied by Rimon et al. (Reference Rimon, Dahan, Nativ and Geyer2007), lying within the same climatic regime and having similar sediment characteristics which will be referred to below, for comparative hydrological purposes. The present well encompasses the entire USZ, extending from the surface to the watertable.
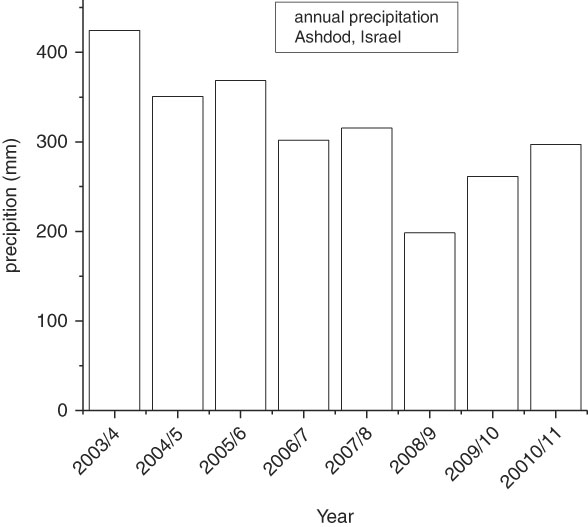
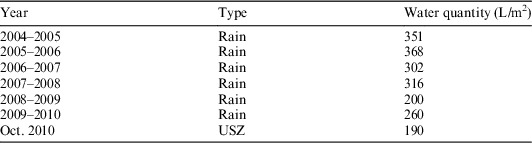
The climate in the region is semi-arid. Rains fall only in the winter months. They fall in a series of storms that generally come from the west, arriving over the Mediterranean Sea. The summer is hot and rainless. Figure 2 and Table 2 show the annual precipitation in Ashdod for the period between 2003–2004 [when the reference site of Rimon et al. (Reference Rimon, Dahan, Nativ and Geyer2007) was studied] and 2010–2011. The present study was initiated in October 2010, at the beginning of the 2010–2011 rainy season. The precipitation in October 2010 was 0.4 mm. The average annual rainfall is denoted by significant variability. The two rainfall seasons that preceded the sampling were below average. The 2008–2009 rainy season was particularly dry. The following rainfall season of 2009–2010 was somewhat wetter.
Annual precipitation in Ashdod, Israel, 2003–2010.

METHODS
The sediment samples of approximately 1 L in volume were collected every 2 m and placed in double plastic bags and sealed in the field. They were then taken to the cool room in the Department of Earth and Planetary Sciences in the Weizmann Institute of Science for processing. The moisture content of the sediment and the CO2 derived from the dissolved inorganic carbon species in the soil water were obtained by vacuum extraction to total dryness. This process quantitatively extracted the soil moisture and ensured that no isotopic fractionation occurs for the carbon and oxygen isotopes (Davidson et al. Reference Davidson, Hardin and Basset1995; Carmi et al. Reference Carmi, Kronfeld, Yechieli, Yakir, Stiller and Boaretto2007). δ18O of the water was measured in a Carlo Erba 1108 elemental analyzer coupled to a continuous flow Micromass isotope ratio spectrometer at the Weizmann Institute (Klein et al. Reference Klein, Hemming, Tongbao, Grϋnzweig, Maseyk, Rotenberg and Yakir2005). The analytical error was ~0.1‰. The δ13C and the Δ14C of the DIC were measured at the NSF-Arizona AMS laboratory with associated analytical errors of ~0.1‰ and ~5‰ respectively. The radiocarbon activities were calibrated against the NIS Oxalic Acid standard, corrected for isotopic fractionation, normalized to δ13C of –25‰. The sedimentology analyses were performed by XRD at the Geological Survey of Israel. The porosity was calculated from the volume of voids in the total volume.
RESULTS AND DISCUSSION
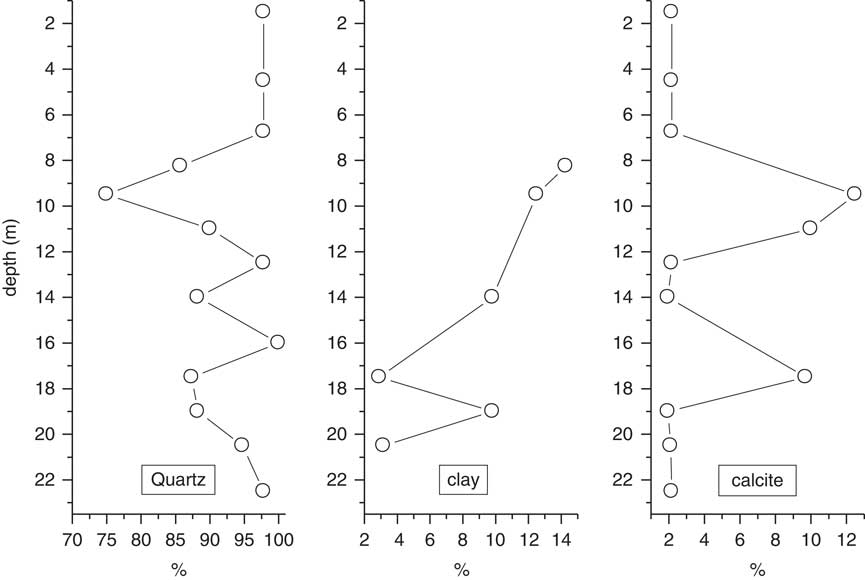
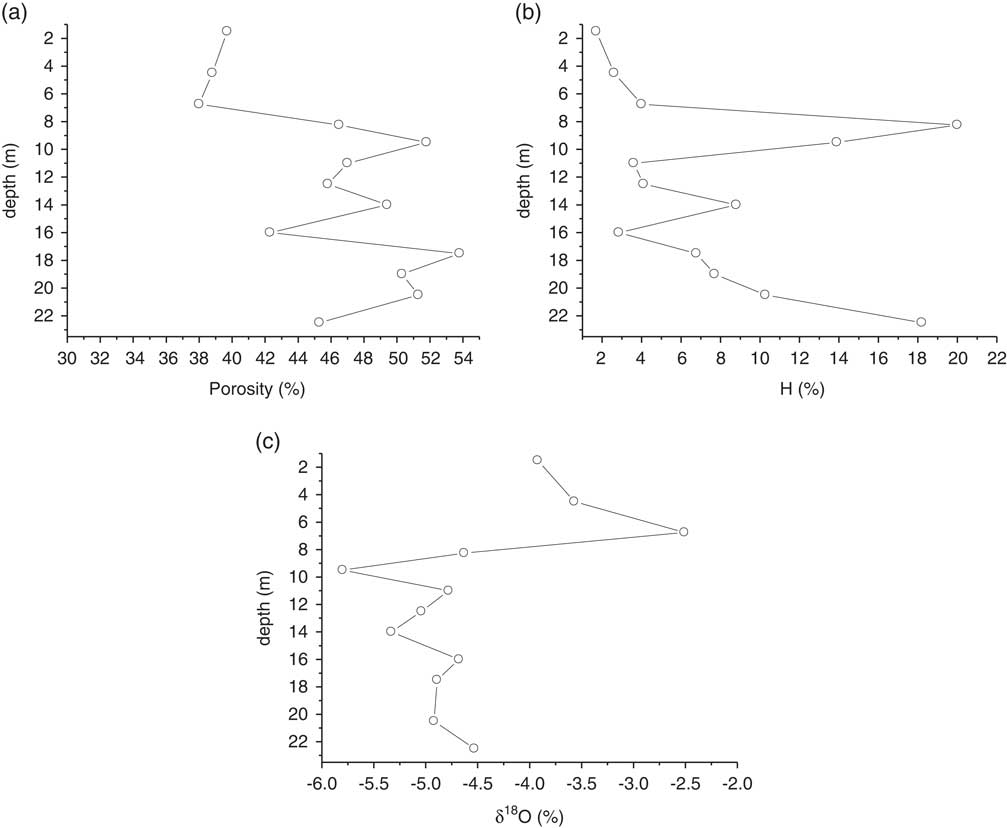
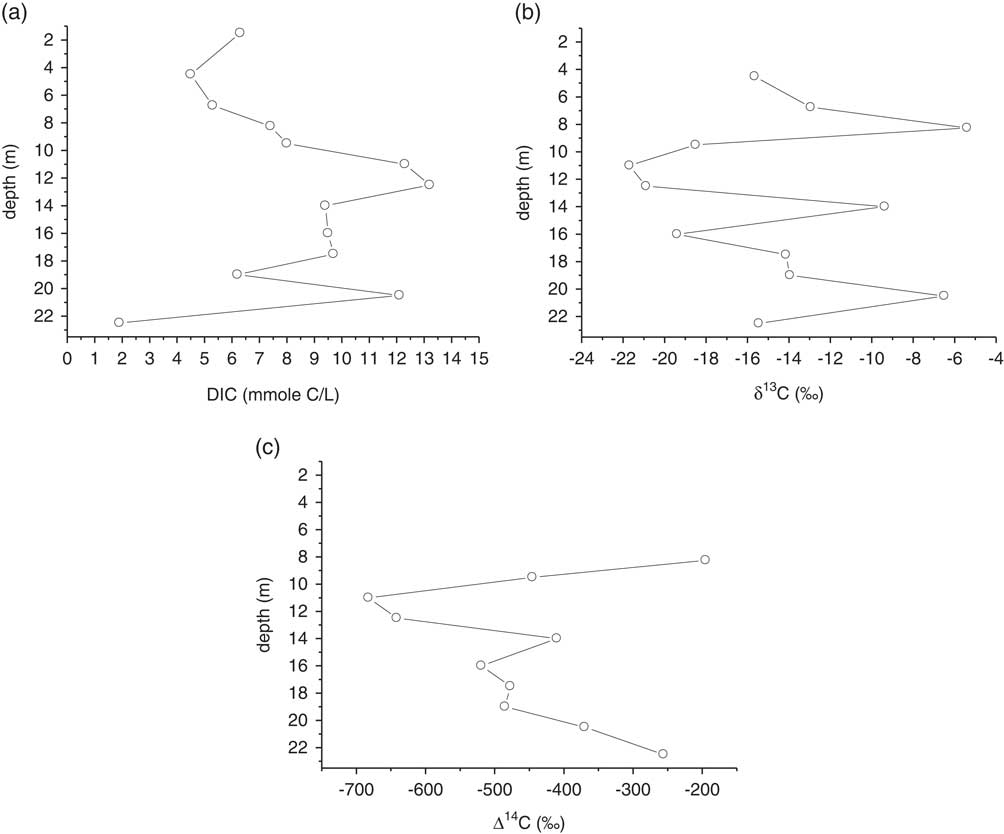
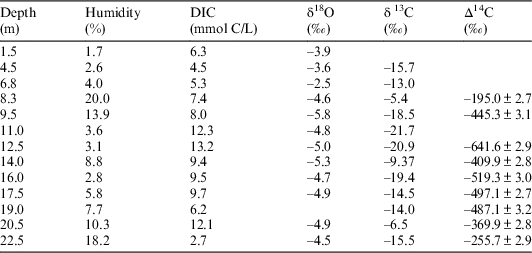
Table 1 and Figures 3–5 show the sedimentology composition, the humidity, δ18O, DIC, δ13CDIC and Δ14CDIC in digital and in graphical format. The mineralogical composition of the sediment column is presented in Figure 3. Quartz, as representative of the sand sized fraction, makes up between 90 and 100% of the sediment. At ~9 m depth a significant decrease in quartz is observed with concomitant higher clay and calcite contributions. The porosity, exceeding 50% (Figure 4a) is high, as would be expected in unconsolidated sand.
Mineralogy in the USZ of Ashdod.

(a) Porosity, (b) humidity (%), and (c) δ18O (‰) in the USZ of Ashdod.

(a) DIC, (b) δ13C (‰), and (c) Δ14C (‰) in the USZ of Ashdod.

Data obtained by measurement in the sediments of Ashdod.

In semi-arid regions the USZ fulfills three roles. First, it is a conduit by which water is added to the aquifer and second, it supplies water to the overlying flora to sustain them during the dry summers, which can last for more than half a year. Last but not least, the USZ insulates the underlying aquifer from the high potential evaporation at the land surface, particularly during the summers. The thickness of the USZ in the coastal plain is in excess of 20 m, which is more extensive than that found in temperate zones. Thus, an expanded zone is presented from which samples can be taken and individual isotopic fractionations can be described, which are not readily apparent in areas where the rainfall is high and uniformly distributed over the year.
Soil-Water
The source of the soil-water is the precipitation over the USZ. The field capacity is the water that is retained in the soil, primarily by capillary action, after the free water has passed through drawn down by gravity (American Heritage Science Dictionary 2002). If the annual precipitation is in excess of the field capacity, then the water content of the USZ will be replaced completely in that season. If the annual precipitation is less than the field capacity, then the water content of the USZ will be only partly replaced
The annual rainfall between 2003 and 2010 is shown in Figure 2 and Table 2. The sampling of the sediment in Ashdod was done following one year of severe (2008–2009) and one of medium (2009–2010) drought. The drilling and collection of sediments from the USZ were carried out in October 2010. The water content of the sediment samples is shown in Table 2, so that the soil water had remained in the USZ throughout the rainless summer.
Comparison between annual rains and the water in the USZ in the time of drilling.

The water content of the USZ (Table 2) is somewhat less than the field capacity because, as is clearly seen, there was loss of water from the top of the USZ by evaporation during the summer. The soil water varies with depth in the USZ. The highest amount is at 8 m depth, with a secondary high at the base of the USZ just above the water table at 20.3 m (Figure 4b). It is assumed that this secondary high is the primary high of the previous year (2008–2009), which had replaced the field capacity by the rains of 2009–2010. It is possible to estimate the downward movement of water (Table 3). The water recharge peak moved down 12.7 m over the two seasons. In 2004, the study of the recharge through the USZ was carried out during an average rainfall season (Figure 2). Under these conditions of relatively high rainfall it was found that that the entire amount of precipitation transferred through the USZ (~20 m) to recharge the aquifer (Rimon et al. 2007) in a single season. This apparently does not occur in subpar rainfall seasons.
Estimate of the down flow of rain water in the USZ of Ashdod in winter 2009–2010. The average is 12.8±0.8 m.

δ18O
Rainfall that falls upon the ground enters the USZ and percolates downward. The oxygen isotopic composition of rainfall over the coastal plain aquifer was investigated by Gat and Dansgaard (Reference Gat and Dangaard1972). The local δ18O of the precipitation is expected to be ~5‰ depleted compared to standard mean oceanic values (0‰ SMOW). A sampling site at Ashdod for the month of January 1968, yielded a weighted mean of δ18O=–4.65±1.44‰ (SMOW) and a longer term survey on rain, carried out along the coast but northwards at Bet Dagan, over a six year period, yielded a δ18O=–5.29±0.45‰ (SMOW). The variation that is seen within the various levels of the USZ is much greater than this (Table 1 and Figure 4c). The most enriched δ18O values are found in the top 6 m of the USZ. This represents the last rains of the season that entered the USZ and retained in the field capacity for subsequent rainless 8 months. During the hot summer the remaining soil water at the top of the USZ experienced evaporation. The remaining soil water is enriched in 18O.
Despite the large δ18O variability seen throughout the USZ, when the δ18O values are weighted with the soil-water (humidity in Table1) at each level, it is found that an average value of δ18O=–4.8‰ is obtained. This value is very similar to the groundwater in the southern coastal aquifer which ranges between –5‰ and –4.2‰ (Gat and Dansgaard 1972).
DIC
At the top of the USZ the gas fraction contains air with atmospheric CO2 (400 ppm), which is the local source of DIC. Deeper in the USZ, this CO2 is overwhelmed by major lateral input through exhalation from roots that suck water at the site of the high humidity at ~8 m (>10,000 ppm). No gradient with depth in the DIC is observed in the USZ of Ashdod (Figure 5a and Table 1). This is a sign that no carbonate precipitated from the DIC unto the solid part of the USZ (Carmi et al. Reference Carmi, Kronfeld, Yechieli, Yakir, Boaretto and Stiller2009). The secondary DIC maximum at 20.5 m suggests that the present DIC maximum at ~12 m had moved down the USZ. However, this secondary maximum is not as clearly defined as the 12 m distribution because deeper down the section and probably had partly dispersed into the underlying aquifer. To estimate the downward flow of water, the DIC at 6.7 m and 19 m (7.6 mmole L–1) were used to calculate a value of 12.3 m downward flow in the USZ
δ13C
Most of the carbon isotopes have not been introduced into the USZ along with the recharge that percolates downward from the ground surface, and thus their profiles are different from the δ18O and their isotopic evolution is more complex. The major carbon input to the USZ is laterally, with CO2 from the roots that descended into the USZ in search of water. The floral communities overlying the coastal plain aquifer are exclusively of the C3 type plants (Vogel et al. Reference Vogel, Fuls and Danin1986). CO2 gas arising from this should have a δ13C value of approximately –23‰ (VPDB) before the gas dissolves. As the CO2aqueous (–21‰, Table 1) forms the HCO3 – a large fractionation of 9‰ enriches the δ13C to approximately –15.1‰. The partial pressure of the soil gas can be orders of magnitude higher that of the atmosphere and the δ13C (–21‰, Table 1) of the CO2 aqueous is much more depleted compared to the δ13C of atmospheric CO2 (~–9‰). The downward flow of water, estimated between 8.3 m (–5.4‰) and 20.5 m (–6.4‰) was 12.2 m. The upper enriched δ13C value is assumed to have originated by mixing of aeolian dust (δ13C=0‰) (Ganor Reference Ganor1975; Dan Reference Dan1991), with the soil water (δ13CDIC –=13‰).The weighted average of all the δ13CDIC values in the section is –14.9‰, as expected (Clark and Fritz Reference Clark and Fritz1997).
Δ14C
At the time of sampling the sediments (early October 2010), the highest 14C activities are observed near 8 m depth and just above the water table at ~20 m. The 8 m depth is apparently the site of maximum root exhalation; for, it is the zone of the highest soil-water (Table 1 and Figure 4c). In 2009 the average Δ14C in the atmosphere was +40.9‰ (Levin et al. Reference Levin, Kromer and Hammer2013) and following the fractionation of δ13C×2 the Δ14C in the bicarbonate is ~+28.9‰. This is assumed to be the Δ14C at the maximum of the missing part of its distribution. At 8.4 m depth Δ14C=–259‰ and at 22.5 it was –256‰ therefore the estimate for down flow of water is 14.1 m. The weighted average for Δ14C is –477‰. Carmi et al. (Reference Carmi, Kronfeld, Yechieli, Yakir, Boaretto and Stiller2009) estimated the initial 14C in the coastal aquifer to be 0.54 of the extant value in the atmosphere. Using the atmospheric data for 2009 the result is –434‰, which is in agreement to within 4% to the first estimate.
Dynamics of Water in the USZ of Ashdod
Table 3 provides the information necessary to make an estimate of the rate at which the rain was transmitted through the USZ. The rains of 2009–2010 pushed the field capacity water from the 2008–2009 rains down and replaced it with new water. The 2009–2010 water stayed almost 8 months in the field capacity. The fast displacement of the water from the field capacity in 2008–2009 dispersed the four measured parameters (Table 3) and caused some blurring of the peak’s position. Some of the 2008–2009 rain remained in the USZ, as described above, and made possible an estimate of the downward flow of water in the USZ. The average rate for the four measured parameters (Table 3) is 12.8±0.8 m during the winter of 2009–2010. The isotopic analyses show that during a drought year the percolation downwards of rain recharging the aquifer is incomplete. This contrasts with the wet years 2003–2004 when the recharge is fast and efficient.
CONCLUSIONS
∙ In a semi-arid region the relatively expanded USZ section preserves important hydrologic information.
∙ The soil-water was ~ the field capacity in drought years.
∙ The preserved record of the isotopic fractionation processes preserved with the DIC and trapped in the field capacity of the USZ readily track the recharge as it percolates downward.
∙ The calculated weighted averages of the proxies in the samples of the USZ are the same as those of the groundwater of the aquifer.
∙ Within the soil profile important hydrologic information, such as the extent of evaporation of the recharge, as well as the rate of recharge transmission to the aquifer can be determined.
∙ Not only can snapshots of the isotopic processes be seen at various horizons, but their interpretation yields hydrologic information that can be used to assist in optimizing the exploitation of the aquifer’s water resources.