Introduction
Farmers have long been aware of variations in soil and yield within and between fields, and while their own experience and knowledge, often in consultation with agronomists, do allow them to manage these variations, they have lacked the tools to measure, map and manage them in a precise way. Adoption of new technologies like high precision positioning systems, state-of-the-art sensors and a range of IT applications, combined with high-tech engineering, have led to the farming concept of precision agriculture.
Precision agriculture relies on the development of decision-support models that allow farmers to adapt their management practices. It is essential that the information used to build these models is accurate and easy to collect. As opposed to conventional wet chemistry analyses, which can be expensive and time consuming, remote sensing is one of the most commonly used ways to collect such information in a quick and cost-effective manner. Using sensor systems mounted on aerial or satellite platforms, it is possible to remotely detect the radiation that is absorbed, transmitted and reflected when sunlight interacts with materials on the earth’s surface. Since these materials (such as soil and plants) absorb or reflect different wavelengths of light in quantities that are proportional to their physical and chemical properties, it is possible to use this information to evaluate a range of indices of soil and crop condition (e.g. texture, nutrients, moisture, crop yield, diseases). This principle is not exclusive to remote sensing; light absorption can be physically measured also in the field, using handheld portable sensors or sensors mounted on moving vehicles, as well as in a laboratory, using benchtop instruments. It is worth noting, however, that accuracy and specificity of the measurements is almost inversely proportional between these different approaches, with remote sensing offering a greater spatial scale and faster turnaround that is traded for greater accuracy of field and laboratory based measurements. In fact, many proximal and remote sensors start in the laboratory and most are calibrated using laboratory measurements, which are free from environmental confounding factors and therefore guarantee greater accuracy.
The ability of a sensor to detect and resolve energy emitted or reflected within certain parts of the electromagnetic spectrum is one of the key factors determining which sensor best suits the agricultural target under study. Remote and proximal sensing devices can be designed to capture electromagnetic energy at various wavelengths along the spectrum and in different ways. For instance, hyperspectral sensors typically capture reflected light in the range of 400-2500 nm (Visible-NIR) along hundreds of narrow (<20 nm) spectral bands. Alternatively, multispectral sensors acquire data over a smaller number of broader spectral bands (~100 nm bandwidth). The visible to near infrared range is where most agricultural remote sensing is performed. This range allows us to explain some physical and chemical properties of natural materials such as plants and soil, but other ranges like Mid IR and X-Ray provide an insight on the molecular and elemental composition of different materials.
Overall, to achieve meaningful and accurate measurements it is essential to have a clear understanding of what we need to measure and what sensor will provide the most appropriate information within the applicable timeframe. Here we provide an overview of the usefulness of different sensors and provide practical examples of applications being developed at the James Hutton Institute.
Soil sensing
Soil is a highly variable matrix containing organic matter and minerals, as well as liquid and gaseous components. Monitoring soil health is possibly the main topic concerning precision agriculture because of its direct relation with crop yield, and its role in energy production and water and carbon storage. At the James Hutton Institute we have been working with a range of sensing tools with different capabilities to monitor this variability and develop methods to address different management issues. The fact that The James Hutton Institute holds the National Soils Inventory of Scotland (NSIS), a large spatial dataset with soil samples collected from across Scotland, with fully characterised soils stored dried and milled and available for analysis using different sensing technologies is a major benefit in this work.
Visible range sensors for carbon assessment in soil
Sensors in the visible range measure light that is reflected off objects or materials, with blue, green, and red being the primary colours or wavelengths of the visible spectrum (390-700 nm). Colour is a complex result of surface, transmission and emission properties of objects and can, in turn, be correlated to some physical or chemical properties of materials.
In the case of soil, colour is a commonly used indicator for preliminary assessment of organic matter content or presence of iron compounds. For instance, peaty soils with a higher organic carbon content are darker than those with less organic carbon content, such as sandy or calcareous soils, whereas iron-rich soils tend to have reddish brown colour. Iron (specifically iron oxide) has been known to influence soil colour for many years (Barron & Torrent, Reference Barron and Torrent1986). The relationship is not always clear-cut, as interactions between organic matter, aluminium, clay and iron can distort the impact of iron on soil colour (Galvão & Vitorello, Reference Galvão and Vitorello1998). Though colour is useful to visually assess some soil properties, the ability to quantify these properties would be advantageous, especially for carbon content which is one of the main determinants of farm management practices given the key role of carbon in soil fertility, crop yield and the role of soil as carbon storage for climate change mitigation.
Strong links exist between organic matter content and soil colour (Aitkenhead et al., Reference Aitkenhead, Coull, Towers, Hudson and Black2012; Aitkenhead et al., Reference Aitkenhead, Donnelly, Sutherland, Miller, Coull and Black2015) and this has been used to develop an app (SOCIT) at the James Hutton Institute that links topsoil colour and location-specific factors to estimate organic matter content (Aitkenhead et al., Reference Aitkenhead, Coull, Towers, Hudson and Black2013). Further work in this area is focussing on using greater spectral resolution (e.g. hyperspectral) to improve topsoil organic matter estimation accuracy in the field. We are also exploring the potential of hyperspectral visible range data to give us information about crop composition (specifically nitrogen) in the field.
The visible range can be very useful and cost-effective for providing low cost assessment of soil carbon or soil type discrimination, but this spectral range is limited to measuring colour-related properties of soil. There is a further limitation in that colour can have different underlying causes in different situations (for example the effects of soil moisture on colour, or ‘background’ soil colour due to the presence of certain minerals). Therefore, if more specific information is needed, sensors in other ranges of the spectrum can provide a more comprehensive overview of the chemical and other physical properties of soil.
Infrared sensors for characterization and estimation of soil chemical and physical properties
Infrared (IR) sensors move beyond what is possible to determine by colour alone, allowing identification of the chemical composition of matter. This is possible because the infrared light is absorbed and/or reflected from a substance in proportion to the type of molecules that it contains and therefore sensors in the IR ranges are able to provide information on the chemical composition, both organic and inorganic, of the substance analysed.
When IR radiation interacts with a sample, the bonds that form the molecules vibrate (e.g. stretching, bending) and subsequently absorb energy at the particular frequency that matches the vibrational frequency of the functional group of such molecule. The intensity of the absorbance varies according to the molecule and its concentration in the sampled substrate, thus resulting in absorption peaks that can be visually observed when plotted as a function of wavelength or frequency. These are called fundamental vibrations and occur in the mid-infrared region (MIR, 2500-25 000 nm). The adjacent part of the spectrum is the near infrared region (NIR, 750-2500 nm) and consists of overtones and combinations of these fundamental vibrations. The NIR spectra are characterized by broad and overlapping peaks and, compared to the fundamental bands, the intensity of the overtone bands is very low. Radiation in the long-infrared range of the electromagnetic spectrum (approximately 9 000–14 000 nm) can also be sensed by thermographic cameras to produce images of that radiation, called thermograms.
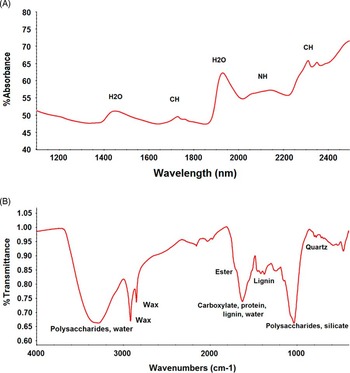
Figure 1 illustrates how the NIR and MIR spectra of the same sample, though interrelated, look very different. In both cases, these traces contain information that makes possible the identification of the chemical composition of a sample since absorption bands for particular bonds and functional groups occur always in the same frequencies.
For a given sample, NIR (A) and MIR (B) spectral bands display interrelated but different type of information.

NIR spectral data, though it can be qualitatively interpreted to a degree, has traditionally relied on multivariate analyses (i.e. chemometrics) for the extraction of information and removal of noise due to physical factors, as well as for development of multivariate calibration models that correlate optical measurements with chemical and physical attributes of the target substrate, for predictive purposes (WoldReference Wold, 1995). For this reason, NIR spectroscopy is mostly used as a quantitative technique to provide rapid and simultaneous estimates of physical and chemical properties of natural materials like soil. For instance, using laboratory based NIR analysis of archived soils from the NSIS dataset it was possible to develop predictive calibrations to estimate a wide range of soil parameters such as pH, bulk density, moisture, clay content, and nutrients (e.g. N, Mg, K, etc) (Pérez-Fernández and Robertson Reference Pérez-Fernández and Robertson2016) most of which describe soil condition and therefore are crucial to inform agricultural management decisions. Though this application was developed at a national scale, it involves a wide range of parameters that concern farming worldwide. Similar examples exist, at farm, regional and continental scale (Nocita et al., Reference Nocita, Stevens, Wesemael, van, Aitkenhead, Bachmann and Barthes2015).
Complexity and sensitivity of the mid-IR signal make this technique less practical for remote sensing, but sensors that are able to detect in this range are highly useful as part of proximal sensing portable devices or laboratory instruments, offering rapid visualization of the chemical composition of soil (Figure 1). The mid-IR spectrum provides an overall chemical profile of the sampled material and, with the appropriate experience, it is readily interpretable to obtain qualitative identification of the chemical components in the sample.
For instance, for the same set of archived soil samples mentioned above (NSIS), high-quality MIR spectra have been obtained allowing the characterization of organic (polysaccharides, waxes, proteins, lignin, etc.) and inorganic (clays, carbonates, sulphates, etc.) components of different types of soil, properties that are crucial to understand soil condition and behaviour and determine management decisions. In addition to this, spectral information in the MIR range provides more complete geological information and has the potential to identify contaminant compounds. Mid-IR spectral data can also be used predictively, but calibration models are much less well developed compared to NIR. Nonetheless, using spectral libraries derived from the NSIS set, we are working to develop models to predict a number of soil parameters including carbon and bulk density.
Our IR research is currently moving towards the estimation of soil functions (e.g. water aggregate stability, carbon storage), as a complement to soil chemistry, to further help informing management decisions from a different approach. The ability to make these methods available for field-based analysis and feed results directly back via cloud processing would be advantageous, making these even more powerful management tools.
X-ray sensors to measure elemental composition of soil
Shorter wavelength radiation in the form of X-rays (0.1-10 nm) induces fluorescence in the substrate based on excitation with a beam of X-rays, resulting in the emission of secondary X-rays with energies that are characteristic of the elements in the sample. The XRF sensors provide elemental atomic information that is highly applicable to the study of soils, sediments and fluids. Some of the main elements measured in soil using this technology include the structural elements of minerals (e.g. Al, Si, Ca, Mg, K) and minor or trace elements (e.g. Fe, Cu and Zn) which are essential for plant growth.
We are also developing the use of total reflection XRF (TXRF), which has much improved sensitivity and can be used for extreme micro and trace analysis (Klockenkamper and von Bohlen Reference Klockenkamper and von Bohlen2015). Although the new instruments are relatively small and portable they are not ready for use directly in the field.
Crop applications
Visible and Vis-NIR range for phenotyping and stress detection
Healthy vegetation contains large quantities of chlorophyll, the substance that gives most plants a distinctive green colour. Measurements in the green reflectance peak of vegetation, for instance, allow vegetation discrimination from canopy measurements (i.e. using sensors mounted on aerial devices) or forest type mapping. Stressed or damaged crops, on the contrary, experience a decrease in chlorophyll content that, in turn, is translated as a decrease in reflectance in the green and near infrared regions. Furthermore, it is well known that unexpected changes in the colouring of leaves are generally due to nutrient deficiencies and stress factors. This principle can be used to develop tools for early detection of crop stress.
Development of a prototype visible-range device that is cheap, lightweight and field-capable is currently ongoing at the James Hutton Institute. This device, called PHYLIS (Portable Low-cost Hyperspectral Imaging System) has been tested in the laboratory using NSIS samples and has been found capable of providing estimates of soil organic matter, pH and a number of other variables. Currently we are testing this device in the field, at a number of Institute research stations, on soils and crops.
Infrared sensors for characterization of chemical composition and disease detection in crops
Extending spectral resolution to sense in the infrared (Vis-NIR, NIR and MIR) is advantageous in that it makes possible to see beyond the visible wavelengths into the infrared where wavelengths are highly sensitive to crop health, stress and damage. These factors induce chemical and structural changes in leaves leading to variable levels of absorption of infrared light, which can be detected by sensors. The NIR range provides an additional chemical dimension to these measurements.
Estimations of the chemical composition of plant leaves, at different stages, can provide an indication of factors involved in plant development and effects of disease or stress alterations, thus making possible to link leaf chemistry with crop quality, condition and resilience.
Though changes in leaf chemistry are more complicated to visualize in NIR spectra, correlations can be developed to get quantitative estimations or discriminations based on NIR spectral data and traditional laboratory measurements. Development of a field based platform that exploits hyperspectral (visible and near-infrared) imaging and infra-red thermographic imaging to measure plant responses to biotic and abiotic stress is on-going at the Institute.
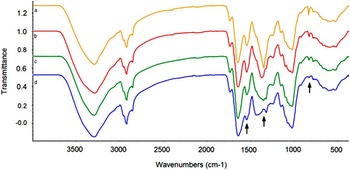
Mid-IR, as described above, provides more in-depth chemical information. We are currently looking at means of developing a tool for gauging disease resistance and early detection of plant diseases. For instance, waxes on the leaf surface of plants are the first barrier that potential pathogens, like aphids, have to face when in contact with the plant (Tsumuki et al. Reference Tsumuki, Kanehisa and Kawada1989). Investigation to identify differences in wax type and content between plants that have expressed resistance or susceptibility to pathogen infection, as well as characterizing the chemical response in both resistant and susceptible plants, could be a very powerful phenotyping tool for the selection of resistant breeds. Although phenotyping of plants is not in itself precision agriculture, the same principle can be used to develop management tools. Similarly, research on patterns of change in chemical composition of plant leaves, at different stages of maturity, is ongoing with the aim to find a link between this information and traits such as development of disease resistance, which again could be used to develop management tools. Mid-IR also allows for investigation of nutrient allocation within the plant tissues. For instance, conspicuous differences in nutrient distribution via presence of nitrates in the leaves can readily be observed in plant material (Figure 2).
Laboratory-based FTIR spectra of leaves of a species of potato (freeze dried) at different stages of maturity giving an overview of changes in leaf chemical composition

Although these applications are mainly lab-based, field-based applications are also being developed based on similar principles, where hand-held MIR spectra is being collected in the field from diseased potato plants and stressed blueberry plants in order to identify spectral markers of disease and stress that could be established for rapid detection of emerging diseases.
XRF analysis of crops
There are XRF systems which can measure elemental compositions directly of plant material (Bueno Guerra Reference Bueno Guerra, de Almeida, Carvalho, Souza, Nunes and Krug2014) and allow studies of things such as nutrient uptake (Reidinger et al. Reference Reidinger, Ramsey and Harltey2012) and contamination by heavy metals. This may be useful to assess pollution of crops where there may be metals carried from industrial areas or where there is a previous history of the use of pesticides which may contain potentially dangerous elements such as As and Pb.
Discussion
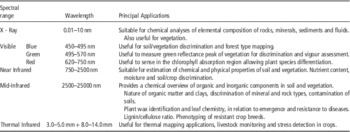
The aim of this paper was to provide a synthesis of the range of available technologies and their capabilities, from a theoretical and practical approach, to help inform management choices (see Table 1 above for further summary).
Summary table describing the principal applications for each of the spectral ranges that have been described in this paper, most of which are commonly applied in precision agriculture research.

In the paper we have tried to illustrate the many different ways in which sensors in the different regions of the electromagnetic spectrum can be used for precision agriculture applications. Many of them are complementary and could be applied in combination to the same problem. For example handheld vs. airborne sensors will allow different types of assessment and provide different types of information. Imaging can be done by colour, size etc. for canopy measurements but handheld measurements can deal with ground and underground measurements. Remote sensing imagery gives the required spatial overview of the land; however, it is worth noting that it can only work on bare earth and sensors used in the field will provide far more detailed information. At the James Hutton Institute we are working to move from laboratory based analysis towards developing methodologies for field-based soil analysis using these techniques (Robertson et al. Reference Robertson, Shand and Pérez-Fernández2016) giving the potential to not only map differences but also identify what those differences relate to. Many promising methodologies for both soil and crop analysis are under development but much remains to be done in relation to issues such as surface roughness, moisture and the heterogeneity of plants and soils at different scales.
Conclusion
Choosing an appropriate sensor is crucial to support management decision-making. The collection of useful data should be related to management needs and resources available.