INTRODUCTION
The genus Cryptosporidium includes several species of intestinal protozoan parasites causing severe intestinal infections and diarrhoea, particularly in children in underdeveloped regions of the world, and in immune-deficient individuals. The life-cycle of this parasite consists of an intracellular, asexual phase of multiplication followed by the differentiation of gametes, fertilization, meiosis and the release of infectious oocysts in the gut lumen. These oocysts are shed in the feces and perpetuate the infection when transmitted through water, food or direct contact. Since the first description of C. parvum development in vitro (Current and Haynes, 1984), over 60 articles have described various aspects of Cryptosporidium in vitro cultivation (reviewed by Upton, 1997), but progress towards a self-sustaining culture method has been limited. Parasite development in cell monolayers is restricted in time, and gamete differentiation or oocyst formation takes place only to a very limited extent. The fact that these parasites cannot be maintained in culture severely limits research, and precludes access to late intracellular developmental stages.
More then 10 years ago, Upton and co-workers compared parasite development in several cell lines and concluded that in the human ileocecal adenocarcinoma line HCT-8 C. parvum grew at a higher density (Upton et al. 1994). Many investigators have since adopted this cell line for culture of C. parvum. Hijjawi and co-workers described modifications to the HCT-8 culture which resulted in the production of infectious oocysts (Hijjawi et al. 2001), but efforts to reproduce these results in our laboratory were not successful.
The observation that in Cryptosporidium-infected monolayers a majority of cells remain uninfected, even when high oocyst-to-host cell ratios are used, has not been investigated, but may be important for understanding factors limiting parasite development in vitro. Even in the presence of numerous uninfected cells, the infection peaks at 2–3 days post-infection (Yang et al. 1996; Widmer et al. 2000; Mele et al. 2004). The decline may coincide with the onset of sexual differentiation (Current and Haynes, 1984; Rosales et al. 1993; Villacorta et al. 1996; Hijjawi et al. 2001), and it has been speculated that this process is not supported in culture.
Because HCT-8 and other epithelial cells are anchorage-dependent, injuries which cause cells to detach trigger apoptosis. It has been known for some time that infection with C. parvum is associated with the release of cells into the supernatant (Griffiths et al. 1994). Released cells display morphological and molecular markers of apoptosis (Widmer et al. 2000). Several investigators have also observed apoptosis within C. parvum-infected monolayers (Chen et al. 1998; Ojcius et al. 1999; McCole et al. 2000; Widmer et al. 2000; Buret et al. 2003; Mele et al. 2004). To what extend these observations are relevant to clinical infections is unclear, as apoptosis was not detected in a chronically infected mouse model (Stephens et al. 1999) but was sporadically induced in an acute neonatal model (Sasahara et al. 2003).
Sequencing and annotation of the C. parvum and C. hominis genomes has indicated that these parasites are unable to synthesize essential metabolites such as amino acids, purines and pyrimidines, and instead import many metabolites from the host cell using membrane transporters (Abrahamsen et al. 2004; Striepen et al. 2004; Xu et al. 2004). We investigated whether the parasite's metabolic dependence limits its ability to multiply in non-dividing cells and favours parasite development in cells undergoing mitosis. Consistent with this hypothesis, we show that C. parvum is more frequently found in cells in S/G2/M phase than expected based on the prevalence of dividing cells in a monolayer. Moreover, as expected from previous observations of cell release from infected monolayers (Griffiths et al. 1994), the prevalence of S/G2/M cells is higher in infected than control monolayers. Although the preference of the parasite for dividing cells is not absolute, these results indicate new avenues for understanding host-parasite interaction in vitro.
MATERIALS AND METHODS
Parasites
Unless otherwise indicated, monolayers were infected with oocysts of isolate IOWA (Abrahamsen et al. 2004) purchased from Bunch Grass Farm, Deary, Indiana. Oocysts were between 9 and 19 weeks old at the time of infection. Prior to inoculation into culture, oocysts were surface sterilized in 10% bleach (0·5% sodium hypochlorite) for 7 min on ice. Bleached oocysts were resuspended in cell culture medium and added to monolayers. Oocysts heat-inactivated at 70 °C for 15 min were used to mock-infect control monolayers. This control was preferred over a conventional uninfected monolayer, as the presence of an equal number of inactivated oocysts enables a more precise quantification of the immunofluorescent background (see below, Immunofluorescent labelling). Growth rate experiments were performed with 2 laboratory lines of C. parvum obtained by crossing C. parvum isolate MD (Okhuysen et al. 2002) with TU114 (Tanriverdi and Widmer, 2006) as described (Feng et al. 2002).
Cell monolayers
Experiments were conducted with the human ileocecal adenocarcinoma HCT-8 cell line (American Type Culture Collection (ATCC) #CCL-244) or Madin-Darby Bovine Kidney cells (MDBK, ATCC #CCL-22). Monolayers were grown to about 90–100% confluence in RPMI 1640 medium supplemented with 10% heat-inactivated horse serum, 1% penicillin/streptomycin and 1 mM sodium pyruvate. MDBK monolayers were grown in DMEM medium containing 5% fetal bovine serum, 1% penicillin/streptomycin, 1 mM sodium pyruvate and 2 mM L-glutamine. Typically, cells were grown in 25 cm2 flasks but, depending on the application, other formats, such as 96-well plates, were used.
Immunofluorescent labelling and flow cytometry
All experiments included a mock-infected control monolayer to which the same number of heat-inactivated oocysts was added. Initial experiments also included an uninfected monolayer. Twenty-four or 48-h post-infection monolayer cells were harvested by removing the culture medium and adding 200 μl of Accutase (Innovative Cell Technologies, San Diego, California), per cm2 of monolayer. Monolayers were incubated in Accutase for 5–10 min at 37 °C or until a majority of cells had detached. At that time the cell suspension was diluted with a 1·5-fold excess of culture medium and the cells dispersed by pipetting up and down. Cells were pelleted from the suspension by centrifugation at 400 g for 5 min and washed twice in sterile phosphate-buffered saline (pH 7·4). Cells were then fixed in methanol at room temperature for 10 min, pelleted by centrifugation and suspended in a 1[ratio ]100 dilution of normal goat serum (NGS) in PBS. Following a 30-min incubation period at room temperature, cells were pelleted by centrifugation and suspended in 1 ml of a 1[ratio ]1000 dilution of anti-Cryptosporidium rabbit antiserum in PBS/NGS (Theodos et al. 1998). Following a 1h incubation at room temperature, cells were pelleted by centrifugation, washed once in PBS and suspended in 1 ml of anti-rabbit IgG-Alexa 488 conjugate (Molecular Probes, Eugene, Oregon), 50 μg/ml propidium iodide (PI) and 150 μg/ml RNAse A in PBS, and incubated at room temperature for 30 h. Prior to adding to the cell suspension, the PI and IgG conjugate solution were spun at 12000 g to remove any particulates. Labelled cells were then inspected under an epifluorescence microscope to ascertain homogeneous labelling.
Cells were analysed with an Epics XL flow cytometer (Beckman Coulter, Fullerton, California) using an argon laser powered at 15 mW. Alexa 488 and PI fluorescence was detected in the FL1 and FL3 signals, respectively. Cell doublets and larger aggregates were visualized on a FL3 peak vs FL3 area bivariant plot and excluded by gating on single-cell events located on the y=x diagonal (Wersto et al. 2001). In addition to the FL1 and FL3 signals, a forward vs. side-scatter plot was also acquired. Cell populations were displayed on histograms and scatter plots, and quantitated using the Expo 32 ADC version 1.1C (Beckman Coulter) software.
Analysis of flow cytometric data
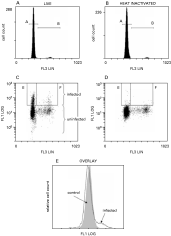
The proportion of C. parvum-infected monolayer cells was determined by comparing FL1 histograms and FL3/FL1 plots of the infected and corresponding mock-infected control monolayer, as shown in Fig. 2. The proportion of cells in G1/G0 and S/G2/M was estimated from FL3 fluorescence histograms as illustrated in Fig. 2 (histogram regions A and B). To calculate the proportion of infected cells, the number of infected cells was divided by the total number of cells×100 (regions E+F/total cells×100 in Fig. 2). The percentage of infected cells in S/G2/M was obtained by dividing the number of infected S/G2/M cells by the total number of cells in S/G2/M×100 ((region F/region E+F)×100 in Fig. 2).

Fig. 2. HCT-8 cells from monolayers infected with live and mock-infected with heat-inactivated oocysts analysed by flow cytometry. Top (A, B) Histograms of PI fluorescence. Region A, G1/G0 cells; region B, S/G2/M cells. Middle (C, D) corresponding bivariant plots of live and mock-infected monolayers; parasite fluorescence (FL1 LOG) vs DNA fluorescence (FL3 LIN) acquired from the same samples as shown in A and B, respectively. In the Y dimension, regions E, F delineate events with FL1 fluorescence exceeding background. In the X dimension, region E is aligned with region A above, and region F with region B. The proportion of S/G2/M as percentage of infected cells (see Table 1) is defined as F/(E+F)×100. Bottom (E) Overlay of FL1 fluorescence acquired from the infected and mock-infected sample.
RESULTS
Flow cytometric analysis
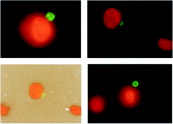
To assess the proportion of infected cells in a monolayer, parallel monolayers were infected with oocysts at a 1[ratio ]1 host cell-to-oocyst ratio, or mock infected with the same number of heat-inactivated oocysts. Since each oocyst contains 4 sporozoites, this dose theoretically corresponds to a 4-fold excess of parasites over cells. Because the proportion of oocysts which do not release sporozoites was unknown, the exact cell-to-sporozoite ratio could not be determined. Double-labelled cell suspensions (PI/Alexa 488) were first inspected by fluorescence microscopy to ascertain uniform labelling and absence of non-specific fluorescence (Fig. 1). Samples were also microscopically inspected for the presence of intact oocysts and oocyst shells which can interfere with the flow cytometric analysis. The occasional presence of cell-adherent unexcysted oocysts and empty oocyst walls justified the inclusion of a monolayer infected with a same number of inactivated oocysts as a negative control.

Fig. 1. Microscopical analysis of HCT-8 cells from a Cryptosporidium parvum-infected monolayer. Cells were detached from the substrate, fixed, the parasites immunolabelled using an Alexa 488 (green) conjugated secondary antibody as described in the Materials and Methods section. Nuclei were stained with PI (orange), and the cells viewed under an epifluorescent microscope. Top left, infected cell. Top right, infected and uninfected cell. Bottom left, infected and uninfected cells viewed with visible and UV illumination to illustrate the location of the intracellular parasite with respect to the cellular membrane. Bottom right, uninfected cell with an attached oocyst. Oocyst diameter: 5 μm.
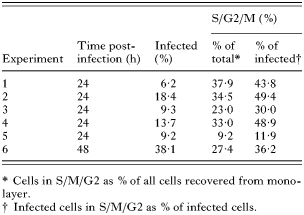
Samples were analysed by flow cytometry and the events displayed on a FL1 vs FL3 bivariant plot (Fig. 2). To delineate the population of infected cells, each infected monolayer was compared with its mock-infected control (Fig. 2 plots C, D). The visual comparison of the FL1 signal in the corresponding infected and control plots and in an FL1 overlay (panel E) were used together with the FL3 signal (PI fluorescence) to identify infected G1/G0 cells (region E in plots C, D) and infected S/M/G2 cells (region F in plots C, D). By 24 h post-infection, the average proportion of infected cells was 11·4% (n=5; S.D.=4·2) (Table 1). By 48 h post-infection 38·1% of the cells were infected in one experiment. The correlation between oocyst age and prevalence of infected cells was not significant. Some of the variability among experiments likely originated from differences in oocyst excystation rates.

A large proportion of monolayer cells remain uninfected
To investigate the effect of increasing oocyst doses on the infection of HCT-8 monolayers, parallel monolayers were infected with 10-fold incremented oocyst doses and analysed 24 h and 48 h post-infection. The lowest dose was equivalent to 1 oocyst per 1000 cells, and the highest dose was 1 oocyst/cell. Increasing oocyst doses resulted in higher parasite densities; however, the increment was not proportional to the dose, even when low oocyst-to-cell ratios were used. A regression of log parasite density on oocyst dose showed that a 10-fold increase in dose produced, on average, a 3·3-fold increase in parasite density at 24 h post-infection, and a 2·1-fold increase at 48 h post-infection.
Parasite development over a 100-h period was measured to obtain an estimate of parasite growth rates during the initial phase of asexual multiplication and compare observed and theoretical growth. Theoretical growth curves were calculated assuming that merogony takes 24 h, that only type I meronts are formed, and that type I meronts release 8 merozoites. For the C. parvum isolate TU114 and the 2 laboratory lines P1 and P3, the observed and expected growth were in reasonable agreement between 24 and 48 h post-infection, at which time C. parvum multiplication essentially stopped (not shown). This could indicate, among other possibilities discussed below, the exhaustion of susceptible cells and/or the differentiation of type II meronts which are thought to harbour 4, instead of 8, merozoites (Tzipori, 1988; Current and Reese, 1986).
C. parvum preferentially infects cells in S/G2/M
The annotation of the C. parvum and C. hominis genome predicts that these parasites are dependent on the host cell for essential metabolites such as purines, pyrimidines and amino acids. Thus we investigated whether dividing cells would be more likely to harbour intracellular parasites than G1/G0 cells. At 24 and 48 h post-infection, S/G2/M cells (Fig. 2, histograms A, B, region B) constituted between 9·2% and 37·9% of the total cell population (Table 1). In contrast, infected S/G2/M cells (Fig. 2, plots C, D, region F) as a percentage of the infected cells was consistently higher, ranging from 11·9% to 49·4%. The statistical significance of these results was evaluated using a paired t-test and found to be highly significant, regardless of whether Exp. 6, which was measured 48 h post-infection, was included (n=6, t=4·33, 5 D.F., P=0·008), or excluded (t=3·57, 4 D.F. P=0·023). These results show that S/G2/M cells are significantly more likely to be infected with C. parvum than expected from their relative abundance in the monolayer.
The higher prevalence of C. parvum in S/G2/M cells suggested that subconfluent monolayers with high proportions of dividing cells might be more favorable to C. parvum growth than confluent or near-confluent monolayers. To test this hypothesis, MDBK cells were synchronized by growing monolayers for 24 h past confluence, and cells from such monolayers were seeded at low density. Eighteen h post-seeding, when the number of cells in S/G2/M was at a peak, subconfluent and confluent control monolayers were infected with the same number of oocysts per surface area. Contrary to expectation, parasite prevalence was only marginally affected by monolayer confluence. Whereas S/G2/M cells were 5 times more abundant in the dividing monolayer (45% vs 9·2%) infection was only 1·2 times higher (11·7% infection vs 9·2%) in this monolayer.
C. parvum infection induces cell division
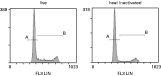
Based on previous observations showing increased cell mortality in C. parvum-infected cell monolayers (Griffiths et al. 1994; Widmer et al. 2000), we analysed whether host cell mortality is accompanied by an increase in the proportion of cells in mitosis. This assumption is consistent with the observed tendency of monolayer cells to restore monolayer integrity following disruption (Rosenblatt et al. 2001). The percentage of S/G2/M cells in infected and mock-infected confluent HCT-8 monolayers was determined 24 h and 48 h post-infection. Consistent with our expectation, a significant increase in S/G2/M cells in infected monolayers was observed (Fig. 3), regardless of whether monolayers were analysed 24 h or 48 h post-infection, or a 1[ratio ]1 or 2[ratio ]1 oocyst-to-host cell ratio was used. The average proportion of S/G2/M cells in 14 independently infected monolayers analysed 24 h post-infection was 34·3% (S.D.=6·2), whereas in 12 mock-infected monolayers this proportion was 27·6 (S.D.=6·1). The difference in the proportion of mitotic cells was evaluated with a t-test and found to be statistically significant (t=2·8, P=0·01). In contrast, the proportion of mitotic cells in 24 h and 48 h post-infection cultures was the same (P=0·4) as was the proportion of mitotic cells in monolayers infected at a 2[ratio ]1 and 1[ratio ]1 oocyst/host cell ratio.

Fig. 3. DNA histograms of infected and mock-infected control monolayer. Regions A, B as in Fig. 2. Note higher proportion of mitotic cells in live-infected monolayer.
DISCUSSION
By examining the interaction between C. parvum and host cells in epithelial cell monolayers, we found that the initial asexual development is more likely to occur in cells which are in the mitotic cycle than in stationary cells. It is our hypothesis that because of the parasite's dependence on host cell metabolites, dividing cells may be more favorable to parasite development. These observations are not applicable to natural infections, as in the small intestine dividing cells are located in the crypts, whereas intracellular stages of C. parvum do not appear to be restricted to particular regions along the crypt-villus axis. Alternative hypotheses could, however, account for the observed bias for dividing cells in vitro. Firstly, infected cells could be more likely to be retained in the monolayer if they are in S/G2/M phase. We could not investigate this possibility because cells recovered from the supernatant have undergone apoptotic changes which preclude cell cycle analysis. This interpretation would, however, contradict observations that cells in M phase can selectively be released from monolayers, a property used for the cell synchronization method known as mitotic shake-off (Terasima and Tolmach, 1963). On the other hand, consistent with our hypothesis are observations that Toxoplasma gondii tachyzoites and Trypanosoma cruzi trypomastigotes preferentially infect HeLa cells in S phase (Dvorak and Crane, 1981). Because those experiments examined only the initial process of attachment and invasion, it is unknown whether the subsequent intracellular development of T. cruzi and T. gondii is actually affected by the mitotic cycle of the host cell. The observations with T. gondii and T. cruzi suggest a second interpretation of our results, namely that the observed bias for S/G2/M cells is not due to the intracellular environment, but to preferential sporozoite attachment to, or invasion of dividing cells. It has long been known that cell surface antigen expression can vary during the cell cycle (Cikes and Friberg, 1971; Reyero and Waksman, 1980), and the same could occur for cell surface proteins which mediate sporozoite attachment. Regardless of the reason for the parasite's S/G2/M preference, the observation that subconfluent monolayers with a large proportion of dividing cells did not support higher parasite densities is surprising. However, in subconfluent monolayers oocysts were seen aggregating in cell-free areas, which is likely to reduce the ability of sporozoites to infect.
Although the difference in the proportion of mitotic cells in infected and mock-infected monolayers was significant, considerable variability was observed. This is also apparent when comparing the DNA histograms in Figs 2 and 3. Whereas in Fig. 3 the difference between infected and mock-infected control is readily apparent, the proportion of dividing cells in Fig. 2 is small (9·2% and 7·9% in infected and control, respectively). We assume that oocyst excystation rates, and perhaps the time post-confluence at which monolayers are infected, impacts parasite density. A more severe infection results in more cells being extruded from the monolayer and more cells entering mitosis.
In an attempt to better mimic the conditions encountered by C. parvum in the gastro-intestinal tract, other modifications to the culture system were attempted. Infected monolayers were grown in high C02 concentration or subjected to continuous motion, but none of these measures improved parasite development. The observation that motion does not improve parasite density in the monolayer, suggests that parasite development is not constrained by the limited dispersion of merozoites. The lack of a C02 effect confirms previous observations in HCT-8 cultures (Upton and Brilhart, 1994). Similarly, attempts to improve host cell survival by growing HCT-8 monolayers on collagen-coated surfaces decorated with peptides designed to engage integrin receptors on the host cell were also unsuccessful.
Together with previous results showing that inhibition of host cell apoptosis only moderately improves growth of C. parvum in culture (Widmer et al. 2000), the present results indicate that the host cell mitotic cycle is not the primary limitation of C. parvum growth. Our focus should be on finding methods to achieve continuous asexual multiplication, and on understanding the conditions needed for gamete differentiation and fertilization.
Funding from the American Water Works Association Research Foundation (project no. 2819) and the National Institute of Allergy and Infectious Diseases (grant AI55347) is gratefully acknowledged. Peptide decorated culture plates were provided by David Kaplan and Leah Abraham, Tufts University Bioengineering Center. Our thanks to Saul Tzipori and Donna Akiyoshi for the C. parvum isolate, John Nunnari for photography, Allen Parmelee for advice with flow cytometry, and Misha Hasan, AWWARF Project Manager, Frank Schaeffer III, George DiGiovanni, Susan Springthorpe and Jan Mead, AWWARF Project Advisory Committee, for comments and suggestions.