Introduction
Hydrogen sulphide (H2S) is the main reduced sulphur compound cycling through the atmosphere (Lelieveld et al. Reference Lelieveld, Roelofs, Ganzeveld, Feichter and Rodhe1997; Warneck Reference Warneck and Warneck2000). It is naturally released by volcanic phenomena (Möller Reference Möller1983), and bacterial breakdown of organic matter in anoxic environments, such as swamps, rice fields and sewers (Warneck Reference Warneck and Warneck2000). Anthropogenic sources, which account for c. 10% of the total global emissions, are petroleum refineries, pulp mills, tanneries, and geothermal fields exploited for energy production (Axtmann Reference Axtmann1975; Arnórsson Reference Arnórsson, Gieré and Stille2004). Both natural and anthropogenic sources may have possible adverse environmental effects. H2S is in fact a broad-spectrum poison, noxious to life (Beauchamp et al. Reference Beauchamp, Bus, Popp, Boreiko, Andjelkovich and Leber1984; Reiffenstein et al. Reference Reiffenstein, Hulbert and Roth1992) because it impacts on all the enzymatic activities in which metals, as cofactors, are involved. H2S also affects photosynthetic organisms, reducing CO2 fixation rate and growth of vascular plants and marine algae, although some cyanobacteria are tolerant or use H2S as an electron donor instead of H2O (Thompson & Kats Reference Thompson and Kats1978; Cohen et al. Reference Cohen, Jørgensen, Revsbech and Poplawski1986; Maas et al. Reference Maas, De Kok, Hoffmann and Kuiper1987a , Reference Maas, De Kok, Peters and Kuiper b , Reference Maas, van Loo and van Hasselt1988; Koch et al. Reference Koch, Mendelssohn and McKee1990). Some field evidence also supports the negative effects of H2S on lichens. For example, significant changes in biomass, cover and species composition of epiphytic lichen communities have been documented around geothermal fields or geothermal springs releasing H2S (Loppi Reference Loppi1996; Tretiach & Ganis Reference Tretiach and Ganis1999). Concentrations of 2 ppm H2S or lower can reduce photosynthesis and linear growth of a relatively tolerant species, Parmelia sulcata Taylor (Tretiach & Baruffo Reference Tretiach and Baruffo2001), modifying the content of selected elements at an extra- and intracellular level (Tretiach et al. Reference Tretiach, Monaci, Baruffo and Bargagli1999). These field results, however, are not fully confirmative, because in geothermal fields and springs H2S is often associated with toxic elements such as arsenic, boron and mercury (Arnórsson Reference Arnórsson, Gieré and Stille2004), that may have synergistic effects on lichens (Loppi et al. Reference Loppi, Cenni, Bussotti and Ferretti1998). Furthermore, the natural oxidation of H2S in the air leads to the formation of SO2, a pollutant that is notoriously highly toxic for lichens (Gries et al. Reference Gries, Sanz and Nash1995; Deltoro et al. Reference Deltoro, Gimeno, Calatayud and Barreno1999).
This study was specifically aimed at verifying, from a physiological standpoint, the effects of H2S on lichen photosynthesis in the absence of other pollutants. Samples were exposed in small exposure chambers under controlled conditions, in order to keep constant all those factors that could potentially influence the response to H2S (e.g. thallus hydration, temperature). The vitality of samples was estimated by measuring F v/F m, that is the maximum quantum efficiency of Photosystem II (PSII) in capturing the activation energy (Genty et al. Reference Genty, Briantais and Baker1989), because previous studies have shown that this parameter is particularly apt to describe the negative effects of H2S on the photosynthetic process (Maas et al. Reference Maas, van Loo and van Hasselt1988). Our hypotheses were the following: 1) lichens are sensitive to H2S even at low air concentrations; 2) cyanolichens differ from chlorolichens in H2S tolerance; 3) the lichen response to H2S is modulated by light; 4) the dose-effect relationship is modulated by the surface/dry weight ratio of samples.
Material and Methods
Lichen sampling and pre-treatments
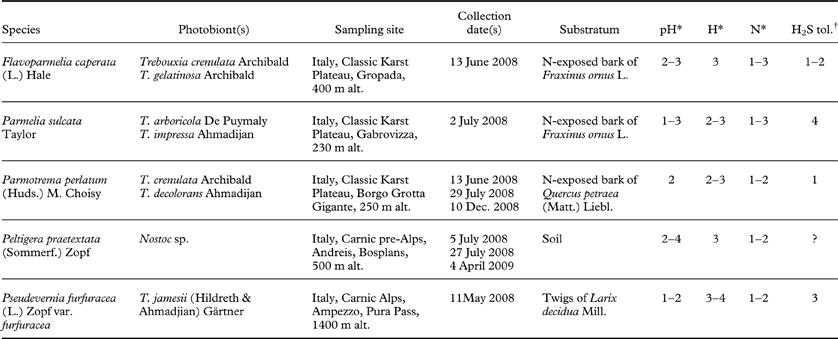
Five lichens with different ecologies and photobionts were used (Table 1). The four chlorolichens (namely Flavoparmelia caperata, Parmelia sulcata, Parmotrema perlatum, and Pseudevernia furfuracea) show a different distribution around an H2S emitting vent, suggesting a different tolerance to the pollutant (Tretiach & Ganis Reference Tretiach and Ganis1999); furthermore, they have frequently been used in our laboratory for basic and applied research (Baruffo et al. Reference Baruffo, Piccotto and Tretiach2008; Piccotto & Tretiach Reference Piccotto and Tretiach2010; Piccotto et al. Reference Piccotto, Bidussi and Tretiach2011; Tretiach et al. Reference Tretiach, Crisafulli, Pittao, Rinino, Roccotiello and Modenesi2005, Reference Tretiach, Adamo, Bargagli, Baruffo, Crisafulli, Giordano, Modenesi, Orlando and Pittao2007a , Reference Tretiach, Piccotto and Baruffo b ), and the factors influencing their chlorophyll a fluorescence (Chl a F) emission under artificial laboratory conditions are relatively well known. Peltigera praetextata was added as a representative of heteromerous cyanolichens.
Lichens investigated and collection data.
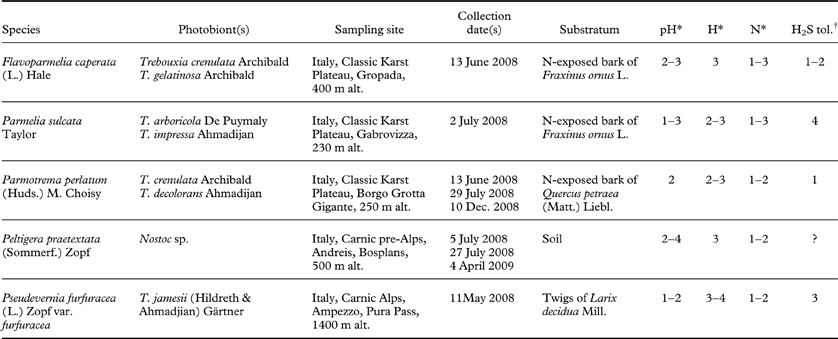
* Categories of acidophytism (pH), hygrophytism (H), and eutrophication (N) according to Nimis & Martellos (Reference Nimis and Martellos2008).
† The scale of H2S tolerance, ranging from 1 to 5, is based on the field data of Tretiach & Ganis (Reference Tretiach and Ganis1999).
The lichen samples were collected in natural sites far from known air pollution sources. Entire thalli were detached from the substratum, when necessary using the blade of a cutter, put in Petri dishes, immediately transported to the laboratory, left to dry out for 24 h at room temperature under diffuse light (<10 µmol photons m–2 s–1), and then carefully cleaned of foreign material and dead parts. Samples of 10 ± 0·5 mg were selected from the terminal parts of lobes, because these portions have considerably higher Chl a F emission than the central ones (Tretiach et al. Reference Tretiach, Piccotto and Baruffo2007 b; Baruffo et al. Reference Baruffo, Piccotto and Tretiach2008).
Experiments were carried out within ten days of the lichen samplings. Before measurements were made, the samples were immersed in distilled water for 3 min and placed on rigid plastic nets within plastic boxes containing water at the bottom, that were covered (but not sealed) with transparent plastic wrap. The boxes were placed in a growing chamber for 48 h at 20 ± 1°C, with a light/dark regime of 14/10 h. Photosynthetically active radiation (PhAR) flux in the 400–700 nm waveband, provided by neon lamps (Sylvania Grolux T8 F36W/GRO G13 F 36W), and checked using a Micro–Quantum 2060–M Sensor (Walz, Effeltrich, Germany), was set between 18 and 35 µmol photons m–2 s–1, from the most sciophilous (Parmotrema perlatum) to the most heliophilous (Peltigera praetextata) species, corresponding to one sixth of the respective PPFDIk value (photosynthetic photon flux at which the quantum yield of CO2 assimilation is the highest).
Lichen exposure to H2S
For exposure to H2S, 600 ml commercial glass jars were used. In each of them, four squared glass beads were attached with cyanoacrylic superglue (Loctite Super Attak®, Henkel) at three quarters of the total height, and a glass slide was pasted on the beads. The closing cap was modified replacing the flat metal upper part with a clock glass of similar size, sealed with a commercial neoprenic glue (Artiglio®) on the threaded border in order to also allow light penetration from above. All materials were inert to H2S (Ma et al. Reference Ma, Cheng, Li, Chen, Quan, Zhao and Niu2000).
The chambers, immersed in a water bath at 20°C, were alternatively filled with 200 ml of distilled water, 0·7×10–7 M and 8·7×10–6 M H2S solutions (Carlo Erba Reagenti, Rodano, MI, Italy) to achieve, in the air contained in the void volume, a theoretical concentration of 0 (control), 5 ppm H2S (treatment 1) and 50 ppm H2S (treatment 2), as calculated according to the reactivity of H2S in distilled water and to Henry's law. Immediately after, four samples of the same species, with an optimum thallus water content of c. 140–160% in parmelioid lichens, and c. 160–180% in Peltigera pratextata, were positioned on the upper side of the glass slide of each chamber; the chambers were closed and left for 2, 4 and 8 h under light (experiment A), and in the dark (experiment B). Three replicates, for a total of 12 samples of each species, were run for each concentration and for each exposure time. In experiment A, samples of all five species were exposed to half the respective PPFDIk value. Nearly natural spectrum light was provided by Osram HLX 250 W lamps, and PhAR flux was checked with the sensor inserted inside the exposure chambers in the same position as the lichen thalli. In experiment B, samples of Parmotrema perlatum and Peltigera praetextata were kept in the dark from the last watering on, and during the following exposure, which lasted as in experiment A.
Chl a F measurements
Chl a F measurements were carried out on the same samples before and after exposure in the chambers containing distilled water or one of the two H2S solutions. For pre-exposure measurements, the samples were taken out of the growing chamber, immersed for 3 min in distilled water, gently shaken by hand, and dark-adapted for 30 min. For post-exposure measurements, the closed exposure chambers were darkened for 30 min with a black velvet cloth, and the samples were measured immediately after the opening of their respective exposure chamber. In this case, no further watering was necessary, because the water content of the samples did not change significantly due to the water vapour saturation of the small volume. The measurements were carried out after 2, 4 (experiment A only) and 8 h of exposure, using different sets of samples. To verify the possible recovery of Chl a F emission, the samples were sprayed with distilled water at the end of the post-exposure measurements, and put in the growing chambers at the same pre-conditioning conditions described above. Chl a F measurements were carried out after 24 h and, when necessary, after 48 and 72 h, following the same procedures described above.
All Chl a F measurements were carried out with a pulse-amplitude-modulated fluorimeter Mini-PAM (Walz, Effeltrich, Germany; signal detection λ: >710 nm; emission maximum of the measuring light source: 650 nm; standard intensity: 0·15 µ mol photons m–2 s–1; modulation frequency: 0·6 kHz). The measuring fibre optic, 100 cm long and with an active diameter of 5·5 mm, was put at 90° over the upper surface of the samples, always in the same position. The pulsing modulated red light was turned on to obtain F 0 (minimal Chl a F level), and a 0·8 s saturating light pulse (c. 8 000 µmol photons m–2 s–1) was applied to obtain F m (maximum Chl a F level). F v/F m (maximum photochemical quantum yield) was calculated as (F m − F 0)/F m. In order to compare values obtained at different internal temperature of the instrument, the data were standardized at the emission observed at 18°C, as described by Baruffo & Tretiach (Reference Baruffo and Tretiach2007).
Specific thallus area of samples
The specific thallus area (STA, cm2 mg–1 dry weight) was determined in 12 samples of each species. To measure the area, fully hydrated samples were carefully laid between two glass plates and scanned at 600 dpi with a Perfection V100 scanner (Epson, Japan). The upper surface colour images were analyzed with the program Jasc ® Paint Shop Pro version 7.00 (Jasc Software Inc), by transforming them into black-and-white images, by checking them manually, and finally by converting pixels into area (cm2). Pseudevernia furfuracea produces isidia, finger-like vegetative propagules that significantly increase the exchange surface of the thallus, up to 200–300% (Tretiach et al. Reference Tretiach, Crisafulli, Pittao, Rinino, Roccotiello and Modenesi2005). Because moderately isidiate samples were used in our H2S experiments, a lower correction percentage (120%) was applied. The dry weight of samples was measured after 24 h at 80°C and after a further 2 h at room temperature in a glass chamber containing drying silica.
Determination of the actual H2S exposure concentrations
The complex equilibria to which the H2S molecules are involved suggested an analytical control of the actual concentration values inside the exposure chambers. This was done by using the 50/30 µm divinylbenzene/carboxen/polydimethylsiloxane (DVB/CAR/PDMS) highly cross-linked fibre (Supelco Inc., Bellefonte, PA, USA) as a H2S trap, as suggested by Fan (Reference Fan2004), Cai et al. (Reference Cai, Koziel, Davis, Lo and Xin2006), and Vazquez-Landaverde et al. (Reference Vazquez-Landaverde, Qian and Torres2007) in their studies on the quantification of sulphur compounds by CAR and PDMS or CAR, DVB and PDMS. In order to introduce the fibres inside the exposure chambers, the metal caps were opportunely modified. They were pierced, the hole subsequently closed with a 2 mm thick rubber with foil glued on the external face of the cap, and the fibres singularly injected with the aid of a fibre holder for manual sampling after 2, 4 and 8 h from the filling of the exposure chambers with distilled water (used as control) or one of the two H2S solutions. Three sets of three chambers each were analyzed: 1) without lichen material, 2) with samples of Parmotrema perlatum or Peltigera praetextata of the same dry weight used in experiments A and B, and 3) with samples of the same species devitalized at 70°C for 24 h. The exposed fibres were then singularly introduced in the circuit of an Agilent 5973 Network gas chromatograph-mass spectrometer (Agilent Technologies, Palo Alto, CA, USA), connected to a bonded phase fused silica BP20 column (length 30 m; internal diameter 0·25 mm; film 0·25 µm), in which ultra-pure helium (99·9999%) was used as a carrier gas. The calibration curve was obtained by diluting a certified gas mixture of 52·7 ppm H2S with ultra-pure N2. The curve allowed us to estimate H2S concentrations in the range 2–50 ppm with a per cent relative error of 15% at the lower concentration, and 4% at the higher concentration, mostly due to the manual use of the syringe (Arthur & Pawliszyn Reference Arthur and Pawliszyn1990).
Statistics
All statistical analyses were performed with Microsoft Office Excel 2003 SP2 (Microsoft corporation, WA, USA) and STATISTICA 6.0 (StatSoft Inc., Tulsa, OK, USA). The Shapiro-Wilk's test was used to check the F v/F m pre-exposure values of each species for normality, and skewness and kurtosis were evaluated in order to describe the symmetry and shape of the data distribution curves. Since in three species there was a noticeable deviation from a Gaussian distribution curve, the F v/F m values are presented with non-parametric descriptors (first, median and last quartile), as suggested by Lazár & Nauš (Reference Lazár and Nauš1998) and Baruffo & Tretiach (Reference Baruffo and Tretiach2007), and the statistical analysis was based on non-parametric tests (i.e. the Mann-Whitney U test for comparison of H2S-treated vs. control samples, and the Wilcoxon matched pairs test for comparison of pre- and post-exposed samples).
Results
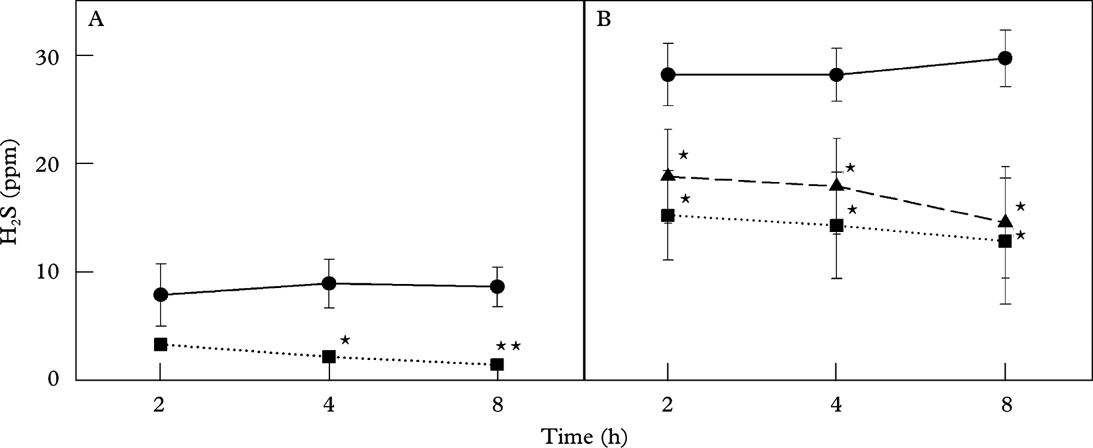
The two H2S solutions contained at the bottom of the hermetically-closed exposure chambers equilibrated quickly with the air contained in the void volume. Thus, gaseous H2S concentrations were already stable after 2 h, remaining constant at c. 8 and 28 ppm H2S after 4 h, with a slight but not statistically significant increase after 8 h in the exposure chambers with the higher concentration solution (Fig. 1).
Mean ± one standard deviation of H2S concentration measured in the void volume of the exposure chambers after 2, 4 and 8 h after the introduction of 8·7×10–7 (A) and 8·7×10–6 (B) M H2S solutions. Concentrations were measured without lichen material (control) and with living or dead samples of Parmotrema perlatum. • control; ▪ living samples; ▴ dead samples; significant differences compared with the control (* for 0·05>P≥0·01; ** for P<0·01) are marked (n=3).

The introduction of living, fully hydrated samples into the exposure chambers heavily modified the final H2S concentrations in the air. After 8 h, H2S decreased to c. 2 ppm at the lower concentration (−80%), and to 14 ppm at the higher concentration (−50%). Peltigera praetextata absorbed more H2S than Parmotrema perlatum, although the difference was not statistically significant due to the high standard deviation of the data sets (data not shown). With dead, air-dry samples the H2S decrease was less intense (Fig. 1), although the difference between the two species persisted.
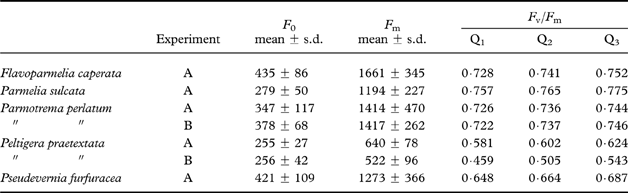
Pre-exposure Chl a F levels differed significantly among the five lichens (Table 2). F 0 ranged between 23 and 49% of the respective F m. The lowest F v/F m value was recorded in Peltigera praetextata, a lichen with Nostoc as photobiont. Among the remaining four chlorolichens, the highest median value was observed in Parmelia sulcata, the lowest one in Pseudevernia furfuracea. The Chl a F emission of lichens was heavily reduced at the end of the exposure experiments A and B, according to dose and duration of H2S exposure (Tables 3 & 4).
Pre-exposure values of samples used in experiments A (light) and B (dark).
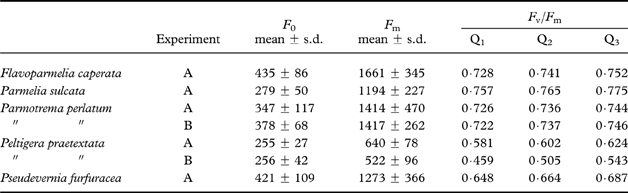
Measurements are given as mean ± one standard deviation (F 0 and F m) and 1st quartile (Q1), median (Q2) and 3rd quartile (Q3) (F v/F m). n=108 in A, 72 in B.
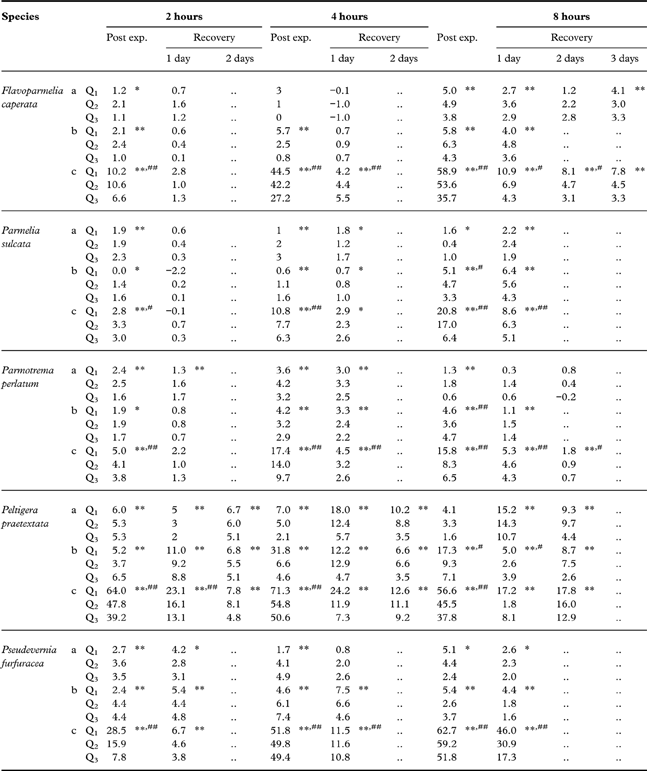
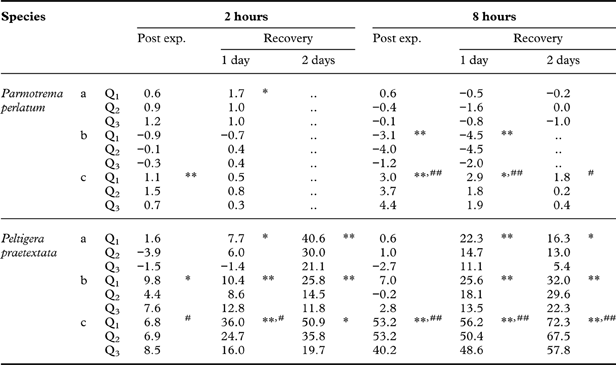
Experiment A: per cent decrease of F v/F m with respect to the pre-exposure values of Table 2 after 2, 4 and 8 hours (post exp.) in the light in fumigation chambers containing distilled water (a), 8.7×10⁻⁷ (b) and 8.7×10⁻⁶ (c) M H2S solutions; the recovery was measured after 1, 2 and/or 3 days without H2S.
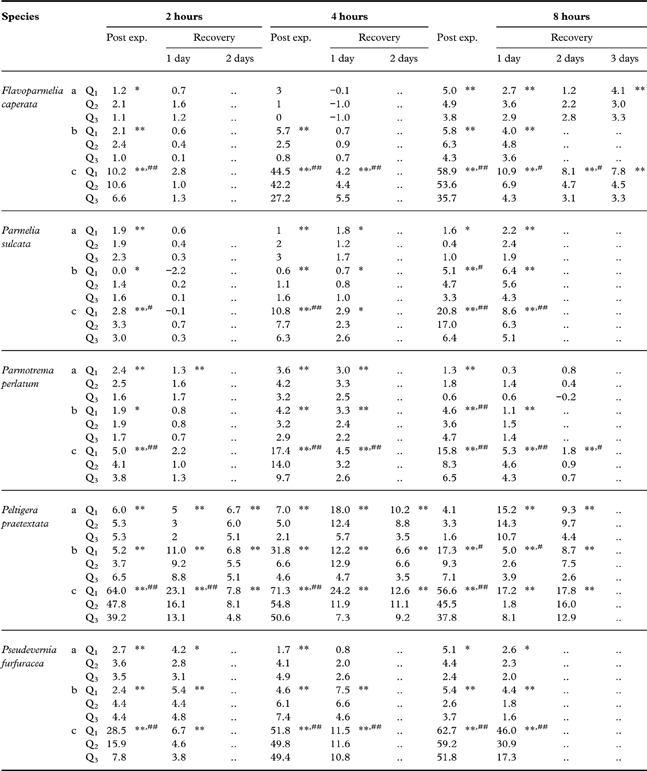
Q1: 1st quartile; Q2: median; Q3: 3rd quartile. Significant differences with pre-exposure (* for 0·05>P≥0·01; ** for P<0·01), and control (# for 0·05>P≥0·01; ## for P<0·01) values are marked (n=12).
Experiment B: per cent decrease of Fv/Fm with respect to the pre-exposure values of Table 2 after 2 and 8 hours (post exp.) in the dark in fumigation chambers containing distilled water (a), 8.7×10⁻⁷ (b) and 8.7×10⁻⁶ (c) M H2S solutions; the recovery was measured after 1 and 2 days without H2S
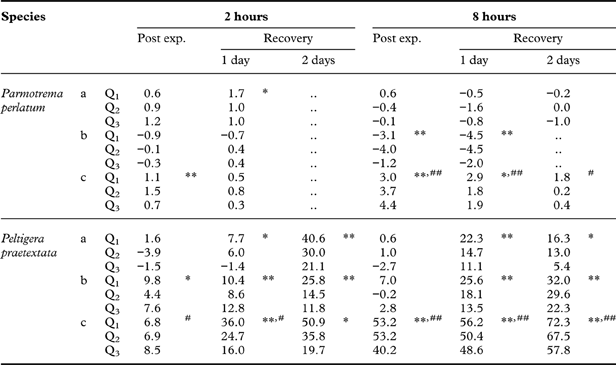
Q1: 1st quartile; Q2: median; Q3: 3rd quartile. Significant differences with pre-exposure (* for 0·05>P≥0·01; ** for P<0·01), and control (# for 0·05>P≥0·01; ## for P<0·01) values are marked (n=12).
In the light experiment A (Table 3), at the lower dose, there was a slight but statistically significant reduction in F v/F m after 4 h, which became more intense and evident after 8 h. At the higher dose, negative effects were already detected after 2 h, with a slight statistically significant lowering of F v/F m in all the lichens, but more evident in Peltigera praetextata and Pseudevernia furfuracea. After 4 h, the phenomenon intensified, with Flavoparmelia caperata much more affected than after 2 h, and Parmelia sulcata and Parmotrema perlatum still relatively unaffected. After 8 h, all the species had lower F v/F m values, although the phenomenon was a little less intense in Paltigera praetextata, because some of the samples tolerated the exposure better. The observed decrease of F v/F m derived from a significant drop of F m in all species, although in P. praetextata there was also a parallel increase of F 0 (data not shown). The decrease in F v/F m in the light-exposed samples, which lay within 8·3–59·2% of the pre-exposure values after 8 h, was totally reversible, because the respective pre-exposure values were fully re-established in all the lichens after the post-exposure recovery of 1–3 days in the absence of H2S (Table 3).
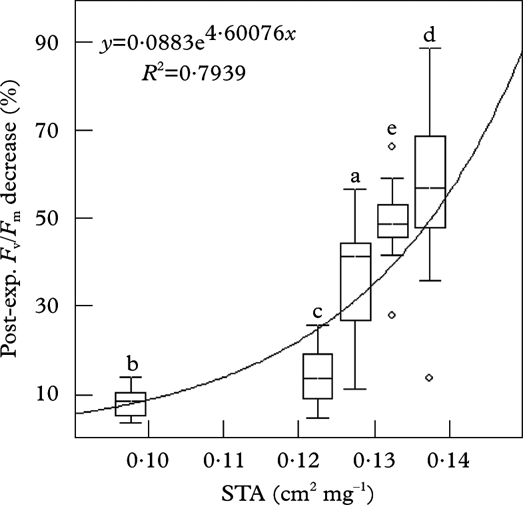
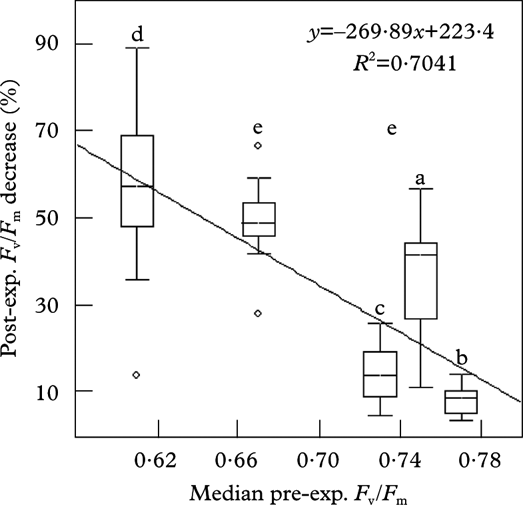
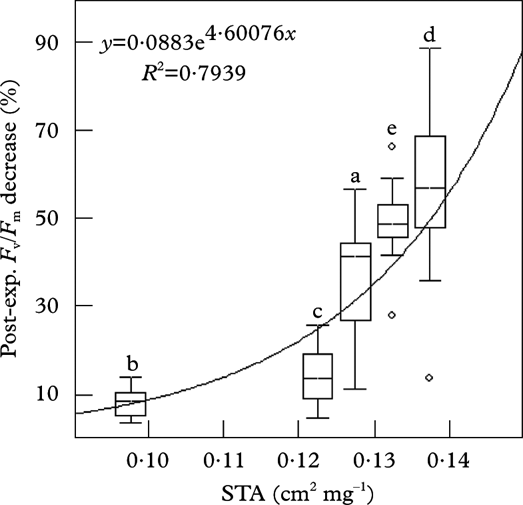
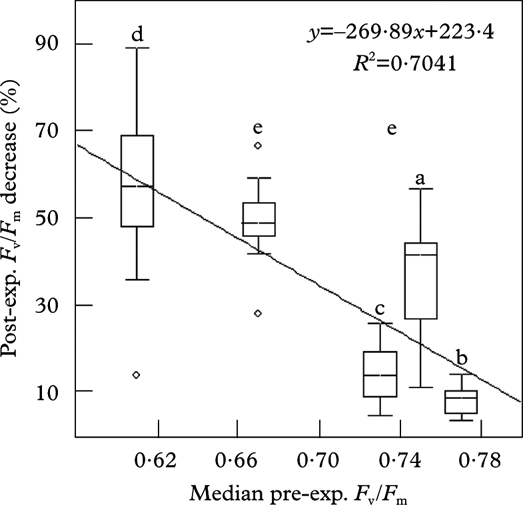
In this experiment, all the lichens suffered from the effects of H2S in proportion to the exposed surface of the samples (Fig. 2). The observed per cent decrease of F v/F m, however, was also related to the pre-exposure median value of the photosynthetic quantum yield of each species: the lichens with lower pre-exposure values, in fact showed a greater decrease in F v/F m and vice versa (Fig. 3).
Correlation between specific thallus area (STA, cm2 mg–1 dry weight, x-axis), and F v/F m per cent decrease after 4 h exposure to the 8·7×10–6 M H2S solution (y-axis). Median, 25°–75° percentiles (boxes), non-outlier minimum and maximum (whiskers) and outlier (circles) are reported: a, Flavoparmelia caperata; b, Parmelia sulcata; c, Parmotrema perlatum; d, Peltigera praetextata; e, Pseudevernia furfuracea (n=12).
Correlation between median pre-exposure F v/F m (x-axis) and per cent decrease of F v/F m after 4 h exposure to the 8·7×10–6 M H2S solution (y-axis). Symbols as in Figure 2 (n=12).
In the no-light treatment (experiment B), the samples of Parmotrema perlatum and Peltigera praetextata suffered a less pronounced decrease of F v/F m than in experiment A (Table 4). However, under the new experimental conditions the cyanolichen was totally unable to recover; after two days with neither H2S nor light its photosynthetic quantum yield was still declining, while the chlorolichen recovered fully.
Discussion
The maximum photochemical quantum yield is strongly related to the efficiency of PSII, and therefore the sharp, sudden decline of F v/F m observed in all the species in both experiments (Tables 3 & 4) can be interpreted as a direct effect of H2S on PSII. However, since the decrease of F v/F m was primarily related to a drop in the maximum Chl a F level (F m), a block of the electron transport chain can also be postulated. These results are fully congruent with those concerning the action mechanism of H2S on other oxygenic photosynthetic organisms, and vascular plants in particular (see e.g. Thompson & Kats Reference Thompson and Kats1978; Maas et al. Reference Maas, van Loo and van Hasselt1988). Since H2S inhibits metalloenzymes, in a similar way to cyanide and azide ion (Reiffenstein et al. Reference Reiffenstein, Hulbert and Roth1992), the activity of all electron transport chains, essential for the functioning of the light phase as well as for mitochondrial respiration, are seriously at risk in the presence of H2S. However, the most sensitive target of the photosynthetic process seems to be the oxygen-evolving complex, OEC (Sivaraja et al. Reference Sivaraja, Hunziker and Dismukes1988). This enzyme is involved in the photolysis of water molecules which are the source of the electron flux that, drawn by the photosystem reaction centres, goes through the electron transport chains to NADP+, consequently reduced to NADPH+H+. The inhibition of OEC necessarily implies the block of PSII and of the NADPH+H+ production.
At low H2S concentrations, the inhibition of OEC might derive from the oxidation status of the OEC cofactor that contains the catalytic site(s) (DeRose et al. Reference DeRose, Mukerji, Latimer, Yachandra, Sauer and Klein1994; Barber Reference Barber2002). According to the widely accepted S-state model, OEC passes through five successive states, from S0 to S4, which represent progressively more oxidized forms of the Mn4O5 complex, and are more or less stable (Kok et al. Reference Kok, Forbush and McGloin1970). Interestingly, a strong OEC inhibitor, hydroxyl-amine (NH2OH), is known to directly interfere with the states S1 and S2, which become unstable and fall into the state S0, instead of passing to the successive, more oxidized state S3, thus determining the immediate block of the photolytic process. According to this model, the lowering of intracellular H2S partial pressure by metabolic consumption (S is a cellular macro-nutrient for any plant cell), or by equilibrium with a H2S-free atmosphere, should allow a relatively fast recovery of OEC activity, as actually observed in our post-exposure recovery treatment in light-exposed samples (all species, see Table 3).
At high H2S concentrations, OEC becomes inactive for the detachment of the Mn4Ox complex (Sivaraja et al. Reference Sivaraja, Hunziker and Dismukes1988). In this case, recovery in the absence of H2S is more problematic and requires more time, because the damaged OECs must be substituted, partially or in toto, together with other impaired components of the photosynthetic apparatus (as it probably occurred in Peltigera praetextata, the sole species that increased F 0 after exposure at the higher H2S dose). Some of our results are congruent with a purported damage to OEC caused by the detachment of the Mn4Ox complex, since at the higher H2S dose the F v/F m values significantly increased after the recovery period, but the recovery periods were longer than at the lower H2S dose and recovery itself was incomplete, at least for some of the samples of Parmotrema perlatum and Pseudevernia furfuracea. Hashimoto et al. (Reference Hashimoto, Yamamoto and Theg1996) suggested that free OEC subunits are frequent in the thylakoid lumen, representing c. 20–50% of the whole pool, and they are more stable in the dark. This possibly explains the different result of light- vs. dark-exposed samples observed in this study. However, this difference might also be related to another peculiar feature of OEC. The physical bond between catalytic site(s) and substratum (the H2O molecule or the interfering H2S molecule) is formed during the rapid transition from S4 to S0. In the dark, almost all the OECs are in S1 because this state is thermodynamically more stable than the others (Kok et al. Reference Kok, Forbush and McGloin1970). This would determine a certain resistance to the H2S attack because S4, the sole state to be fully capable of interacting with the substratum, would be virtually absent.
The different response intensity observed among the species certainly depends on several phenomena. For example, some vascular plants can metabolize H2S in the form of water-soluble, sulphur-containing compounds such as cysteine, glutathione, and γ-glutamyl-cysteine (De Kok et al. Reference De Kok, Maas, Godeke, Haaksma and Kuiper1986; Maas et al. Reference Maas, De Kok, Peters and Kuiper1987b ; Buwalda et al. Reference Buwalda, Stulen, Kok and Kuiper1990; Stuiver & De Kok Reference Stuiver and De Kok2001; Westerman et al. Reference Westerman, Stulen, Suter, Brunold and De Kok2001), but not in the form of sulphates (Maas et al. Reference Maas, De Kok, Peters and Kuiper1987b ). As regards lichens, nothing is known from this point of view, but Tretiach et al. (Reference Tretiach, Monaci, Baruffo and Bargagli1999) actually observed an enrichment of the total sulphur content in thalli of Parmelia sulcata grown near an H2S- emitting vent, with a significant increase in the intracellular content. We can argue, however, that in our experiments H2S concentrations were too high and exposure periods too short to allow the photobionts to keep the intracellular sulphur concentration constant by accumulating sulphur compounds. Certainly, the samples were able to absorb H2S both actively and passively, as shown by the different concentrations within the exposure chamber containing living and dead material (Fig. 1). However, it is not hazardous to assert that the post-exposure F v/F m variation among species primarily depends on the resistance to H2S diffusion opposed by the thallus. This is obviously determined by the surface/volume ratio, of which STA is a good proxy, and by the nature of the outer layers, histochemically and anatomically highly variable among species. A third factor, the thallus water content, was near the species-specific optimum and remained relatively constant during the exposures; it therefore has little importance in this context. In fact, thalli with smaller STA were less affected than thalli with larger STA (Fig. 2). Furthermore, the analysis of H2S concentration inside the exposure chambers showed that thalli of Peltigera praetextata, with their greater exchange surface, absorbed more H2S than thalli of Parmotrema perlatum, which is denser and more compact. In this case, the peculiar anatomy of Peltigera praetextata also probably favoured the H2S absorption, because in this lichen the lower face is ecorticated, with interhyphal medullary spaces that open freely outward (Vitikainen Reference Vitikainen1994), whereas in the other four chlorolichens it is corticated, with hyphae that are agglutinated. It is noteworthy, however, that the sole species with a pseudocyphellate upper cortex, Parmelia sulcata, was relatively more resistant to H2S than the other chlorolichens with a non-pored upper cortex (e.g. Flavoparmelia caperata, Parmotrema perlatum). Although apparently inexplicable, this relative resistance of Parmelia sulcata accords well with the field observations of Tretiach & Ganis (Reference Tretiach and Ganis1999), which identified this lichen as the most resistant foliose species among those colonizing the trees around a natural H2S vent.
Further species-specific differences in H2S tolerance were observed in a field survey that certainly suffers from the shortcomings addressed in the introduction (Tretiach & Ganis Reference Tretiach and Ganis1999). For example, basophilic species are less tolerant than acidophilic species, with the latter occurring nearer to the H2S source, probably because H2S acidifies rainfall, fogs, and the water runoff of trunks. The acidification modifies the chemical properties of the tree bark (e.g., availability of some elements, see Bates & Brown Reference Bates and Brown1981), and consequently also the element content of lichen thalli is affected at both an extra- and intracellular level (Tretiach et al. Reference Tretiach, Monaci, Baruffo and Bargagli1999). This may have heavy effects at a metabolic level, causing the perturbation of some important metabolic pathways (e.g. calcium oxalates are not deposited on the wall of the hyphae of the medulla, see Tretiach et al. Reference Tretiach, Monaci, Baruffo and Bargagli1999). In the meantime, H2S causes the reduction of photosynthesis (as confirmed by this study) and growth (Tretiach & Baruffo Reference Tretiach and Baruffo2001), and this may modify the competitive fitness for space occupancy and, over long periods, the species composition of lichen communities (Tretiach & Ganis Reference Tretiach and Ganis1999). There is, however, a further point that deserves attention. Some lichens, mainly crustose and all of them with a green alga as photobiont, possibly Trebouxia, are actually favoured by the presence of H2S. In some cases this is simply the result of competitive phenomena: several crustose species are often pioneers that colonize the smooth bark of young trees, and are overgrown by foliose species that arrive in a second phase of the colonization and have faster growth rates (Degelius Reference Degelius1964, Reference Degelius1978). In other cases, however, the story looks different. The most glaring example is offered by Lecanora conizaeoides, a lichen whose present, declining distribution in Western Europe is strictly related to sulphur availability (mainly in the form of SO2, see Edwards et al. Reference Edwards, Aptroot, Hawksworth, James, Smith, Aptroot, Coppins, Fletcher, Gilbert, James and Wolseley2009). Laundon (Reference Laundon2003) identified the primeval sites of this species in H2S fumaroles of southern Europe, where it is actually very abundant and often the sole lichen able to colonize dead trunks, twigs and, exceptionally, also peaty soil and plant debris. Chl a F measurements taken near an H2S vent on well-developed thalli of L. saligna, a further H2S tolerant species (Czyzewska Reference Czyzewska1991), revealed high F v/F m median values (c. 0·695) when co-occurring thalli of Parmelia sulcata were below 0·530 (Baruffo Reference Baruffo2007). Tolerance mechanisms at the photobiont level must thus be hypothesized, and are badly in need of further study.
It is worth noting that near natural H2S sources cyanolichens, that is lichens with cyanobacteria as main photobiont, are rare (Shimizu Reference Shimizu2004). This might be related to the sensitivity of their photobionts to H2S. Actually, cyanobacteria differ greatly in H2S sensitivity. Some of them are very tolerant to H2S, using it as an electron donor alternative to H2O, like green sulphur bacteria (Cohen et al. Reference Cohen, Padan and Shilo1975, Reference Cohen, Jørgensen, Revsbech and Poplawski1986; Belkin & Padan Reference Belkin and Padan1983). Other cyanobacteria preserve photosynthesis by means of an active oxygen resistance mechanism, mediated by PSII (Miller & Bebout Reference Miller and Bebout2004). A third group, more numerous, is very sensitive to H2S because their photosynthetic process is blocked by a mechanism very similar to that described in vascular plants (Miller & Bebout Reference Miller and Bebout2004), but inhibition is extended to the active transport of CO2 inside the cell (Espie et al. Reference Espie, Miller and Canvin1989). Adaptive mechanisms to environmental conditions can further complicate the picture: for example, the mechanism of resistance to H2S is developed only when cyanobacteria are exposed to high concentrations of the pollutant, and is lost if they grow in the absence of H2S (Miller & Bebout Reference Miller and Bebout2004). Nostoc, the cyanobiont of Peltigera and many other cyanolichens, belongs to the third group, and our results are certainly congruent with this. However, the strong decrease of F v/F m observed in P. praetextata (−54·8% at the higher concentration after 4 h) needs some further comment. As discussed above, a diriment factor may be the high absorption of the pollutant through the sample surface. A further one is the progressive modification of light absorption and emission under the light intensities of both exposure and post-exposure regimes, because phycobilisomes, that contribute to F 0 (Miller & Bebout Reference Miller and Bebout2004) causing the lowering of F v/F m (Sundberg et al. Reference Sundberg, Campbell and Palmqvist1997), are highly plastic from this point of view, and rapid in their re-allocation (Tandeau de Marsac & Cohen-Bazire Reference Tandeau de Marsac and Cohen-Bazire1977; Liu et al. Reference Liu, Chen, Zhang and Zhou2005). This might also explain the different recovery kinetic observed between light- and dark-exposed samples of P. praetextata. Otherwise, we should hypothesize that only under light the cyanobionts have the ability, or perhaps the stimulus, to restore the adequate multi-enzymatic pool necessary to sustain the photosynthetic activity. Much more experimental work, however, is needed to verify the behaviour of cyanolichens, ideally if selected among those with phyletically distant cyanobionts.
Conclusion
The toxic effect of H2S on lichens is indisputable, as we observed a pronounced decrease of F v/F m even after short exposure times, positively correlated to sample surface and, to a lesser extent, to the pre-exposure F v/F m value. The lichen tolerance to H2S seems to be species-specific and it is determined, at least partially, by the photobiont (Nostoc vs. Trebouxia). Finally, the results are fully congruent with the hypothesis that the block of the photosynthetic process is primarily determined by the block of the oxygen-evolving complex.
We thank Dr L. Giorgini (ARPA FVG, Trieste) for valuable technical support in the measuring of H2S concentration, and Dr C. Tavagnacco (University of Trieste) for discussion on H2S chemistry. One of us (MT) thanks Dr D. H. Brown for hosting an early collaboration in studying H2S effects on lichens.