INTRODUCTION
The eastern flank of the Andes provides a range of habitats from Amazon rain forest to snowcapped peaks over a very short distance. Steep environmental gradients in mean and minimum temperature are intimately tied to the empirically derived local moist-air adiabatic lapse rate, which is −5.5°C per kilometer of ascent (Bush et al., Reference Bush, Silman and Urrego2004; Urrego et al., Reference Urrego, Bush and Silman2010). The boundary between premontane and lower montane forest in the Peruvian Andes lies between 1300 and 1500 m elevation, corresponding to mean temperatures of 18–19°C. Although this is not a sharp boundary, ecological gradients of temperature and moisture create an ecotone, which has been documented by many studies (reviewed by Webster, Reference Webster1995). This ecotone is subject to cloud immersion, with abundant bryophytes, making it a sensitive indicator of moisture input (Pounds et al., Reference Pounds, Fogden and Campbell1999; Foster, Reference Foster2001). Premontane forests are taller, less humid, and dominated by species that have their origins in the lowland, primarily Gondwanan flora, compared with lower montane forests. Above the ecotone, composition shifts toward families characteristic of montane settings, many of which have their evolutionary roots in Laurasia (Gentry, Reference Gentry1988). Daily inundation by cloud in the lower montane forest creates a perhumid environment where light limitation can be an important constraint on growth (Fahey et al., Reference Fahey, Sherman and Tanner2015).
The Kosñipata and Callanga valleys within the Manu Biosphere Reserve have been a center of ecological research investigating the response of Andean forests across an elevational gradient from 400 m to 3400 m. A suite of 30 1-ha tree plots were established by the Andes Biodiversity and Ecosystem Research Group (Malhi et al., Reference Malhi, Silman, Salinas, Bush, Meir and Saatchi2010) and provide robust baseline data for studies in this area of Manu. Moss polsters collected adjacent to the tree plots have helped to calibrate modern pollen representation along the elevational gradient (Weng et al., Reference Weng, Bush and Silman2004; Urrego et al., Reference Urrego, Silman, Correa-Metrio and Bush2011). Three lakes at 3400 m elevation, close to the modern treeline, provided sedimentary sequences from which fossil pollen revealed the long-term treeline changes from glacial to interglacial conditions (Urrego et al., Reference Urrego, Silman, Correa-Metrio and Bush2011). Analyses of pollen and charcoal from randomly located soil pits straddling the modern treeline showed that although the treeline appears to have been relatively stable, the sharpness of this boundary has been blurred relatively recently by increased fire activity and upslope migration (Bush et al., Reference Bush, Alfonso-Reynolds, Urrego, Valencia, Correa-Metrio, Zimmermann and Silman2015). Implicit in this analysis was the expectation that trees migrate in response to short-term climate oscillations, such as the response to anthropogenic climate change. Feeley et al. (Reference Feeley, Silman, Bush, Farfan, Cabrera, Malhi, Meir, Revilla, Quisiyupanqui and Saatchi2011) demonstrated that throughout the elevational gradient trees are indeed migrating upslope, in response to ongoing climate change in the region, but at a rate of only 2.5–3.5 m per year; considerably slower than the 5.5–7.5 m needed to keep pace with ongoing warming. Here we provide a detailed record from just below the premontane to lower montane forest ecotone of forest migration in response to climate change in the late Holocene.
Climate change in the late Holocene
A series of major droughts caused lake levels to drop in the Andes and adjacent Amazonia between 9000 and 5000 calibrated 14C years before present (hereafter cal yr BP) (Baker et al., Reference Baker, Seltzer, Fritz, Dunbar, Grove, Tapia, Cross, Rowe and Broda2001). By 4400 cal yr BP near-modern lake levels were established, and subsequent fluctuations were far more subtle than the droughts of the mid-Holocene. The influence of humans intensified as agriculture spread over Andean landscapes. Indeed, finding lakes that were not occupied or altered by human activity in this period is a rarity.
North Atlantic forcing of climate changes in the tropical Andes has been suggested, but a mechanism for the linkage is still lacking (Urrego et al., Reference Urrego, Hooghiemstra, Rama-Corredor, Martrat, Grimalt, Thompson and Bush2016). The Medieval Climate Anomaly (MCA; 1050–850 cal yr BP) and the more recent Little Ice Age (LIA; 550–130 cal yr BP) induced precipitation changes in South American tropical systems strongly influenced by Atlantic forcing. Although being well documented in the Northern Hemisphere, the evidence for the MCA or the LIA influencing the Southern Hemisphere is not as robust (Mann and Jones, Reference Mann and Jones2003; Mann et al., Reference Mann, Zhang, Rutherford, Bradley, Hughes, Shindell, Ammann, Faluvegi and Ni2009). Prior studies suggest that the climatic responses to the MCA were highly variable across South America (Thompson et al., Reference Thompson, Mosley-Thompson, Davis, Zagorodnov, Howat, Mikhalenko and Lin2013). During the MCA, the tropical Andes experienced warmer temperatures (Ledru et al., Reference Ledru, Jomelli, Samaniego, Vuille, Hidalgo, Herrera and Ceron2013) with wetter conditions in the north and drier conditions in the south (Seager et al., Reference Seager, Burgman, Kushnir, Clement, Cook, Naik and Miller2008; Diaz et al., Reference Diaz, Trigo, Hughes, Mann, Xoplaki and Barriopedro2011; Ledru et al., Reference Ledru, Jomelli, Samaniego, Vuille, Hidalgo, Herrera and Ceron2013). A variety of high-resolution paleoecological and paleoclimatic records are in agreement that the MCA was a time of weaker monsoons with more arid conditions at the onset of the MCA and an increase in moisture as the MCA progressed (Kanner et al., Reference Kanner, Burns, Cheng, Edwards and Vuille2013; Ledru et al., Reference Ledru, Jomelli, Samaniego, Vuille, Hidalgo, Herrera and Ceron2013; Apaéstegui et al., Reference Apaéstegui, Cruz, Sifeddine, Espinoza, Guyot, Khodri and Strikis2014). Not all records, however, are in agreement and some show distinct prolonged aridity during the MCA as this was the time of the least depleted δO18 cal values at Lake Pumacocha, central Peru, of the last 2000 years (Bird et al., Reference Bird, Abbott, Vuille, Rodbell, Stansell and Rosenmeier2011).
Characterized as the most conspicuous feature in Andean ice-core records, the LIA was interpreted as a period of increased cooling and glacier expansion (Thompson et al., Reference Thompson, Mosley-Thompson, Davis, Zagorodnov, Howat, Mikhalenko and Lin2013), though it has been argued that cooling need not be invoked to explain the signal (Hastenrath et al., Reference Hastenrath, Polzin and Francou2004). A number of proxy records depict the LIA as a time of increased South American summer monsoon activity (Kanner et al., Reference Kanner, Burns, Cheng, Edwards and Vuille2013; Ledru et al., Reference Ledru, Jomelli, Samaniego, Vuille, Hidalgo, Herrera and Ceron2013; Apaéstegui et al., Reference Apaéstegui, Cruz, Sifeddine, Espinoza, Guyot, Khodri and Strikis2014) and an increase in precipitation (Thompson et al., Reference Thompson, Mosley-Thompson, Bolzan and Koci1985; Bird et al., Reference Bird, Abbott, Vuille, Rodbell, Stansell and Rosenmeier2011; Kanner et al., Reference Kanner, Burns, Cheng, Edwards and Vuille2013; Apaéstegui et al., Reference Apaéstegui, Cruz, Sifeddine, Espinoza, Guyot, Khodri and Strikis2014). It appears, however, that the LIA has two phases, a relatively wetter phase that transitioned into a drier phase around 200 cal yr BP (Thompson et al., Reference Thompson, Mosley-Thompson, Dansgaard and Grootes1986, Reference Thompson, Mosley-Thompson, Davis, Zagorodnov, Howat, Mikhalenko and Lin2013; Ledru et al., Reference Ledru, Jomelli, Samaniego, Vuille, Hidalgo, Herrera and Ceron2013).
Here we present a late-Holocene record from a lake lying at 1370 m elevation, at the transition from premontane to lower montane forest. With this new record we aim to assess if midelevation vegetation assemblages were sensitive to climate change within the context of the past 3800 cal yr BP, in particular, vegetation responses to the MCA and the LIA.
METHODS
Site description
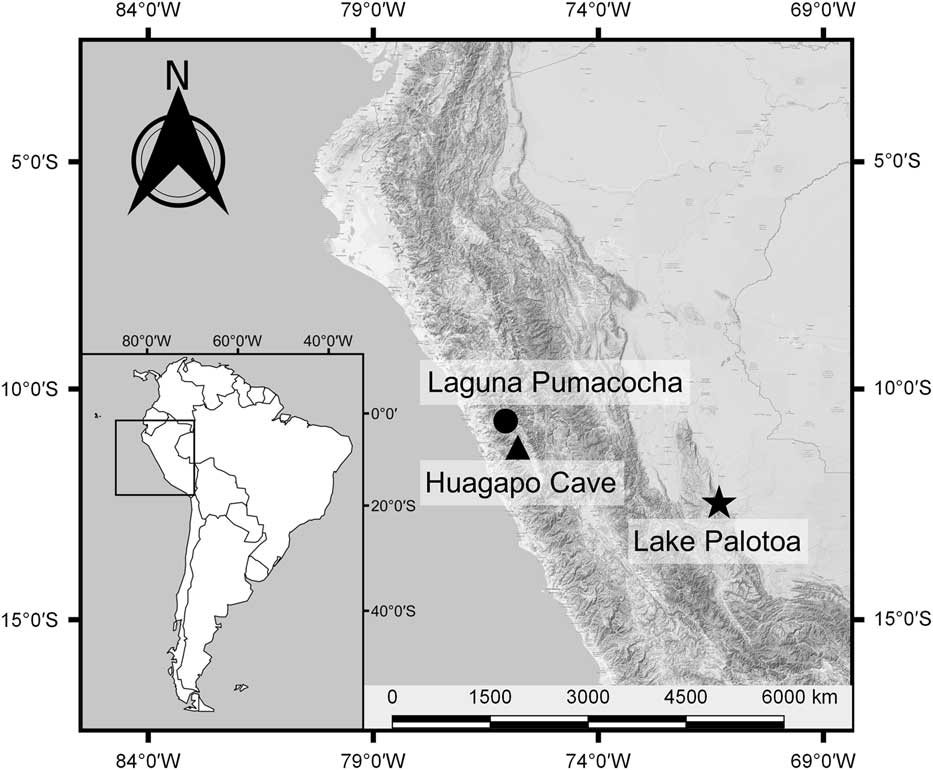
Lake Palotoa (1370 m elevation; 12°29.58′S, 71°25.14′W) is located in the eastern foothills in the Palotoa range of the Peruvian Andes and sits within a transitional elevation between premontane and lower montane forest (Fig. 1). In the nearby Kosñipata valley, peak precipitation of 5200 mm per year was recorded at 1000 m elevation, falling slightly to 5000 mm at 1500 m (Rapp and Silman, Reference Rapp and Silman2012). The lower extent of the Andean cloud forest is tightly linked to the formation of the cloud base and was found to be variable, both seasonally and elevationally, ranging between 1000 and 2300 m elevation (Webster, Reference Webster1995). Vegetational differences evident above and below 1500 m suggest ecophysiological boundaries close to this elevation (Foster, Reference Foster2001; Rapp and Silman, Reference Rapp and Silman2012).
Location map showing Lake Palotoa (12°29.58′S, 71°25.14′W) and the Callanga valley indicated by a star. The triangle represents the location of the speleothem record from Huagapo Cave (11°16.20′S, 75°47.40′W), and the circle indicates the varved lake record from Laguna Pumacocha (10°42.00′S, 76°3.60′W).

Lake Palotoa was identified on aerial imagery and subsequently visited in July 2002. The local inhabitants were semicontacted members of the Machiguenga people, who did not know of the existence of the lake. The lake lay outside their zone of exploration, approximately 10 km inland and upslope from their settlement on the banks of the Palotoa River on a poorly drained, ~1-km-wide ridgetop of the Pantiacolla range. The Pantiacolla range is the first outlying ridge of the Andes. The lake was 300 m wide by 200 m long and about 3 m deep. It appeared that the origin of the lake was a graben with a small inflowing stream at the head of the lake. The lake bed was composed of sandy sediments with the exception of organic material accumulating in the lake center. The underlying substrate was sandstone and nutrient poor. Adjacent to the lake was an undisturbed premontane forest rich in Dictyocaryum lamarckianum Mart., a stilt-rooted Andean palm. The forest showed clear evidence of cloud immersion as seen by abundant festooning bryophytes and peat-covered soils, indicating that the system is sensitive to moisture input (Pounds et al., Reference Pounds, Fogden and Campbell1999; Foster, Reference Foster2001).
Vegetation survey
Adjacent to the east side of Lake Palotoa, a 0.1-ha vegetation plot, in the style of Gentry (Reference Gentry1988), was constructed by MRS. Vegetation was recorded to the family level and, when known, to genus or species. Diameter at breast height (dbh) was recorded for stems greater than or equal to 10 cm dbh. The occurrence of stems less than 10 cm dbh was recorded without measuring diameter. Stem percent abundance was determined for all stems, and for stems ≥10 cm dbh, percent basal area was calculated.
Lake sediment collection and analysis
A 2.69-m-long sediment core was collected from the deepest point in Lake Palotoa in 2002 using a Colinvaux-Vohnout piston corer (Colinvaux et al., Reference Colinvaux, De Oliveira and Moreno1999) from a raft of inflatable boats. The corer did not reach bedrock, however, as an impenetrable layer of sand prevented further coring. Once the sediment core was sealed, it was transported to the Florida Institute of Technology and stored in the dark at 4°C.
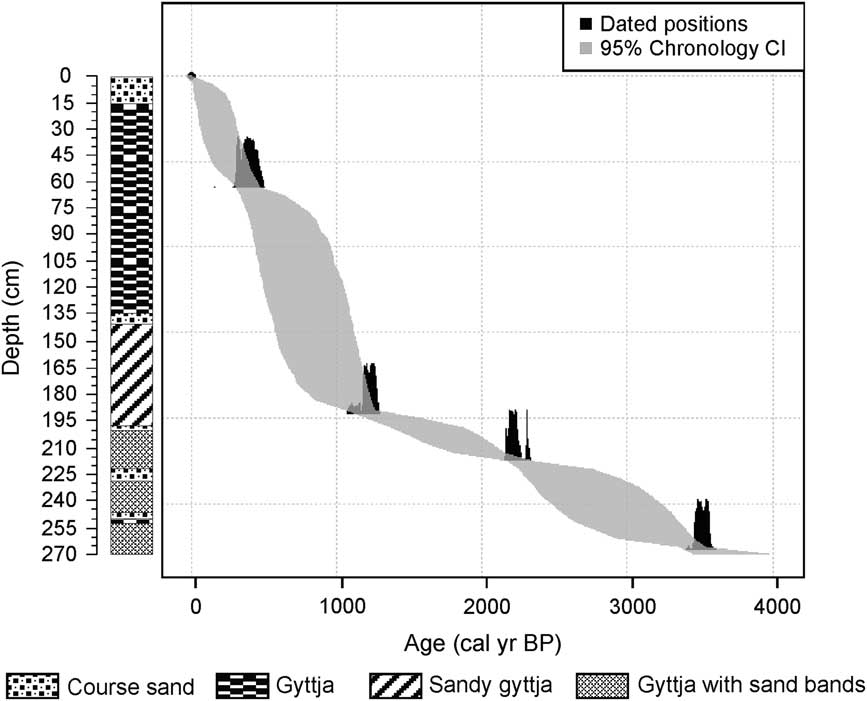
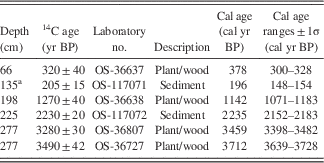
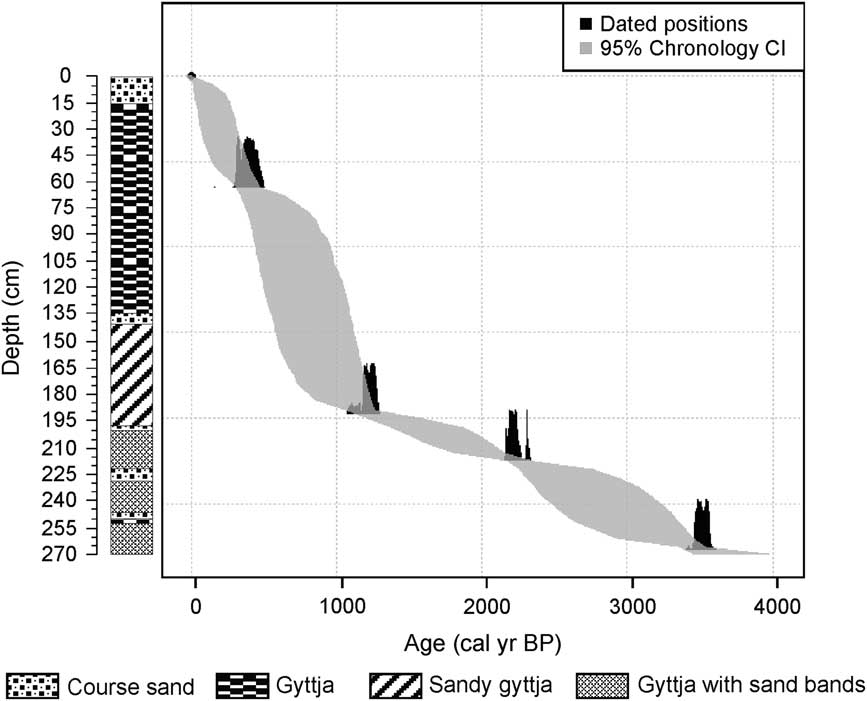
A chronology of the lake record was based on accelerator mass spectrometry (AMS; Fig. 2) 14C radiocarbon dating of six sediment samples conducted at the National Ocean Sciences AMS facility at the Woods Hole Oceanographic Institution. Ages were calibrated using CALIB 7.1 (http://radiocarbon.pa.qub.ac.uk/calib/ [accessed October 1, 2016]). Bulk and macrofossil samples collected from the same depth, 2.77 m, had similar 14C ages and were both used in the chronology. A sample taken at depth 1.35 m was omitted because it was clearly a young outlier (Table 1). The final chronology of the core was constructed based on the five accepted ages in the Bayesian tool BChron (Parnell, Reference Parnell2016). The Palotoa core was initially sampled during 2002 in even intervals of 5 cm, with the exception of one sample taken at a 4-cm interval, producing 55 sediment samples with a volume of 0.5 cm3. Samples were placed in sealed vials and stored at 4°C until the samples were processed for pollen and charcoal analysis in 2013. The core was accidentally destroyed prior to processing, preventing further sampling and description.
An age-depth model of the Lake Palotoa record produced from five radiocarbon accelerator mass spectrometry dates derived from bulk sediment samples and macrofossils. A stratigraphy diagram organized by depths illustrates changes in sediment type between course sand, gyttja, sandy gyttja, and gyttja with sand bands.
Radiocarbon accelerator mass spectrometry dates and calibrated ages for the core collected from Lake Palotoa, Peru.

a Rejected date.
All sediment samples were processed using standard pollen preparation techniques of Faegri and Iversen (Reference Faegri and Iversen1989). Each sample was spiked with 20,450 microspheres to allow calculation of pollen concentration. Pollen and spores were identified and counted using a Zeiss Axiolab photomicroscope at 400× and 630× magnification. Within each sample, a minimum of 300 terrestrial pollen grains were identified. For samples with low pollen concentration, a minimum of 2000 microspheres were counted. Because of its high abundance, Dictyocaryum grains were excluded from the 300 terrestrial pollen sum to prevent the masking of other, less common taxa.
Pollen grain identification was based on the Florida Institute of Technology Neotropical pollen reference collection, Neotropical Pollen Database (Bush and Weng, Reference Bush and Weng2007), and published pollen keys (Roubik and Moreno, Reference Roubik and Moreno1991; Colinvaux et al., Reference Colinvaux, De Oliveira and Moreno1999). Spores were classified by morphological features. Pollen percentages were calculated using the pollen sum of 300 terrestrial grains. Aquatic pollen grains and spores were counted, and percentages were excluded from the pollen sum but expressed as a proportion of it. Pollen percentage diagrams were constructed using C2 software (Juggins, Reference Juggins2014).
The record was divided into zones corresponding to shifts in the vegetation assemblages using a stratigraphically constrained cluster analysis, CONISS (Grimm, Reference Grimm1987), performed in R (R Development Core Team, 2015). Nonmetric multidimensional scaling (NMDS) (Kruskal, Reference Kruskal1964) and detrended correspondence analysis (DCA) (Hill, Reference Hill1979) were used to summarize changes in species composition through time (Kruskal, Reference Kruskal1964) and to analyze the variance between samples within notable climatic events (i.e., the MCA and the LIA). The program R (R Development Core Team, 2015) was used with the statistical packages vegan and MASS (Venables and Ripley, Reference Venables and Ripley2002; Oksanen et al., Reference Oksanen, Guillaume Blanchet, Friendly, Kindt, Legendre, McGlinn and Minchin2015) to perform these multivariate analyses. Criteria were designed to identify relevant taxa and to reduce the influence of rare taxa. Elements that accounted for at least 2% of the pollen sum or occurred in five or more samples were included in the analysis (after Birks and Gordon, Reference Birks and Gordon1985).
Because of our inability to revisit the core, samples processed for pollen analysis were also analyzed for their charcoal content. An analysis of charcoal presence and abundance was conducted following the protocol of Clark (Reference Clark1982). Charcoal was absent from all 55 samples from the sediment core so no additional analyses were required.
Graphical representation of vegetation changes
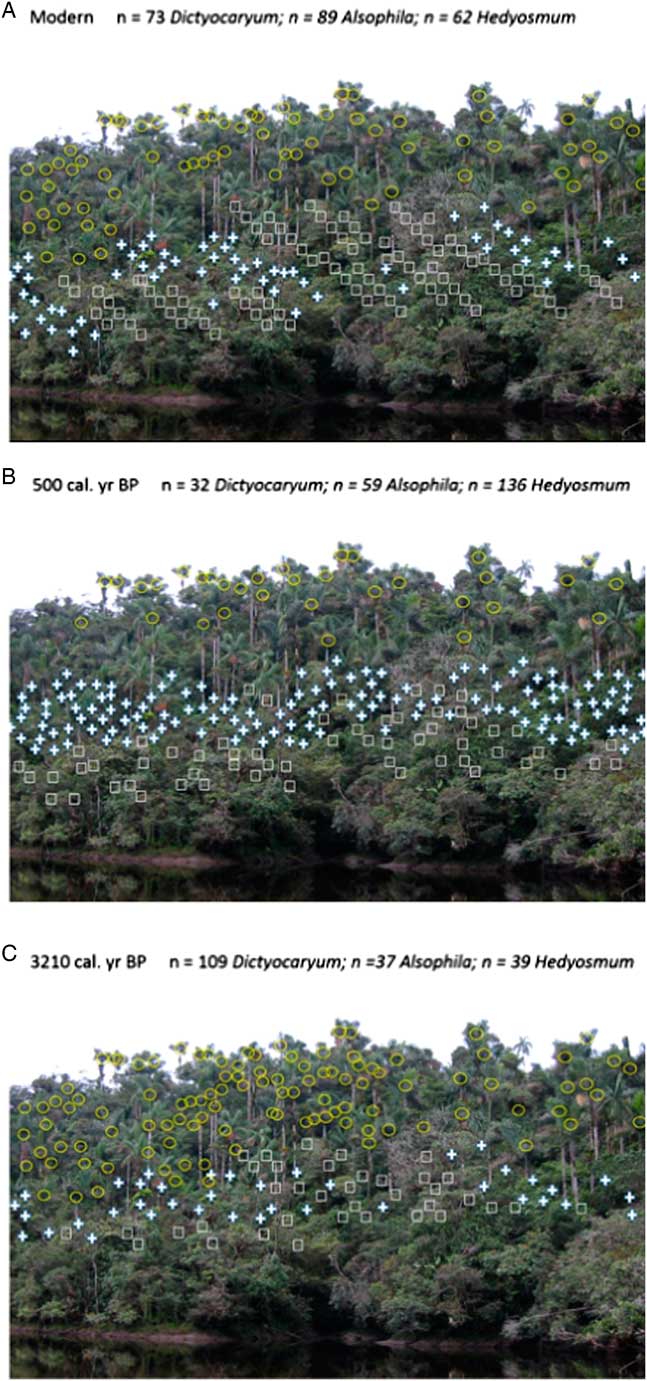
Pollen abundances derived from the Lake Palotoa record were weighted using stem abundances determined by the adjacent vegetation plot to produce a graphical representation of vegetation change through time. This analysis provided an illustrative representation of possible structural changes to the local forest surrounding the lake. Three time slices were chosen (representing 3210 cal yr BP, 500 cal yr BP, and modern) to capture the broad shift in pollen abundances within the pollen record. Weighting factors (x (s,t)) for the dominant pollen and spore types in the tree plot—Dictyocaryum, Hedyosmum, and Cyathea cf. Alsophila (hereafter Cyathea)—were established using modern species representation compared with pollen percent defined as pol(s,t) (where s=species and t=time slice). The weight was determined such that at each time slice, pol(s,t) x (s,t) would yield the number of stems represented in the plot.
A photograph of the forest adjacent to Lake Palotoa was used as a backdrop for graphical representation, illustrating how the vegetation assemblages changed. Unique symbols were assigned to the photograph based on their modern relative abundances as scaled to the abundance of Dictyocaryum in the photograph. To represent the number of Dictyocaryum, Hedyosmum, and Cyathea stems in previous time slices, the weighting factors corresponding to each taxon were scaled to the number of stems represented in the picture. On this basis, past stem abundances determined by the weighting factors were multiplied by 2.7. Symbols corresponding to each of the dominant taxa were then overlaid onto the photograph for each time slice.
RESULTS
Vegetation survey
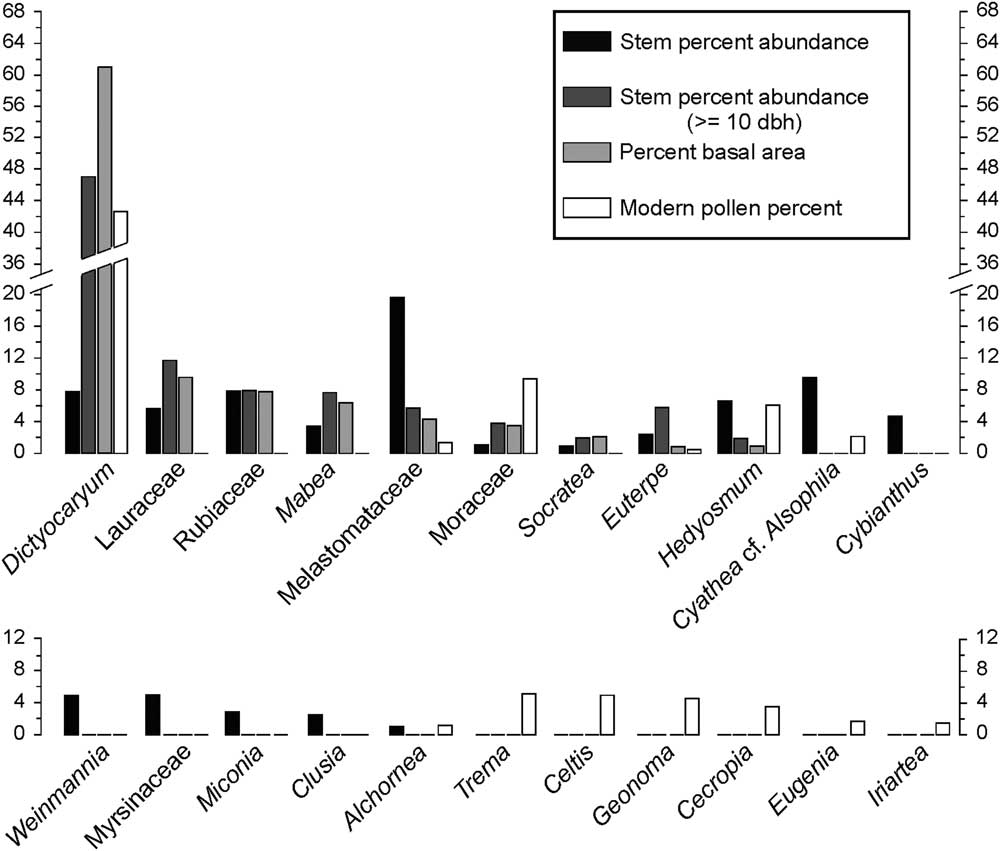
A total of 51 stems were large enough to be included in the dbh record, including Dictyocaryum, Euterpe, Hedyosmum, Lauraceae, Mabea, Melastomataceae, Moraceae, Rubiaceae, and Socratea. The most abundant taxon >10 cm dbh was Dictyocaryum with 24 individuals, accounting for 47% of stems measured. Dictyocaryum composed 61.1% of the total basal area, while Lauraceae was the second most abundant in stem number and basal area, with 6 individuals and 9.7% of the total basal area (Fig. 3). Rubiaceae had a stem abundance of 7.8% and was also 7.8% of the basal area. Hedyosmum made up only 2.0% of the measurable stems in the plot and was less than 1% of the total basal area (Fig. 3).
The relative abundance of plants encountered in the 0.1-ha vegetation plot. Stem percent abundance, percent abundance of stems greater than or equal to 10 cm diameter at breast height (dbh), percent basal area, and modern pollen percent for the 20 most common taxa within both the vegetation plot and the modern pollen record from Lake Palotoa are shown. Some pollen grains are nearly indistinguishable, with confidence, at the genus level, and therefore, some of the 20 most common taxa groups were grouped to the family level producing a total of 22 taxa illustrated in the figure.
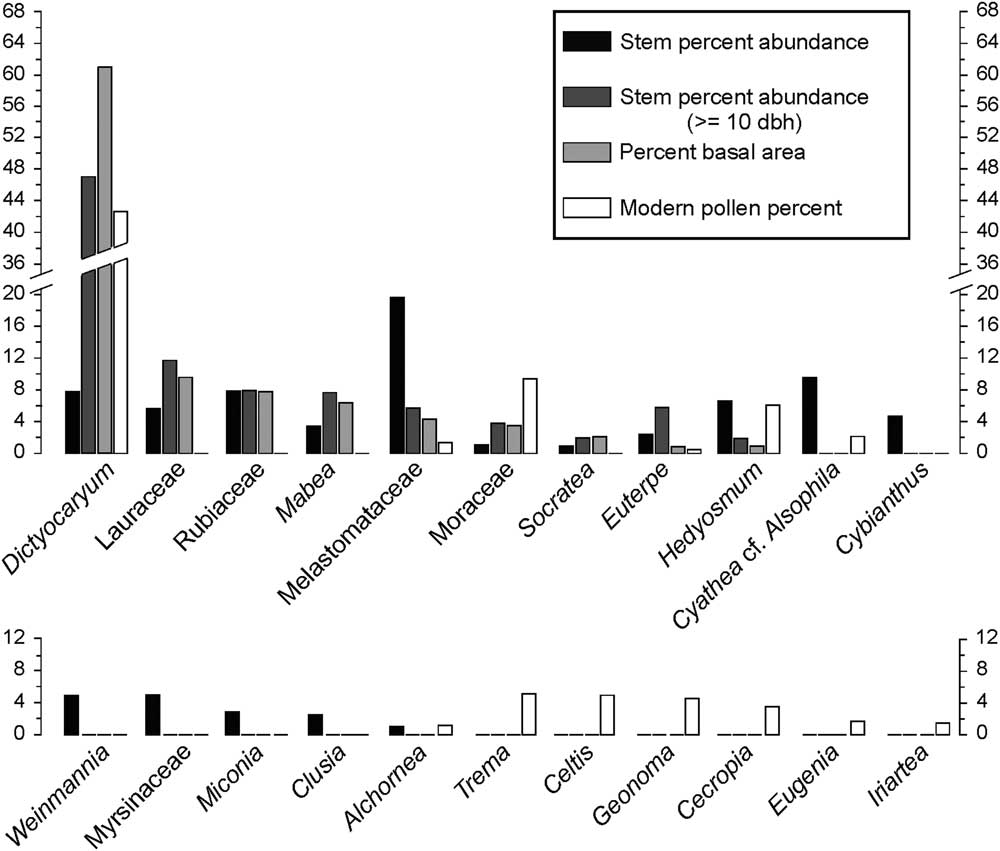
Of the total 347 stems that were recorded within the 0.1-ha vegetation plot, 127 were identified to the family level, 177 to the genus level, and 30 to the species level, and 13 stems could not be identified. Melastomataceae was the most common stem making up about 20% of the plot with 68 individuals. Other common taxa included Cyathea with 33 stems (9.5%), Dictyocaryum and Rubiaceae each with 27 stems (7.8%), Hedyosmum with 23 stems (6.6%), and Lauraceae with 20 stems (5.8%) (Fig. 3).
Sedimentation rates and temporal resolution
Three distinct periods with differing rates of sediment deposition were identified. Thus, despite the even 5cm intersample interval, the temporal difference between samples ranged considerably. Between 3800 and 2240 cal yr BP, the depositional rate averaged 0.4 mm per year, with a temporal resolution average of 121 yr between samples. Between 2240 and 1250 cal yr BP, the sedimentation rate decreased to 0.3 mm per year resulting in an average of 196 yr between samples. Post-1250calyrBP, the sedimentation rate increased to 1.7 mm per year, with a corresponding 33 years between samples for the remainder of the record.
Pollen and charcoal analysis
Pollen analysis yielded about 100 different identified terrestrial pollen types, 1 taxon of aquatic pollen, and 18 unknown pollen types. The criteria, used to reduce the effects of rare elements on the statistical analysis, led to 67 pollen taxa being used in the statistical analysis. Charcoal analysis following Clark (Reference Clark1982) determined an absence of detectable fire events, indicated by the lack of charcoal throughout the record.
An initial attempt to provide the Palotoa record with zonation using CONISS (Grimm, Reference Grimm1987) was completely dominated by the abundance of Dictyocaryum. Removing Dictyocaryum produced three primary zones labeled zone PAL-1 to zone PAL-3 (Supplementary Fig. 1A).
Zone PAL-1 (3800–1160 cal yr BP; 2.69–1.85 m)
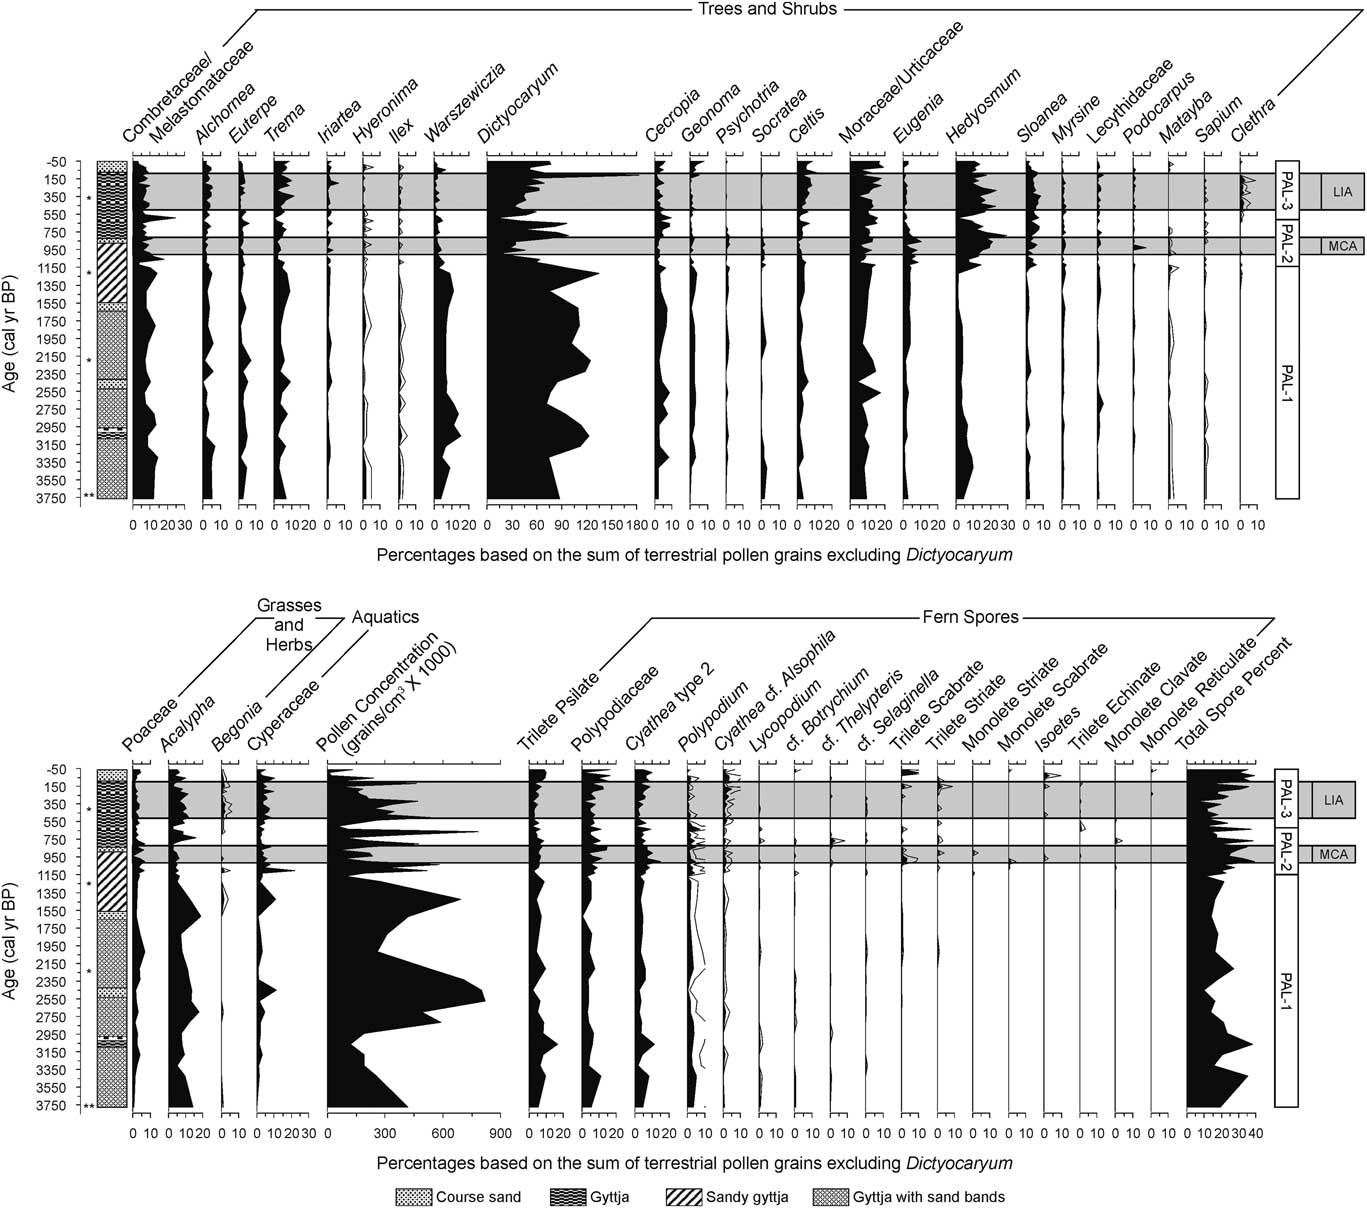
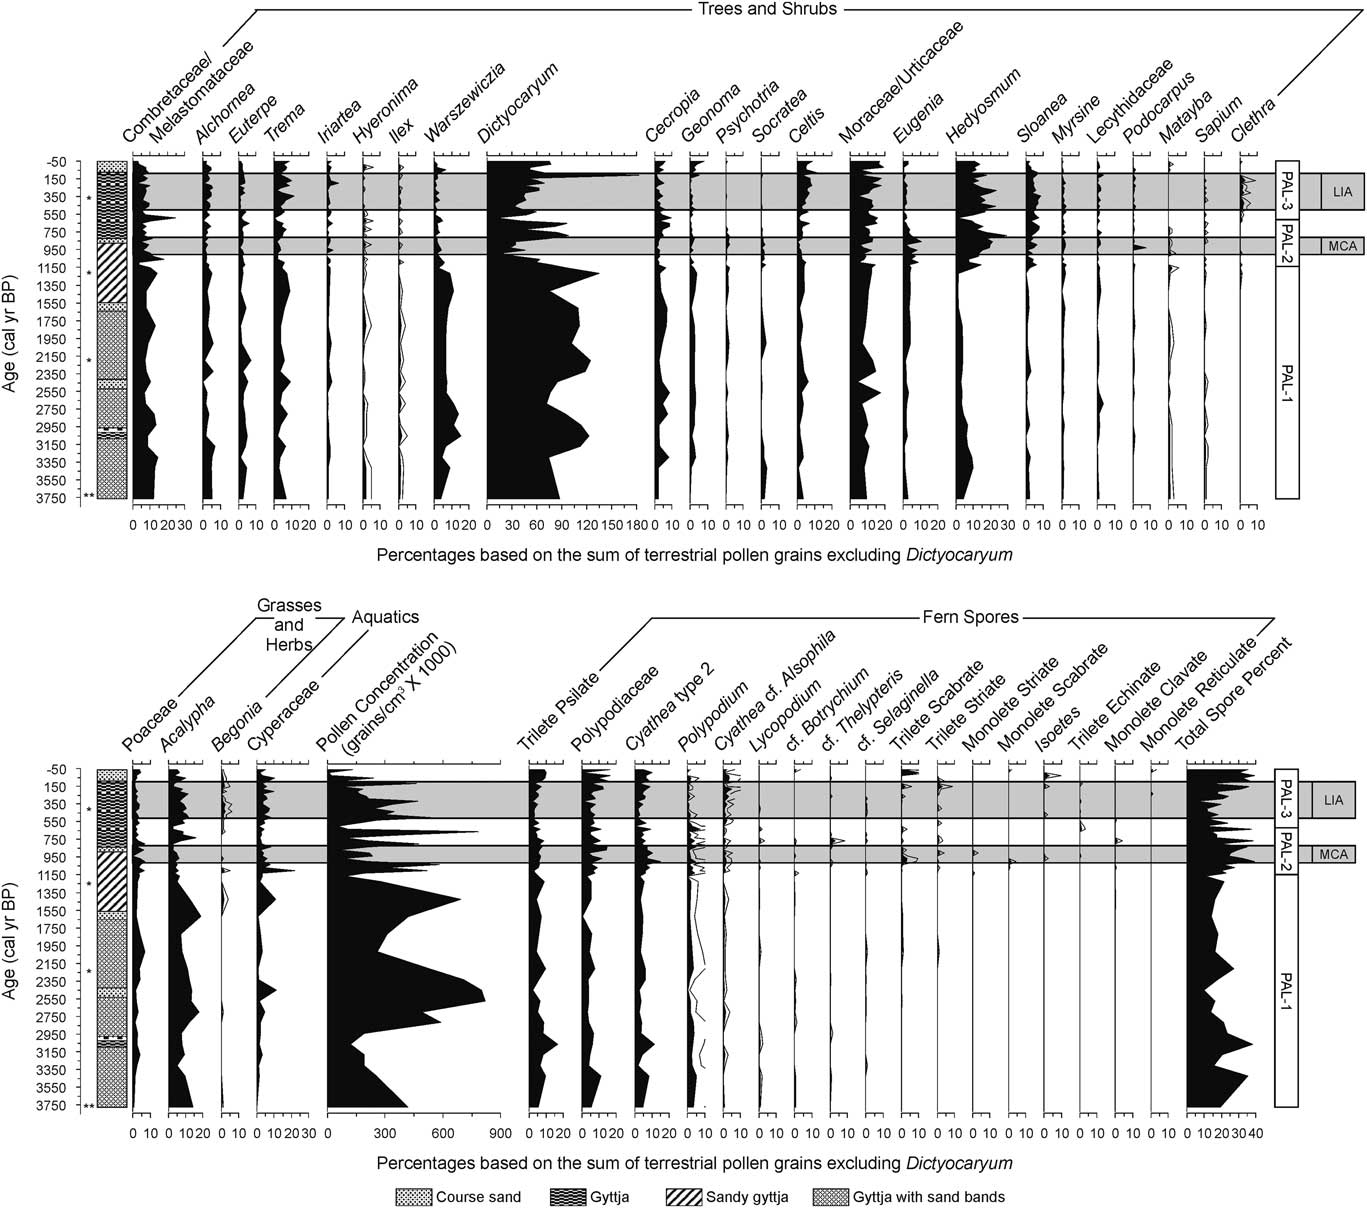
Pollen concentration reached its highest value within the record, 820,000 grains/cm3 at 2600 cal yr BP, with the lowest concentration of the zone being 90,000 grains/cm3. Zone PAL-1 was characterized by high average abundances of Dictyocaryum pollen, 71% to 135%, with a mean of 95% of the pollen sum that excluded Dictyocaryum and aquatic taxa (Fig. 4). Common taxa of lowland environments that were also abundant in the pollen spectra included Acalypha, Warszewiczia, Moraceae/Urticaceae, and Combretaceae/Melastomataceae. Acalypha and Warszewiczia reached their highest percentages of the record, 15% and 18%, respectively (Fig. 4). Cyathea represented between 0% and 1% of the total pollen sum and was absent in 6 of the 19 samples that fell within zone PAL-1. The period leading up to the next zonation, occurring between 1250 and 1160 cal yr BP, indicated a lack of Cyathea spores. Charcoal was not recorded.
Summary pollen diagram from Lake Palotoa that emphasizes taxa used to express vegetational responses to climate change. Taxa are grouped into four categories: trees and shrubs, grasses and herbs, aquatics, and fern spores. The gray horizontal panels indicate the time periods described for the Medieval Climate Anomaly (MCA) and the Little Ice Age (LIA) by Bird et al. (Reference Bird, Abbott, Vuille, Rodbell, Stansell and Rosenmeier2011). A stratigraphy diagram structured by age illustrates the changes in sediment characteristics. The asterisks to the right of the y-axis signify the depths at which samples were taken for radiocarbon accelerator mass spectrometry dating. Zonation determined by CONISS is indicated in the horizontal rectangle on the right of the diagram. The zones are labeled PAL-1, PAL-2, and PAL-3.
Zone PAL-2 (1160–650 cal yr BP; 1.85–1.05 m)
Pollen concentrations oscillated from relatively low to relatively high values almost every 100 yr throughout this period. The peak concentration value in this zone of 786,000 grains/cm3 was reached at 700 cal yr BP. Zone PAL-2 was defined by lower Dictyocaryum pollen percentages compared with the previous zone, with values as low as 15% at 1030 cal yr BP. Dictyocaryum increased to 98% of the total pollen sum before declining to 40% at the end of the zone. Warszewiczia declined in abundance compared with the previous zone; whereas, other elements, such as Sloanea and Socratea, increased during this period (Fig. 4). Acalypha declined to 3% before increasing to its highest value of 16% at 760 cal yr BP. Hedyosmum also increased to its highest value of 29% at 830 cal yr BP before declining to 9% of the pollen sum at the end of the zone (Fig. 4). Moraceae/Urticaceae and Combretaceae/Melastomataceae remained abundant throughout the entirety of the core. At the initiation of this zone, Cyathea represented 1% of the total pollen sum. Cyathea increased to 2% at 930 cal yr BP before declining to less than 1% at 660 cal yr BP. Total spore representation achieved its highest value of the core, 39%, at 1030 cal yr BP, coinciding with very low pollen concentrations. Charcoal was not recorded.
Zone PAL-3 (650 cal yr BP to modern; 1.05–0 m)
A second decline in Dictyocaryum pollen abundance occurred at 630 cal yr BP, as this palm fell to its lowest values of the entire record (10%; Fig. 4). Thereafter, Dictyocaryum rebounded increasing to 75% in the surface sample. An anomalous spike of Dictyocaryum to 183% occurred at 120calyrBP (Fig. 4). This extraordinarily high value was excluded from statistical analysis, as it probably represented direct input of anthers and appeared to be a true anomaly. For statistical purposes, a mean of the Dictyocaryum abundance in the two adjacent values was used to replace the outlier.
Pollen concentration oscillated in this period similar to zone PAL-2. Concentration started low and gradually increased to 540,000 grains/cm3 at 530calyrBP before declining to the lowest value within the record of 7000 grains/cm3 in the uppermost, least consolidated samples (25 cal yr BP). During this zone, Hedyosmum and Celtis started to increase in abundance, and Trema, Sloanea, Combretaceae/Melastomataceae, and Moraceae/Urticaceae remained abundant. Cyathea increased during this time to its highest value of 5% at 210 cal yr BP before declining to a modern level of 2%. Iriartea, Ilex, Geonoma, Myrsine, Podocarpus, Lecythidaceae, and Sapium experienced little notable change throughout the entirety of the record (Fig. 4). Charcoal was not recorded.
Ordination of fossil pollen data
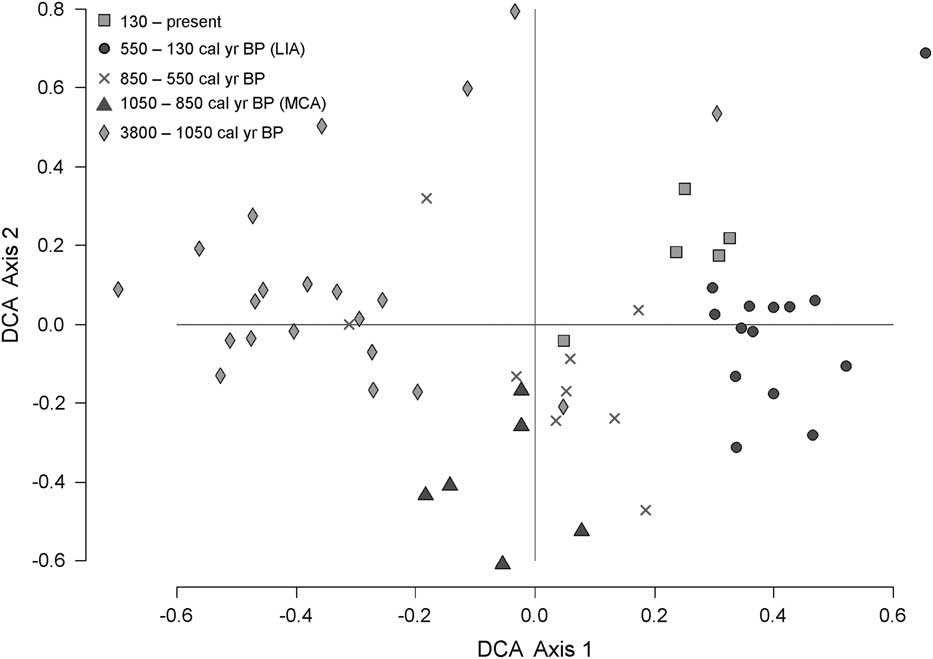
NMDS was applied to the data, but stress test scores were unacceptably high (McCune and Grace, Reference McCune and Grace2002). The DCA produced an ordination with relatively short axes (<1 standard deviation of species turnover) (Fig. 5). The eigenvalues of the axes (axis 1=0.1017; axis 2=0.0745; axis 3=0.0567; axis 4=0.0492) were low, suggesting that there was not a very strong environmental driving gradient reflected in this history. The species characterizing the positive extreme of axis 1 were Clethra, Begonia, and Weinmannia, whereas those of the negative extreme were Alternanthera, Chenopodium, Paullinia, and Warszewiczia. In the plot of sample scores (Fig. 5), PAL-1 samples had negative values on DCA axis 1, while zone PAL-2 formed a transition from negative to positive that ended with mainly positive scores. Sample scores for PAL-3 were almost wholly negative in their distribution. Axis 2 produced a separation of Anthurium, Prestoea, Mauritia, and Piper at the positive extreme, and Malvaceae and Podocarpus at the negative extreme. When sample scores were plotted as axis 1 versus axis 2, both the LIA and the MCA samples had predominantly negative values on axis 2 but were separated from each other on axis 1 (Fig. 5).
Detrended correspondence analysis (DCA) ordination for Lake Palotoa. Light-gray diamonds represent the period between 3550 and 1050 cal yr BP, dark-gray triangles represent the Medieval Climate Anomaly (MCA; 1050–850 cal yr BP), the light-gray crosses represent the period between 850 and 550 cal yr BP, dark-gray circles represents the Little Ice Age (LIA; 550–130 cal yr BP), and the light-gray squares represent the last 130 years of the record. The MCA and the LIA tend to cluster as discrete groups within the context of the past 3800 yr.

DISCUSSION
Lake Palotoa was something of an Andean rarity, a lake apparently unknown to modern inhabitants of the region; its pollen record also showed no sign of past human occupation. The lack of charcoal and crop pollen throughout the record suggested that the changes observed in pollen percentages were most likely a direct response to climate. This finding allowed a rare opportunity to gain insight into the responses of Andean cloud forest communities to changing climate.
Vegetation survey and modern pollen representation
It is quite uncommon to have vegetation plot data adjacent to an Andean lake with a fossil pollen record. At Palotoa, the 0.1-ha plot provides an opportunity to assess how local vegetation communities are represented in modern pollen samples from the uppermost layer of lake sediment. Dictyocaryum was the most abundant large-stemmed taxon, comprising 61% of the basal area within the plot. Modern pollen samples reflected this in the pollen sum, as Dictyocaryum constituted 43% of terrestrial pollen grains identified (Fig. 3). Dictyocaryum is a sequentially monoecious tree that is pollinated by a wide variety of bees (Henderson, Reference Henderson1990). Such floral and pollination characteristics lend themselves to robust but not excessive representation in the pollen record (Bush, Reference Bush1995). The proportions of Dictyocaryum pollen in the fossil record should provide a good approximation of the abundance of this species through time.
Euterpe, a common lowland palm that extends into middle elevations in the Andes, represented 6% of stems greater than 10 cm dbh and produced 0.6% of the modern pollen sum. Euterpe, although having the floral characteristics that should result in good representation in pollen records, is routinely underrepresented in lowland pollen records. Other Amazonian palms (e.g., Geonoma and Iriartea), however, were found at low densities in the pollen spectrum but were not found in the 0.1-ha plot. Although these genera may have been present but undocumented in the forest around the lake, they could also represent upslope transport from nearby (<1 km) populations. Hedyosmum often grows as a multiple-trunked shrub with slender stems. In the 0.1-ha plot, Hedyosmum and Dictyocaryum were roughly equal in stem number, but the much larger stems and, by inference, canopy of Dictyocaryum meant that Hedyosmum only accounted for 11% of the total terrestrial pollen sum. Melastomataceae was the most abundant stem; however, no stem was >10 cm dbh, and it only represented 2% of the modern pollen sum (Fig. 3). Cyathea, a tree fern, was the second most abundant taxon; however, the extent of its abundance was not reflected in the modern spore abundance as it only represented 2% of the modern pollen sum.
Dictyocaryum and community stability
The first observation from the fossil record is that Dictyocaryum is a consistent and long-term dominant at this site. D. lamarckianum is a monospecific genus that was once included within Iriartea but was recognized to be phylogenetically distinct from its closest relative, Iriartea deltoidea Ruíz & Pavón. These two palms are similar in physiognomy; however, their ecology is quite different, as Dictyocaryum is more tolerant to cloud immersion, locally replacing Iriartea above 1400 m elevation. Both species can exist in high densities, with Iriartea recognized as being the commonest stem in western Amazonian floodplain forests and an Amazonian hyperdominant (Pitman et al. Reference Pitman, Terborgh, Silman, Núñez, Neill, Cerón, Palacios and Aulestia2001; Silman et al., Reference Silman, Araujo-Murakami, Urrego, Bush and Pariamo2006; ter Steege et al. Reference ter Steege, Pitman, Sabatier, Baraloto, Salomão, Guevara and Phillips2013). Dictyocaryum is known to be locally abundant, often forming dense stands where it occurs, but is absent from considerable areas of apparently suitable habitat (Henderson, Reference Henderson1990).
At Palotoa, the stem densities of Dictyocaryum, 270 per hectare, are two to three times that of Iriartea densities in the floodplains of Manu (Pitman et al., 2001). Notably, Dictyocaryum stems form 61% of the basal area of the forest, whereas Iriartea is typically 6% of the basal area in lowland forest (Pitman et al., Reference Pitman, Terborgh, Silman, Núñez, Neill, Cerón, Palacios and Aulestia2001). The low biomass, few large trees, and high stem densities observed at Palotoa has been observed at other sites with nutrient poor soils and high cloud immersion (Malhi et al., Reference Malhi, Girardin, Goldsmith, Doughty, Salinas, Metcalfe and Huasco2017). This pattern, however, may not be true for all forests at this elevation, as sites with rich and well-drained soils have shown smaller stems with higher densities.
A striking feature of the Palotoa record is that even though Dictyocaryum abundance fluctuated throughout the last 3800 yr, it was, in all but one sample, the commonest pollen type. In nearly half of the samples counted, Dictyocaryum represented more than 40% of all pollen grains encountered. Iriartea has been argued to have increased in abundance across sites in the last 3000 yr (Bush and McMichael, Reference Bush and McMichael2016), but no lowland record has yielded such a singular or long-term dominance by Iriartea as that of Dictyocaryum at Lake Palotoa.
Lake Consuelo, located in Bolivia, lies at an elevation of 1360 m (Urrego et al., Reference Urrego, Bush and Silman2010), similar to that of Lake Palotoa. Both lakes are immersed in ground-level clouds; however, the forest structures are quite different. For instance, the pollen data from Lake Palotoa exhibit lower diversity than that of Consuelo. Furthermore, the dominant species at Palotoa, Dictyocaryum lamarckianum, represents less than 5% of the pollen sum at Lake Consuelo. Hedyosmum and Cyathea are present at both settings and tend to increase and decrease in tandem, but there is no evidence of between-site synchrony in these changes.
Vegetation responses to climate change
Schimmelmann et al. (Reference Schimmelmann, Lange and Meggers2003) suggested that there was a recurrent 200-yr cycle evident in archaeological and paleoclimatic data from the Amazon and the Andes. The quasi-200-yr Suess–De Vries cycle detected in cosmogenic isotopic data is thought to have been driven by intense solar cycles (Suess, Reference Suess1980; Sonett and Suess, Reference Sonett and Suess1984; Braun et al., Reference Braun, Christl, Rahmstorf, Ganopolski, Mangini, Kubatzki, Roth and Kromer2005). Solar minima, such as the Wolf, Spörer, and Maunder, form part of this pattern over the past few millennia (Raspopov et al., Reference Raspopov, Dergachev, Esper, Kozyreva, Frank, Ogurtsov, Kolström and Shao2008). These cycles have been implicated in Central American hydrologic change (Hodell et al., Reference Hodell, Brenner, Curtis and Guilderson2001) and Amazonian fires (Bush et al., Reference Bush, Silman, McMichael and Saatchi2008).
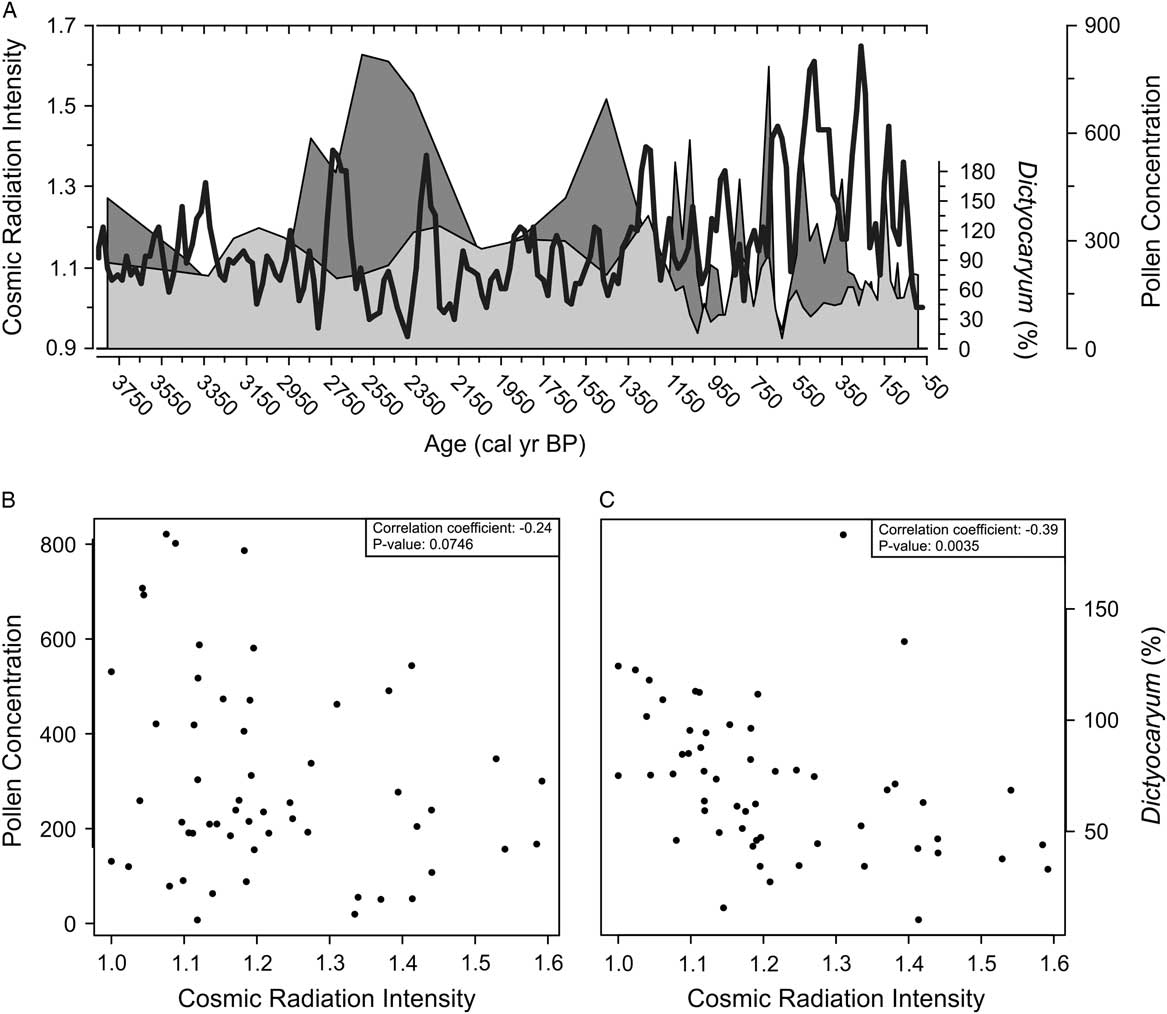
The pollen concentration data from Palotoa had distinct peaks and troughs that appeared to coincide with the solar minima of the last 400 years (Fig. 6A). When the entire data set was analyzed, the relationship between pollen concentration and cosmic radiation was not statistically significant (Fig. 6B). The relationship between Dictyocaryum percentage abundance and cosmic radiation, however, was significant (Fig. 6C). We do not contend that short-lived patterns can be explained through this analysis, but larger trends are worth further investigation. There has been an increase in cosmic radiation since 1200 cal yr BP and further increase in radiation maxima since 650 cal yr BP. The overall zonation of the pollen diagram identifies the strongest changes in pollen assemblages as occurring at 1150 and 650 cal yr BP, closely corresponding to the observed changes in radiation. It is probable that if solar insolation were the ultimate cause underlying the observed changes in assemblages, the proximate influence would have been feedback mechanisms inducing changes in seasonality or cloudiness.
In panel A, pollen concentration (grains/cm3×1000) and Dictyocaryum pollen percent from Lake Palotoa is plotted relative to cosmic radiation intensity (from Steinhilber et al., Reference Steinhilber, Abreu, Beer, Brunner, Christl, Fischer and Heikkila2012). The gray shading represents pollen concentration, the light-gray shading represents Dictyocaryum pollen percent, and the cosmic radiation intensity is the superimposed black line. Pollen concentration and Dictyocaryum pollen percent are plotted against cosmic radiation intensity in panel B and panel C, respectively.

Early vegetation assemblage stability in the pollen record
Despite dating back to 3800 cal yr BP, it is likely that Lake Palotoa is much older. During coring, bedrock was never reached as a layer of sand prevented further extraction. This layer coincides with the end of the mid-Holocene drought and could be caused by seasonal streams carrying sand into the depression as the lake level dropped. During the mid-Holocene drought, lake levels at Titicaca dropped by 80 m (Seltzer et al., Reference Seltzer, Baker, Cross, Dunbar and Fritz1998), while Lake Consuelo experienced a decline in lake surface area and in water depth between 7400 and 5000 cal yr BP (Urrego et al., Reference Urrego, Bush and Silman2010). It is likely that this drought induced Lake Palotoa to dry out, with unknown consequences on the adjacent forest.
Since the formation of the present lake, around 3800 cal yr BP, the surrounding vegetation assemblages have remained largely stable. Notable assemblage shifts first occurred during the transition into the MCA around 1160 cal yr BP. Prior to this transition, however, many of the major components (e.g., Combretaceae/Melastomataceae, Moraceae/Urticaceae, Warszewiczia, Dictyocaryum, and Trema) demonstrated little variation. Indeed, the only distinguishable trend is an incremental decline of Hedyosmum after 3330 cal yr BP until Hedyosmum increased in abundance around 1160 cal yr BP. Dictyocaryum remained the dominant taxon throughout the record but experienced some of its highest abundances during zone PAL-1.
The second most abundant stem in the adjacent vegetation plot, Cyathea, had low values prior to 1160 cal yr BP before increasing to modern levels thereafter. A subtle, but perhaps notable transition in Cyathea abundance from 0% to 2% occurred near the onset of the MCA. Prior to 1160 cal yr BP, Cyathea had an average abundance of less than 1% (0.4%) and then increased to an average abundance of 1% of the pollen sum for the remainder of the record. Cyathea transitioned to higher percentages after 1160 cal yr BP, whereas Dictyocaryum declined from 98% to 57%. The rise of Cyathea spore abundance during the decline of Dictyocaryum may reflect a response to a reduction in canopy cover. Some Cyathea tree fern species have been shown to produce more spores in open-canopy than in closed-canopy habitats (Arens, Reference Arens2001). It is more likely, however, that Cyathea is responding to changes in moisture balance, perhaps a change in soil drainage or cloud immersion.
The MCA
The MCA was a global event that manifests itself in a diversity of anomalous climates with peak events occurring at different times (Graham et al., Reference Graham, Ammann, Fleitmann, Cobb and Luterbacher2011). Records from South America placed the MCA between 1150 and 550 cal yr BP, although the initiation and termination varied (Ledru et al., Reference Ledru, Jomelli, Samaniego, Vuille, Hidalgo, Herrera and Ceron2013; Stansell et al., Reference Stansell, Rodbell, Abbott and Mark2013; Thompson et al., Reference Thompson, Mosley-Thompson, Davis, Zagorodnov, Howat, Mikhalenko and Lin2013; Apaéstegui et al., Reference Apaéstegui, Cruz, Sifeddine, Espinoza, Guyot, Khodri and Strikis2014).
At Lake Palotoa, a marked increase in the rate of sedimentation accompanied this transition and was consistent with wetter climates and increased runoff causing more erosion. The statistical analyses of fossil pollen data from Lake Palotoa indicated a distinct MCA signal. CONISS highlighted a shift in vegetation assemblages around the onset of the MCA as the first division that separated zone PAL-1 from PAL-2. PAL-1 defined the time period before the MCA, whereas PAL-2 encompassed the MCA. Within this period, Lake Palotoa experienced a notable change in the pollen spectrum as Dictyocaryum and Warszewiczia declined and Hedyosmum, Eugenia, Sloanea, and Cyathea increased. Dictyocaryum reached one of its lowest values (15%) around 1030 cal yr BP but increased thereafter, a pattern broadly tracked by Hedyosmum as it rose from 1% to 19%. Other taxa, such as Alchornea, Trema, Celtis, and Moraceae/Urticaceae, exhibited a decline in pollen percentages during the MCA but recovered thereafter.
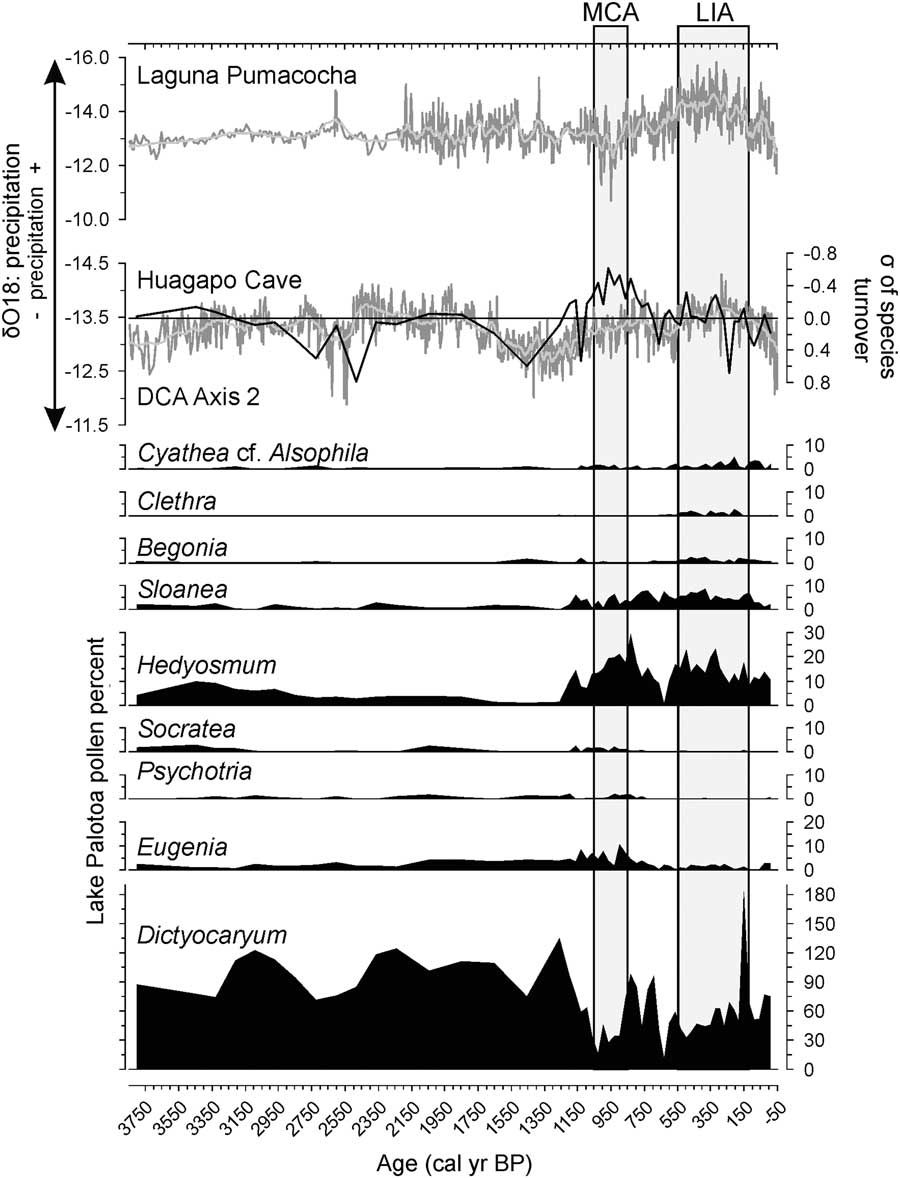
Ecologically, Hedyosmum and Sloanea are both characteristic of poorly drained locations or wetlands (Woodson et al., Reference Woodson, Schery and Smith1965; Todzia, Reference Todzia1988; Smith, Reference Smith1996; Ellison, Reference Ellison2004). The rise in pollen percentages of these taxa may reflect increasing levels of precipitation during the MCA. This suggestion would concur with a number of paleoecological records from the tropical Andes that found the onset of the MCA was marked by a dry event followed by increased moisture availability (Kanner et al., Reference Kanner, Burns, Cheng, Edwards and Vuille2013; Ledru et al., Reference Ledru, Jomelli, Samaniego, Vuille, Hidalgo, Herrera and Ceron2013; Apaéstegui et al., Reference Apaéstegui, Cruz, Sifeddine, Espinoza, Guyot, Khodri and Strikis2014). Indeed, the relative precipitation described by the δO18 ratios from the Huagapo Cave speleothem record (Kanner et al., Reference Kanner, Burns, Cheng, Edwards and Vuille2013) closely resembles DCA axis 2 in the Palotoa vegetation record (Fig. 7). The more depleted (wetter) δO18 ratios found during the MCA were not exclusive to this period; an abrupt transition from dry to wet climates at 2400 cal yr BP is also evident in the vegetation response, but there was not the shift to Hedyosmum and Sloanea similar to that observed at 1130calyrBP. The different vegetation outcomes may reflect changes in seasonality, whereas the isotopic record may be reflecting total precipitation (Fig. 7). If, for example, the wet event of 2400 cal yr BP was largely attributable to wetter wet seasons, there might be very little additional vegetation response as water is not limiting for those months. If, however, the change during the MCA resulted in a less extreme dry season, or even just more cloud development in the dry season, the effect on vegetation could be substantial.
Select taxa from the Palotoa record are plotted alongside the Detrended correspondence analysis (DCA) axis 2 scores and the δO18 values from a speleothem record from Huagapo Cave (Kanner et al., Reference Kanner, Burns, Cheng, Edwards and Vuille2013) and a lake varve record from Laguna Pumacocha (Bird et al., Reference Bird, Abbott, Vuille, Rodbell, Stansell and Rosenmeier2011). The δO18 values represent changes in precipitation; lower δO18 values indicate an increase in precipitation, whereas higher values indicate lower amounts of moisture input. The Medieval Climate Anomaly (MCA) and the Little Ice Age (LIA), as described by Bird et al. (Reference Bird, Abbott, Vuille, Rodbell, Stansell and Rosenmeier2011), are indicated by labeled vertical boxes.

The samples that were deposited between the MCA and the LIA from 650 to 550 cal yr BP were poor in Dictyocaryum, Eugenia, and Acalypha, but rich in Cecropia, Euterpe, and Combretaceae/Melastomataceae. These data could represent an increase in forest disturbance and an increase in open areas. Cecropia and Combretaceae/Melastomataceae pollen percentages peak during this period as these taxa take advantage of gaps in the canopy. This signal may suggest a marked drying/warming event; however, higher resolution sampling would be required to determine this. Support for a marked dry event at this time can be found at Lake Wiñaymarka in Bolivia, where a prolonged dry period occurred from 850 to 550 cal yr BP (Binford et al., Reference Binford, Kolata, Brenner, Janusek, Seddon, Abbott and Curtis1997).
The LIA
Much like the MCA, a broad range of dates have been ascribed to the LIA—that is, from 600 to 80 cal yr BP (Bird et al., Reference Bird, Abbott, Vuille, Rodbell, Stansell and Rosenmeier2011; Kanner et al., Reference Kanner, Burns, Cheng, Edwards and Vuille2013; Ledru et al., Reference Ledru, Jomelli, Samaniego, Vuille, Hidalgo, Herrera and Ceron2013; Stansell et al., Reference Stansell, Rodbell, Abbott and Mark2013; Thompson et al., Reference Thompson, Mosley-Thompson, Davis, Zagorodnov, Howat, Mikhalenko and Lin2013; Apaéstegui et al., Reference Apaéstegui, Cruz, Sifeddine, Espinoza, Guyot, Khodri and Strikis2014). Here we follow Bird et al. (Reference Bird, Abbott, Vuille, Rodbell, Stansell and Rosenmeier2011) and define the LIA as being from 550 to 130 cal yr BP.
At Lake Palotoa, the flora represented during the LIA is similar to that of the late stages of the MCA. Hyeronima and Matayba decline during the LIA but recover to modern levels thereafter. An increase in Hedyosmum pollen percentages from less than 1% to 23% corresponds to an increase in precipitation in the Huagapo speleothem record (Kanner et al., Reference Kanner, Burns, Cheng, Edwards and Vuille2013) (Fig. 7). A further indication of increased precipitation is the increase of Sloanea during the LIA interval, as Sloanea is a taxon that typically occurs in wet environments. Dictyocaryum, a premontane Andean palm that inhabits well-drained soils, has an inverse response to that of Hedyosmum and Sloanea, further characterizing the LIA as a period of increased precipitation. These findings are in agreement with a number of paleoecological and paleoclimatic records from Peru (Thompson et al., Reference Thompson, Mosley-Thompson, Bolzan and Koci1985; Bird et al., Reference Bird, Abbott, Vuille, Rodbell, Stansell and Rosenmeier2011; Kanner et al., Reference Kanner, Burns, Cheng, Edwards and Vuille2013; Apaéstegui et al., Reference Apaéstegui, Cruz, Sifeddine, Espinoza, Guyot, Khodri and Strikis2014). The two phases of the LIA, as described by Thompson et al. (Reference Thompson, Mosley-Thompson, Dansgaard and Grootes1986, Reference Thompson, Mosley-Thompson, Davis, Zagorodnov, Howat, Mikhalenko and Lin2013) and Ledru et al. (Reference Ledru, Jomelli, Samaniego, Vuille, Hidalgo, Herrera and Ceron2013), are more ambiguous within the Palotoa record as it lacks a clear indication of a dry phase beginning 200 cal yr BP. Lower montane elements (e.g., Clethra and Begonia) became more prominent in the record as some premontane taxa became less abundant (e.g., Socratea, Warszewiczia, and Psychotria) perhaps reflecting the decrease in temperature suggested by the Andean ice-core records (Thompson et al., Reference Thompson, Mosley-Thompson, Davis, Zagorodnov, Howat, Mikhalenko and Lin2013).
The CONISS analysis identified three zones, the third of which, zone PAL-3, was identified as beginning after the MCA and carried through to modern times. Thus, the zone encapsulated the LIA but did not specifically identify it (Supplementary Fig. 1A). The DCA results clustered LIA samples toward the positive extreme of axis 1 and predominantly negative scores on axis 2. The LIA cluster had only one overlapping point from all other samples in the record. From these data, the inferred climate of the LIA was relatively wet, cool, and similar in seasonality to that of the MCA.
Lake Palotoa vegetation assemblage change, a graphical representation
Combining the pollen percentage data with stem abundance data, a graphical representation of structural changes in the local forest was created (Fig. 8). Figure 8 should be considered a visual aid that illustrates how the forest may have been constructed during significant time slices and should not be interpreted as a literal representation of forest assemblages. Three time slices were chosen to broadly represent the major changes observed in the record. Early stability of the record characterized by high Dictyocaryum pollen percentages was represented by 3210 cal yr BP. A period of increased precipitation was represented by 500 cal yr BP. The most recent sediment sample, occurring at the top of the record, represented the modern forest assemblage and was used to calibrate pollen abundance using stem abundance.
Graphical representation of how the balance of three key taxa may have changed in the forest at (A) modern times, (B) 500 cal yr BP, and (C) 3210 cal yr BP. Each symbol corresponds to an individual stem. White squares, white crosses, and yellow ovals are used to represent Cyathea, Hedyosmum, and Dictyocaryum, respectively. (For interpretation of the references to color in this figure legend, the reader is referred to the web version of this article.)

Dictyocaryum continued to be the dominant taxon throughout the pollen record; however, the greatest abundance of Dictyocaryum pollen occurred prior to 1160 cal yr BP. It was during this period that the vegetation assemblages experienced little variability. The time slice at 3210 cal yr BP represents this stable period and illustrates lower abundances of Cyathea and Hedyosmum alongside a greater abundance of Dictyocaryum. Cyathea appears to have about 60% fewer stems compared with modern stem abundances, and Hedyosmum has about 38% fewer stems. Dictyocaryum was estimated to have had about 59% more stems at 1160 cal yr BP than the number of stems currently recorded in the forest.
The forest structure changes after 1160 cal yr BP when precipitation started to increase and seasonality appeared to become similar to that of modern conditions. Conditions were characterized by either increased precipitation or increased cloud immersion during the dry season. These changes caused a response in the vegetation assemblages with an increase in the presence of Hedyosmum and a decline in Dictyocaryum. The time slice at 500 cal yr BP was chosen to represent this period. During 500 cal yr BP, Dictyocaryum and Cyathea stems declined by about 53% and 35%, respectively, relative to modern values. Hedyosmum, however, demonstrated a 115% increase compared with modern stem abundances as conditions shifted to favor this taxon.
CONCLUSION
The sediment record from Lake Palotoa is a rare addition to the limited Andean paleoecological records lacking a human signal. Lake Palotoa provides a fossil pollen record produced by vegetation responding exclusively to environmental changes and, because of the landscape position, climatic changes driven by moisture balance. The record came from a catchment dominated by the midelevation palm D. lamarckianum. Vegetation assemblages around Lake Palotoa were relatively stable systems composed of a Dictyocaryum-rich forest that existed for the last 3800 cal yr BP. Lake Palotoa’s stability can be attributed in large part to the moisture input from orographic clouds, particularly because of its position on the first Andean ridge to intercept Amazonian moisture inputs. Global-scale climatic events such as the MCA and the LIA were recognized within the record, though the vegetation responses were subtle. The floral signatures of the two events were distinct from one another and from other periods. The MCA and the LIA experienced a decline in Dictyocaryum with a subsequent increase in Hedyosmum and Sloanea. The opposing responses of these taxa are indicative of changing amounts of precipitation, as Dictyocaryum tends to prefer well-drained soils, whereas the others do not. Unique to the LIA was an increase in Clethra and Begonia, two elements that tend to occupy lower montane forests. This finding may suggest that the LIA produced cooler/wetter climates than that of the preceding years or the present. Both the MCA and the LIA may have been multistage events in which a common theme was somewhat wetter-than-modern dry seasons.
ACKNOWLEDGMENTS
We thank the leadership of Manu National Park and the Peruvian SERNANP, along with the Comunidad Nativa Machiguenga Palotoa-Teparo, for permission to access the lake, and Pantiacolla Lodge for logistical support. We would like to acknowledge the Vaughn-Jordan Foundation and a Wake Forest Research grant for providing the funding for fieldwork and the 2002 coring team that extracted the Palotoa core. Thanks also go to the unique group of undergraduate biology students from Florida Institute of Technology who joined the expedition to Lake Palotoa in 2002 and assisted during fieldwork. Analysis was conducted with support from the National Science Foundation (grant no. 1303831). This is publication 189 of the Florida Institute of Technology’s Institute for Research on Global Climate Change.
SUPPLEMENTARY MATERIAL
To view supplementary material for this article, please visit https://doi.org/10.1017/qua.2017.64