

1 Introduction
The research presented in this article is resultant from the present author’s PhD thesis and centres round the validity of using authentic, unscripted, spoken NS English. It investigates how learners of English can be helped to improve their listening and language processing skills when practising with authentic material. The characteristics of authentic spoken NS English may be difficult for the NN listener to unravel, particularly when spoken at speed. We present a novel approach to making in particular spoken authentic material available to the language learner by way of the patented DITCALL tool (Digital Interactive Toolkit for Computer Assisted Language Learning), a digital slow-down tool developed by the Dublin Institute of Technology which slows down speech without distortion. Testing carried out with the slow-down indicates that it enhances word recognition in rapid speech and makes authentic NS speech accessible to all levels of learner. It furthermore enhances and improves performance in, especially, listening skills and, it is felt, also facilitates the student’s ability to process spoken NS English.
2 Outline of research into the use of authentic materials
2.1 The perceived difficulties surrounding spoken authentic materials
The dilemmas involved with using authentic materials are, for example, the prescription of the language model, contextualization of authentic learning material, the complexity of the learner listening process and the seeming inaccessibility of streamed NS speech. Most researchers seem initially in favour of using authentic language for learning material, although many voice their worry about whether texts are appropriate to the learner and whether the level of material is accessible to the learner. Despite many arguments in favour of using authentic input in lesson materials, the use of authentic material in language learning is by no means widespread or uncontroversial. As regards the use of spoken authentic material, researchers warn against using spontaneous dialogue, which is by its nature intimate and specifically directed towards a particular person, making it harder to use as authentic lesson material because of its dependence on the context which prevailed during its production (Mishan, Reference Mishan2004). The present author takes the contrary view which is that it should be possible to use spontaneous dialogue, as long as the intended context and the situation in which the material was initially recorded is made clear to the learner listener by way of a glossary, or possibly by way of introductory exercise material which would serve the purpose of pre-listening material and can sensitize the listener to what is to come.
Findings emanating from the review of literature have suggested that familiar knowledge or background knowledge (which is innate to the NS) derives from a range of experiences relating to the speaker, the listener, the physical context, genre and topic (Brown, Reference Brown1990). Equally, it has been shown that, for communication to run smoothly, the interlocutors’ deictic centres should ideally overlap constituting a shared understanding of form, context and culture. It has furthermore been shown that, for the NNS to be able to process the L2 efficiently and effectively, it is important to facilitate the learner in building up a store of ‘multiple traces’ in the L2 through exposure to authentic speech (Aitchison, Reference Aitchison1994 & Field, Reference Field2003b). This author suggests therefore that it is essential to expose NN learners to contexts which pertain to the L2 community, as such exposure will give the learner valuable practice with ‘real’ situations within the safe environment of the language learning programme where mistakes can be made, skills can be tested and improved on and lessons can be learnt without ‘loss of face’. It is also suggested that accessibility to the socio-cultural background of the target language is responsible for the underlying cognitive mechanisms of language production. Learning materials which give the NN learner practice with a range of authentic situations in the target country, that show for example the preferred discursive strategies as well as the cultural and linguistic habits of the L2 community, will increase the learner’s awareness of the importance of contextual knowledge. Additionally, the ability to judge contextual clues in the L2 will help the learner in using repair systems, a skill which is innate to NSs but has to be acquired by NNSs. Such contextual clues can be either verbal or non-verbal signs – from stereotypic knowledge of what a typical NS is likely to say in a particular situation, to facial expressions and body language – which relate what has been said to knowledge acquired through past experience.
Drawbacks to using authentic NS speech which have been claimed by researchers such as Williams (Reference Williams1983), Cook (Reference Cook1998) and Darian (Reference Darian2001), for example, are (a) the fact that NS connected speech bears little resemblance to the orthographic form of the language, and (b) the level of difficulty some texts, whether spoken or written, may present for learners, noting vocabulary and ellipsis as particular difficulties. The present author argues, however, that it is precisely the fact that the pronunciation in connected speech differs so drastically from the orthographic form of the language that makes listening to ‘real’ language so difficult for learners. What has heretofore happened in textbook material is ‘distillation’ of the authentic texts, where all the obstacles that might pose problems for learners are taken out, rendering the texts into no more than ordinary textbook material, devoid of most, if not all of the realistic characteristics of everyday NS speech (Crystal, Reference Crystal1981). The danger with this kind of approach is that students learning from materials that are devoid of the real life difficulties of speech will not be prepared for any interactional discourse s/he may want to carry out in the country of the L2.
‘Real’ speakers make mistakes, are interrupted, use vague language, hesitate, argue etc., and the language the student is confronted with within the target community is fundamentally different from that which s/he is presented with in the classroom. The present author therefore suggests that the use of the DITCALL slow-down tool may be a solution to making ‘real’ spoken language available to NN learners, without resorting to re-recording spoken NS speech, so that s/he may become aware of the discrepancies between the orthographic form of the language and the sounds of connected speech, and practise with such material in order to improve his or her listening skills in the L2.
2.2 Slowed-down speech research: an overview
In research carried out by Zhao (Reference Zhao1997: 55–59) the positive effect of slowed-down speech for NNS is highlighted and he quotes researchers such as Flaherty (Reference Flaherty1979), Griffiths (Reference Griffiths1990a & Reference Griffiths1990b) and Rader (Reference Rader1991) to that effect. Zhao states that Rader had found no considerable improvement in listening comprehension using slowed-down speech. A major difference between the previously mentioned researchers and Zhao is that rather than asking teachers of English to (physically) slow down their speech rate, he used computer software to expand or compress time on an analogue machine, so that the original text ‘was approximately 198 Words per Minute (WPM)’ and ‘with the original speed as 100 per cent, a 25 per cent compression reduced the speech time to 75 per cent of the original’. Also, students were given control of the implementation of speech rate, which Zhao found to aid the improvement of the students’ listening comprehension skills. He also found in one particular test that: ‘…83 per cent (of participants) used a speed slower than the preset ‘normal’ (194WPM) speed…most chose the speed with a 25 per cent expansion (152–155 WPM)’.
Although Zhao notes that listening comprehension is influenced by many factors, such as ‘language proficiency and prior knowledge’, his research did show that the use of computers was viewed positively by participants, which suggests the empowering effect of self-controlled practice. Derwing and Munro (Reference Derwing and Munro2001: 333–334), whose research findings are opposite to those of Zhao, found when testing a group of English language speakers and a mixed language group, that ‘both…tended to prefer speech that was somewhat slower than native English speech when they were listening to Mandarin-accented utterances’. But the overall conclusion drawn is that there was no evidence from the research that slowed speech was preferred by ‘high proficiency listeners’. Derwing and Munro also quote findings from their earlier research where it was found that participants did not prefer those speakers who deliberately slowed down their speech rate. Such speakers were perceived as having ‘…less ‘natural-sounding’ speech, including odd prosodic patterns and spelling pronunciations’.
Although the research findings mentioned above appear to be diametrically opposed, there seems to be sufficient proof of the cognitive benefits of mechanically slowed-down NS speech for NN listeners. There is, however, no mention of Adaptive Overlap Add (AOLA) algorithms or Time Scale Modification (TSM) algorithms, such as the Overlap Add (OLA) algorithm and the Synchronized OverLap-Add (SOLA) or equivalent algorithms as used in the DITCALL project and improved by DonnellanFootnote 1 in either Zhao’s or Derwing and Munro’s research. It is therefore likely that the slowed-down passages of speech as used by Zhao or Derwing and Munro will have suffered from distortion if the above-mentioned algorithms were not used. The DITCALL project aimed to adapt a signal algorithm and refine this into a novel speech-processing algorithm (the DITCALL slow-down tool) for use in a language teaching application. This DITCALL algorithm allows recorded speech to be slowed to any speed without distortion or affecting the pitch. It is felt to be more efficient than previous ‘slow-down’ algorithms and can be implemented in real-time on a multimedia PC.
3 Methodological approach: testing the efficacy of the slow-down tool
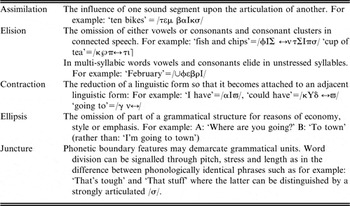
In order to be able to test the efficacy of the slow-down tool on the understanding (or more specifically the recognition) of authentic spoken language various tests were carried out by the present author. The samples chosen for the majority of the tests were of connected NS speech which was not prepared for pedagogic purposes. While some of the speech samples were chosen specifically for speed of delivery and authenticity, all samples display the occurrence of characteristics of authentic connected speech (which is mainly due to the speed of delivery) such as are displayed in Table 1, based on Crystal (Reference Crystal2004).
A sample of characteristic features of connected NS speech

The practical experience emanating from the tests carried out on increased word recognition with the use of the DITCALL slow-down tool brought about the following reflection: While the slow-down facility in general brought about an increase in word recognition for the majority of test participants, it was felt that the design of the tests was somewhat flawed. Additionally, after consultation with engineers on the DITCALL project, it was felt that some of the sound samples which had been used in the previous tests were of an inferior quality, which resulted in unacceptable distortions at 50% slow-down. Therefore, two more tests (tests A and B) were carried out, which are discussed below. The aim of Test A is to analyse the speed preference in NSs and NNSs. Test B is an initial investigation into whether the suggested holistic processing of chunks and an increased exposure to authentic NS speech with the additional benefit of the slow-down tool implies that those students who have been exposed to NS speech for a longer amount of time (i.e. the second year students) have increased word-recognition.
3.1 Test A: speed preference for NSs and NNSs
The subjects for Test A were randomly chosen NSs and NNSs. The group of thirty subjects comprised native speakers of the following languages: 8 Mandarin, 6 French, 4 British, 2 Hiberno-English, 1 American, 1 Slovak, 1 Thai, 1 Flemish, 1 Polish, 1 Telugu, 1 Malay, 1 Finnish, 1 Russian, and 1 Urdu.
In order to guarantee professional recording quality, ten spoken English phrases were selected both from official lesson material and from one spontaneous recording. The subjects for Test A were asked to listen to all four versions of each phrase, one after the other, and tick a box – either 1, 2, 3 or 4 – for the one they found most easy to understand. It was decided not ask the subjects to orally repeat what they thought they heard and subjects did not have to transcribe any of the samples, but were merely asked to state which speed they preferred. The sound files were of between four and eight units in length and did not contain contextual information. The reasons for this are that the Short Term Memory (STM) can only cope with between 3 and 7 units of speech, and not having contextual cues would also cancel out occurrences of the ‘wrap up’ effect (Field, Reference Field2003b) where subjects are inclined to ‘make up’ what they think they have heard. Subjects were asked to listen to ten different phrases (A to J), each played at four different speed rates (1 to 4 at respectively 100%, 80%, 60%, and 40%).
3.1.1 Speech samples for Test A
The following speech samples were chosen: recordings from ‘Professional English for Work and Life: English 365’ (Dignen et al., Reference Dignen, Flinders and Sweeney2004) and a recording by GallagherFootnote 2 of NS Irish English. Recordings used were in both male and female voices and were selected for their speed of delivery and occurrences of characteristics of connected speech.
The samples display the following features of connected speech:
A: Shall we go and get some lunch?
Assimilation: get some = /γε σ↔μ/
Elision: and = /↔ν/
B: Whenever the subject of Japan comes up
Assimilation: subject of = /σ℘βZ↔κ↔ϖ/
Elision: Japan = /δZ↔πΘν/
C: Maybe I should take that job after all.
Assimilation: should take = /Σ↔τεικ/, that job = /ΔΘ δΖ β/
D: You won’t like me for this
Assimilation: won’t like = /ω↔YνλαΙκ/
Elision: me = /μ↔/, for = /φ↔/
E: Where do they live
Elision: where do they = /ωε↔δ↔Δ↔/
F: There’s not much money in it
Contraction: there is = /Δε↔ζ/
Assimilation: not much = /ζν μ℘τΣ/
G: And I enjoy it fundamentally
Assimilation: I enjoy = /αI ϕ↔νδZ I/
H: On the road a lot
Assimilation: road a lot = /ρ↔Yδ↔λ /
I: I will have some whale
Contraction: I will have = /αIλ↔ϖ/
Elision: some = /σ↔μ/
J: What’s his e-mail address?
Elision: what is his = /ω τσIζ/
3.1.2 Data analysis for Test A
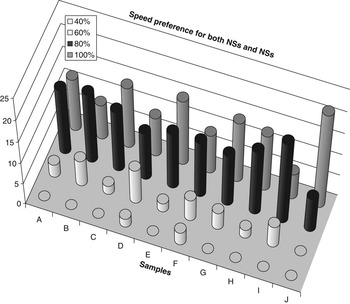
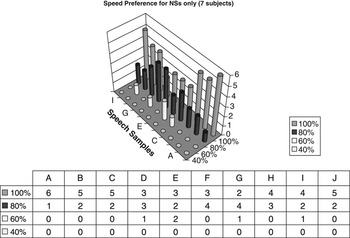
The charts below show the separate data for the recorded speed preferences for NNSs (Chart 1) and for NSs (Chart 2).
Speed preference for NNSs only for samples A to J

Speed preference for NSs only for samples A to J

3.1.3 Observations for both NS and NNS results
• An 80% slow-down seems to be the preference for most subjects over the slower rates of 60% and 40%, which is probably due to the ‘unnatural’ sound of speech slowed to between 60% and 40% of the original speed of delivery.
• Samples B, D, F and I were preferred at a slower rate of 80% and 60% by the majority of subjects. B and D are both spoken at respectively 341 and 344 syllables per minute. Sample B had the highest amount of syllables (11). F is spoken at 423 syllables per minute and is the only ‘authentic’ sample.
• Sample I was least understood at 100% and the majority of subjects needed to slow down this sample to 80%. This may be influenced by a contextual difficulty of the word ‘whale’.
• Sample J needed to be slowed down the least. This may be influenced by the fact that it contains only four units and contains the formulaic sequence: ‘e-mail address’.
• Sample D had the most occurrences of a 60% slow down.
• Samples F (authentic Hiberno-English and non-scripted) and D (containing the word ‘whale’) were the only samples where there was a need for a 40% slow down.
• Although the number of syllables does not seem to influence the need for slow-down, the speed rate (syllables per minute count) influences the need for the slow-down tool in most cases. However, sample G, which has the highest number of syllables per minute at 444, did not need to be slowed down to 40% for any of the participants, possibly due to the fact that this was a ‘textbook’ sample.
3.1.4 Observations for NSs only results
• None of the NS listeners indicated a preference for the 40% slow-down, possibly due to the ‘unnatural sound’ of the playback and the fact that the NS processing speed is not efficient at such a slow rate and possibly irritates the listener.
• Sample A was preferred by the majority of the NSs at 100%. The sample contains only seven syllables and the apparent ease of processing could be due to the fact that this sample is a formulaic sequence, ‘Shall we go and get some lunch?’.
• Samples B, C and J were preferred at 100% by 67% of NSs. All of these samples contain chunks (‘the subject of’, ‘comes up’, ‘I should take’, ‘after all’, ‘e-mail address’) and it can therefore be assumed that these phrases are processed more easily and more quickly.
• Samples F and G were both preferred at 80% by 67% of NSs. These samples are spoken in a Hiberno-English and Welsh accent respectively and both have a high syllable per minute count at respectively 423 and 444, further corroborating the suggestion that authentic NS speech can be made accessible through the use of the slow-down tool.
• 50% of NSs preferred sample D at 80%.
• 33% of NSs preferred sample E at 60%. This may be influenced by a contextual difficulty of the word ‘whale’.
3.1.5 Overall conclusion for Test A
Test A revealed that even NS listeners (as opposed to NN listeners) prefer to hear authentic NS speech which is either unscripted or is influenced by regional accent, at a slowed down speed (samples F and G). There is a strong indication therefore that authentic language is more accessible at slowed down speeds. It also seems that ‘unexpected’ words (such as the word ‘whale’) are initially not understood at the original speed of delivery, even in a scripted and carefully pronounced pedagogic sample. Samples containing chunks or formulaic sequences appear to be easily understood at 100% by the majority of NS listeners due to the holistic processing of these language units.
3.2 Test B: Testing word recognition with chunks and formulaic sequences
This small-scale test was informed by research carried out into the importance of formulaic language and chunks on fluency and language processing skills. An ability to successfully decode formulaic sequences appears to imply that the listener has a shared knowledge with the speaker, allowing him/her to enter into the L1 speech community. A closer look at the suggestions raised by research seems to indicate that fluency is no longer just a matter of ‘sounding like a native speaker’ in the sense that a NNS’s accent in the L2 can be favourably compared to that of a NS. Fluency is now a much wider concept and covers not only the physical ability on the part of the learner in the ‘four skills’ areas of reading, writing, listening and speaking, but also includes language processing and decoding skills. Researchers such as McCarthy and Carter (Reference McCarthy and Carter2002) use evidence from corpus studies to support the view that authentic NS language contains a large amount of prefabricated language and advocate that learners should be taught to prepare for this NS reliance on such language, in order not only to facilitate the processing of these multi-word strings, but also to increase the learner’s own fluency in the L2. Vegors (Reference Vegors1997) and Shibata Perera (Reference Shibata Perera2001) found that NNSs use formulaic sequences more often if they have a reason for wanting to fit into the L1 community, and that it is those learners who manage to integrate with NSs who will be more communicatively competent. Work by Carter and McCarthy (2000) carried out on the Cambridge and Nottingham Corpus of Discourse in English (CANCODE) revealed that chunks have discourse-level functions, which calls for learners to incorporate this type of authentic language usage into their productive skills. Multi-word units seem to be an integral part of authentic NS discourse and carry multiple pragmatic functions such as ‘politeness, directives, requests and non-face threatening expressions, vagueness and hedging’ (McCarthy & Carter, Reference McCarthy and Carter2002: 30–52). It is particularly this type of language usage which will make the learner sound more native-like and which will facilitate the creation of shared knowledge in NS – NNS communication. Being able to use such formulaic language furthermore reduces processing time as the pre-fabricated units are processed holistically.
The present study makes preliminary suggestions regarding the value of the NN learner’s awareness of the existence of formulaic language in authentic NS language and proposes the need for its inclusion in language teaching. The author suggests that the slow-down tool can facilitate learners in processing NS authentic language which contains chunks and formulaic language. It is felt that such formulaic language is spoken faster and (due to its speed and holistic processing characteristics) with less intonation and emphasis, therefore resulting in an increase in characteristics of rapid NS speech as is pointed out in Table 1. The slow-down tool can facilitate the learner in processing such fast speech signals, by allowing the learner more time with the signal. Once the learner has become familiar with the chunks or formulaic sequences, it is suggested that the learner will build up a ‘multiple trace’ or ‘acoustic cue’ easing future processing of such language. It is furthermore suggested that a familiarity with formulaic language will also make it easier for the learner to attempt to produce such language units and hence increase their fluency in the L2.
Test B was carried out with six NN first year undergraduate students and thirteen NN second year under-graduate students. The participants study International Business and Language at the Dublin Institute of Technology (DIT). They receive six hours of ESL tuition per week and can be assumed to have had an entry level requirement of 6.5 on the International English Language Testing Scale (IELTS). The test was carried out as an initial investigation into whether the suggested holistic processing of chunks and an increased exposure to authentic NS speech with the additional benefit of the slow-down tool implies that those students who have been exposed to NS speech for a longer amount of time (i.e. the second year students) have increased word recognition. The test additionally gives a clear indication of the effectiveness of the slow-down tool in that there is a marked improvement in word recognition.
3.2.1 Speech samples for Test B
The slow-down tool was tested on short samples of authentic, non-scripted Irish NS spoken English, taken from recordings by Gallagher. The speech samples all contain formulaic sequences, or ‘chunks’:
Sample A: ‘Just in relation to third level’ (‘Just in relation to’ and ‘third level’)
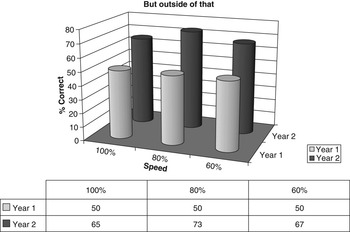
Sample B: ‘But outside of that’ (entire phrase is a chunk)
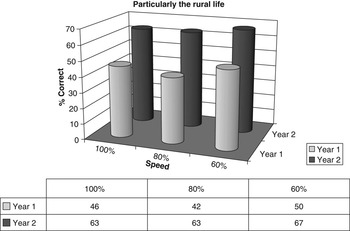
Sample C: ‘Particularly the rural life’ (‘rural life’)
Connected speech characteristics in the Formulaic Sequence test:
Sample A: ‘Just in relation to third level’
Assimilation: just in = /δΖ℘σ↔ν/, third level = /ΔΕ⌉ λεϖλ/
Sample B: ‘But outside of that’
Elision: of that = /↔ϖ ΔΘ/
Sample C: ‘Particularly the rural life’ (‘rural life’)
Elision: particularly = /π↔τΙκλ↔λI/
3.2.2 Data analysis for Test B
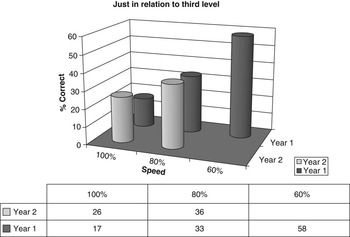
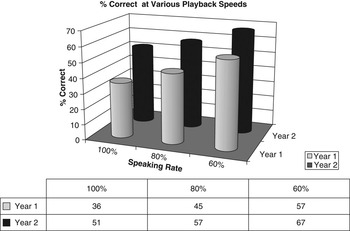
For ease of evaluation, the test results are shown in a single chart format for each speech sample (Charts 3, 4 and 5) and also one chart (Chart 6) showing the overall results for both first and second year groups. The methodology adhered to for this test is similar to that used in previous tests. The ‘wrap up’ effect that is discussed in the speed preference test (Test A) was avoided by playing the samples randomly. The data at 60% of the speed of delivery for the second year participants for sample A (‘Just in relation to third level’) were corrupted (due to mishandled entry forms) and could not be added to the results.
Results for Test 4, years 1 and 2, sample 1

Results for Test 4, years 1 and 2, sample 2

Results for Test 4, years 1 and 2, sample 3

Amalgamated results for Test 4, years 1 and 2, percentage correct at various playback speeds

3.2.3 Overall conclusion for Test B
The initial conclusion that can be drawn from this last test (Test B) is first of all that the overall results indicate that the slow-down tool is effective in increasing word recognition. Secondly, it appears that the shorter samples such as B and C benefited most from the slow-down tool. As has been discussed in Test A, the ‘wrap up’ effect does not occur as frequently in shorter samples. However, the increase in word recognition with 60% slow-down was highest for the longer sample A which seems to indicate that allowing the listener more processing time is most beneficial with longer samples. The suggested benefit of length of exposure to authentic NS speech between year 1 and year 2 seems also apparent from increased percentages of correct word-recognition for year 2 subjects as compared to year 1 subjects.
The overall average increase in word recognition between year 1 and year 2 students is shown in Table 2.
Increase in word recognition, Test B, years 1 and 2

Table 2 indicates the effect of increased exposure to authentic NS language on word recognition between year 1 and 2, where year 2 scored a considerably higher percentage correct even at 100% speed of delivery. The increase in word recognition with the benefit of the slow-down tool is most apparent for year 1, where an increase of 9% was noted as opposed to an increase of only 7% for year 2.
4 Discussion
Judging from the analysis of initial feedback provided by the tests conducted to date, it seems clear that more testing and further research into psycholinguistics and the characteristics of the listening process in a second language will be necessary. However, the analysis of the tests carried out concluded that in general, and in particular for NN listeners, the slow-down tool did significantly increase word recognition. And on average, both NS and NNS listeners favoured a play back speed at 80% of normal NS speed. Verbal feedback from those tested has indicated that slower speeds were avoided because they seemed too unnatural. Listening to speech at speeds other than 100% is unnatural. Studying tennis serves or golf swings at slowed-down speeds is also unnatural – but effective.
4.1 Practical benefits of authentic language learning materials
Characteristics of spoken NS English such as elision, co-articulation, reduction and epenthesis result in a blurred acoustic signal which may be difficult for the NN listener to unravel. This study takes the view that it is necessary to encourage the learner of English to use the same listening skills that they employ in their native language, such as predicting ends of words or phrases, guessing at sounds, and using context to find clues about words that have been missed, misheard or misunderstood. Through the design and implementation of the digital slow-down tool in authentic lesson material the door is open to using formerly inaccessible material, or material which was too difficult for learners to process because of its speed and the resultant reductions of speech elements.
It is suggested that with the use of the DITCALL slow-down facility, the learner can listen to authentic, unscripted material which, prior to the availability of the slow-down tool, was not accessible to language learners and which Cook (Reference Cook1998) claims is too ‘inarticulate’ and too difficult for learners to understand. By allowing the learner listener more time with the acoustic signal through the slow-down facility, it may become possible to facilitate the learner in building up a store of ‘real’ NS sounds which will help the NN listener’s language processing skills and therefore, with practice, will facilitate understanding and recognition of NS sounds. With the availability of the DITCALL slow-down tool, most spoken authentic NS (and NNS) material can now be fully exploited as lesson material and made accessible to all levels of learner through complementary graded exercises. While digitally slowed-down NS speech in itself will not guarantee that NN listeners will become more communicatively competent in the L2, it will help learner listeners of all levels to be able to listen to and understand authentic spoken material.
Having access to authentic audio and audio-visual material, which is not especially prepared for learners, will allow the NN learner to gain access not only to the sounds of the L2 as it is spoken in reality, but it will also enable the learner, through appropriate complementary exercise material and glossaries, to gain experience with the preferred language patterns in the L2 and so prepare the NNS for encounters with NS interlocutors. By exposing the learner to ‘real’ language which is not devoid of the characteristics of connected speech and presenting those sounds in a slowed-down form, one is able to raise awareness in the learner listener of such features as are presented in Table 1, features which may make the spoken language sound far removed from its orthographic form to the NN listener. Not having to use actors for either audio or audio-visual learning material will moreover ensure that the learner can be presented with localized, culturally realistic content which is representative of the L2 community.
4.2 Suggested skill improvements through the use of the slow-down tool
The development of the DITCALL slow-down tool and its applications in a language-learning paradigm brings about a change in current language learning pedagogy and in particular in listening methodology. For example, it can be used to focus the learner on identifying sounds that have seemingly ‘disappeared’ in the stream of speech. The use of the slow-down algorithm reveals the contrast between natural spoken English and the citation form of words. The slow-down facility is therefore able to emphasize NS characteristics such as, for example, vowel alteration, elision and assimilation and facilitates the learner’s cognitive acceptance and recognition of such features. The opportunity to study speech production in detail with the slow-down tool will mean that learners and researchers alike can observe authentic speech as it is spoken in reality but at a speed which is both comfortable and accessible, and benefit from an increased awareness of the characteristics of connected speech. The use of the slow-down tool for pedagogic purposes also has relevance to further exploitation and commercialization of a stand-alone slow-down tool. At a research level, the slow-down tool may open up areas of listening and pronunciation processes which heretofore may have been unclear. It is suggested that improvement in the following language-learning skills can be made possible through exposure to ‘real’ spoken NS language in a slowed form, allowing the learner more time with the speech signal:
a) Amassing a stock of ‘multiple traces’ in the L2, easing the processing load for the NN learner. Field (Reference Field2003b) suggests that the mind stores samples of new audio cues, and each time there is a match to this sound it is added to the memory. The more ‘traces’, the more familiar the sound and the easier it is to process and hence understand.
b) Increasing awareness of cultural and contextual background information to the L2 community through appropriate audio-visual material and accompanying exercises, thereby increasing shared knowledge with NS interlocutors.
c) Awareness of the use and communicative value of prosodic cues in the L2, through authentic audio-visual material which provides the learner with both verbal and non-verbal cues.
d) Awareness of preferred language styles and language use in the L2.
e) Facilitating acculturation of the NNS into the L2 community through increased experience of NS speech and its embedded socio-cultural connotations and traditions.
5 Conclusion
From the research carried out it seems that there is overwhelming evidence in favour of the use of authentic materials. In particular spoken natural English, spoken at speed – meaning that it is not devoid of any of the ‘messiness’ of natural speech – seems to be a useful source for lesson material, as it sensitizes the learner for what they might encounter once they become part of the language community in the country of the chosen L2. It has, however, also become clear that there are certain caveats to be observed when using authentic materials. It seems especially relevant to make sure, when designing authentic lesson materials, that the content and also the context of the material is relevant to the learner’s needs. Equally, it is important to give the learner insight into the socio-cultural background the texts emanated from, in order to help bridge the gap between the student as ‘overhearer’ and the actual context of the discourse material. Using authentic materials in this way can prove not only to improve the learners’ receptive and productive skills but also to give them an understanding of the preferred linguistic patterns, traditions and culture of the target country.
With the DITCALL slow-down tool, the needs of the learner group of the present study can be met successfully. The author suggests that the material should reflect the ‘real’ language as used by the community surrounding the learner (whether student community or socio-cultural community at large). This allows the learner to re-classify the authentic language input against their own frame of reference – which is, at that moment, his or her life in the L2 community. Before the availability of the slow-down facility, such authentic material would not have been advisable for the learner group, because of the level of difficulty. However, it is suggested by the present author that by allowing the learner listener more time with the speech signal through slowing it down without tonal distortion, authentic spoken language can be made more accessible and, it is suggested, a slowed-down version of authentic speech allows the learner to identify and recognize individual sounds (or the absence of, in particular, elided sounds) more easily. The suggested benefits of the use of the slow-down tool are:
a) The slow-down tool will increase intelligibility of particularly authentic NS speech.
b) The learner listener is facilitated in recognising and segmenting individual words out of the stream of speech.
c) The slow-down tool will accentuate those elements of rapid speech which ‘disappear’ in the stream of speech through, for example, elision and assimilation.
d) The slow-down tool will accentuate and make accessible the stressed elements in authentic rapid speech, allowing for easier processing of those most salient and reliable elements of rapid speech.
Preparatory research by the present author also indicates that an awareness of the existence of formulaic language in NS speech will at least facilitate the NN learner in acquiring more efficient language processing skills. Once the language processing of the NNS becomes more effective and the learner listener is able to decode chunks and formulaic language as holistic units, the learner will be one step closer to an increase in shared knowledge with the NS interlocutor. As research has shown, the production of formulaic sequences by learners is by no means without difficulty and it seems it is therefore important for the NNS to become first and foremost fluent listeners. It is important that formulaic language is incorporated in future DITCALL learning materials and exercises.