Introduction
The extensive flooding induced by impoundment triggers abrupt water eutrophication, boosting zooplankton production. In such circumstances, helminths with plankton-linked life cycles take over the dominance in fish parasite communities (Chugunova et al. Reference Chugunova, Ieshko, Gorbach and Polyaeva2024). In some cases, the host infection rates rise so much that one can speak of a new helminthiasis source area. The Kureyskoye Storage Reservoir has become a source area of the disease caused by the tapeworm Triaenophorus crassus Forel, 1868. T. crassus is a widespread Holarctic fish parasite whose biology, life cycle, and specialisation across developmental stages have been thoroughly studied (Kuperman Reference Kuperman1973). Its first intermediate hosts can be calanoid and cyclopoid copepods. Procercoids develop inside their body cavity. Plerocercoids are localised in the musculature of coregonid fishes – second intermediate hosts feeding on zooplankton. The parasite’s life cycle in the Kureyskoye Reservoir is mainly tied to the local form of the least cisco, Coregonus sardinella Valenciennes, 1848. Another intermediate host is the common whitefish, Coregonus lavaretus (Linnaeus 1758), which exhibits a high prevalence but low intensity of the plerocercoid infection. The definitive host, in whose gut the parasite reaches the adult stage and reproduces sexually, is the northern pike, Esox lucius Linnaeus, 1758. It gets infected when eating parasitised fish.
The prevalence and abundance of T. crassus in the intermediate and definitive host populations of natural water bodies are usually low, but with anthropogenic activities (eutrophication, hydropower engineering, etc.) the cestode often becomes vastly prevalent (Mitenev and Shulman Reference Mitenev and Shulman1991; Mitenev et al. Reference Mitenev, Shulman, Karasev and Ponomarev2010). Triaenophoriasis has been reported to affect the well-being of fish, their growth, and even survival (Miller Reference Miller1945; Pulkkinen et al. Reference Pulkkinen, Valtonen, Niemi and Poikola1999; Pulkkinen and Valtonen Reference Pulkkinen and Valtonen1999; Voronin et al. Reference Voronin, Chernysheva, Strel’bickaya, Yu and Yunchis1992). According to some studies, the infection prevalence and intensity commonly tend to rise with fish age (Pacala and Dobson Reference Pacala and Dobson1988; Poulin Reference Poulin2000; Zelmer and Arai Reference Zelmer and Arai1998). Fish of the same age vary markedly in size due to variation in individual growth rates (Pulkkinen and Valtonen Reference Pulkkinen and Valtonen1999; Wootton Reference Wootton and Godin1998), but the contribution of parasites to this variability is poorly studied.
Using the case of the least cisco in the Kureyskoye Reservoir, we explore (1) the age-related dynamics of the infection with T. crassus plerocercoids, (2) the patterns of plerocercoid distribution among hosts across age cohorts, and (3) test the hypothesis that a plerocercoid infection affects least cisco growth at the population level. We suggest using the intensity of the T. crassus plerocercoid infection in older least ciscoes as an indicator of overall change in the aquatic ecosystem upon human disturbance.
Materials and methods
The infection with T. crassus plerocercoids was estimated through full helminthological dissection of least ciscoes from populations of the Kureyskoye Reservoir, lakes Sobachye and Kutaramakan, and River Khatanga. As a rule, freshly captured fish were examined, but when circumstances prevented such examination, the fish were frozen or fixed in 10% formalin to be examined afterwards in the laboratory (Chugunova et al. Reference Chugunova, Ieshko, Gorbach and Polyaeva2024). The examination of fish for parasites and the treatment of the helminths retrieved from tissues and organs strictly followed standard protocols (Bykhovskaya-Pavlovskaya Reference Bykhovskaya-Pavlovskaya1985). This was preceded by measurements of the total length and weight of the fish, and scale sampling for age determination. The age was determined by counting annual growth rings (Pravdin Reference Pravdin1966). Mikromed MC2 Zoom 2CR and Mikromed 3 microscopes with a ToupTek camera and digital image processing software were used. Own data were supplemented with published morphometric information on least cisco from lakes Sobachye and Kutaramakan (Nikulina Reference Nikulina2021; Romanov et al. Reference Romanov, Polyaeva and Nikulina2019). The sampling locations are mapped in Figure 1.
Schematic map of the study areas in Lake Sobachye (1), Lake Kutaramakan (2), Kureyskoye Reservoir (3), and River Khatanga (4).

Figure 1. Long description
The map consists of three interconnected panels.
1. Bottom-left panel: A broad map of Northern Asia within the Russian Federation, with the Krasnoyarsk region highlighted in dark gray. An arrow points from this region to the larger regional map on the right.
2. Right panel: A detailed map of the Krasnoyarsk region showing major river systems including the Yenisey, Angara, Podkamennaya Tunguska, Nizhnyaya Tunguska, Pyasina, and Khatanga. The Kara Sea is located to the North. A black box in the Northwest section of this map is expanded into the top-left inset. Study site 4 is marked with a black dot on the Khatanga River in the Northeast.
3. Top-left panel: An inset map showing the specific study areas. A scale bar indicates 0 to 50 k m. A North-South compass arrow is located in the bottom-left.
* Site 1 is a black dot at Lake Sobachye, located East of Lama lake and North of Keta lake.
* Site 2 is a black dot at Lake Kutaramakan, located Southeast of Site 1.
* Site 3 is a black dot at the Kureyskoye reservoir in the Southwest corner of the inset.
* Other landmarks include Pyasino lake in the Northwest and Khantayskoye lake and reservoir in the central-South area.
Kureyskoye Reservoir (66°56′47″ N, 88°20′33″ E) was formed in 1987–1989 by impounding River Kureyka, a right-bank tributary to the Yenisey. This canyon-type body of water is 170 km long, with 558 km2 surface area. Kureyskoye Reservoir’s least cisco is a resident form descending from the lacustrine populations that had inhabited valley water bodies flooded upon impoundment. Sampling was done in 2013, 2016, 2018, and 2019. Fish were captured with a sweep net from the intake chamber of the Kureyskaya hydroelectric power plant. In total, the sample consisted of 196 individuals aged 4+ (Table 1), 92–300 mm in length, and 4–76 g in weight.
Total body length of least ciscoes in the surveyed water bodies

Table 1. Long description
The table columns are Fish age, followed by three sub-columns (n, M, S) for each of the four locations: Kureyskoye Reservoir, Lake Kutaramakan, Lake Sobachye, and River Khatanga. n represents the number of fish, M is the arithmetic mean, and S is the standard deviation.
* Kureyskoye Reservoir: Data for ages 0 plus to 4 plus. Age 0 plus (n=76, M=109.4, S=6.6); Age 1 plus (n=6, M=147.5, S=12.1); Age 2 plus (n=13, M=176.3, S=10.8); Age 3 plus (n=72, M=188.8, S=10.9); Age 4 plus (n=29, M=196.6, S=7.8).
* Lake Kutaramakan: Data for ages 2 plus and 3 plus. Age 2 plus (n=13, M=159.6, S=9.5); Age 3 plus (n=2, M=170.5, S=0.7).
* Lake Sobachye: Data for ages 7 plus and 8 plus. Age 7 plus (n=9, M=269.1, S=10.3); Age 8 plus (n=14, M=276.2, S=9.4).
* River Khatanga: Data for ages 5 plus to 10 plus. Age 5 plus (n=1, M=283.0, S=dash); Age 6 plus (n=4, M=300.0, S=11.8); Age 7 plus (n=6, M=304.7, S=22.4); Age 8 plus (n=10, M=297.7, S=11.5); Age 9 plus (n=7, M=299.9, S=22.2); Age 10 plus (n=2, M=300.0, S=9.9).
Note: n – number of fish captured, M – arithmetic mean, S – standard deviation, differences between sexes are insignificant (MCR test: p > 0.267, explained below), variant distributions in all datasets of size n > 3 show no significant deviation from normality (Shapiro–Wilk test: W < 0.872, p > 0.104).
Lakes Sobachye (69°6′34″ N, 91°50′22″ E) and Kutaramakan (68°50′5″ N, 92°3′33″ E) are natural oligotrophic, deep-water bodies of glaciotectonic genesis, situated on the Putorana Plateau.
Lake Sobachye, lying within the Pyasina River catchment, is 49 km long, with 83 km2 surface area (Gordeeva Reference Gordeeva1963). Least ciscoes there form a landlocked population comprising the greatest range of age classes among the plateau’s water bodies – from 0+ to 9+ (Nikulina and Romanov Reference Nikulina and Romanov2019). A total of 23 individuals aged 7+ and 8+, 247 to 287 mm long and weighing 62 to 143 g, were captured and examined in 2014.
Lake Kutaramakan, belonging to the Yenisey River catchment, consists of two parts, totalling 55 km in length and 93 km2 in surface area (Zadelenov et al. Reference Zadelenov, Dubovskaya, Bazhina, Glushchenko, Isaeva, Kleush, Semenchenko, Matasov and Shadrin2017). The least cisco is represented there by a small-sized landlocked form with a lifespan of up to 6+ years and lower growth rates compared to other water bodies of the plateau (Nikulina and Romanov Reference Nikulina and Romanov2019). The parasite communities in fish from this lake were studied in 2016 by examining a total of 15 individuals aged 2+ to 3+, 144 to 177 mm long and weighing 21 to 38 g.
River Khatanga (71°59′27.90″ N, 102°28′57.89″ E) arises at the confluence of rivers Kheta and Kotui, and flows via the North Siberian Lowland for 227 km to the Khatanga Gulf of the Laptev Sea (Resources of surface waters …, 1964). Its least ciscoes are semi-anadromous, spending most of their life in the Khatanga Gulf and ascending the Kheta River to breed. Fish to be examined for parasites were captured during the spawning migrations of 2011 and 2014. A total of 30 individuals aged 5+ to 10+, 266–333 mm long and 112–224 g in weight were examined. The infection with T. crassus plerocercoids was described by standard metrics – prevalence (the percentage of parasitised fish, P, %) and mean abundance (the arithmetic mean of the number of parasites per host within the sample, М, ind.). The data were processed in MS Excel and R 4.5.1 environments (R Core Team 2026) using basic statistical functions (stats) and functions of the packages ‘compositions’ (van den Boogaart et al. Reference van den Boogaart, Tolosana-Delgado and Bren2026), ‘fitdistrplus’ (Delignette-Muller et al. Reference Delignette-Muller, Dutang, Pouillot, Denis and Siberchicot2026), and ‘MVN’ (Korkmaz et al. Reference Korkmaz, Goksuluk and Zararsiz2026).
The plerocercoid distributions among hosts captured in the Kureyskoye Reservoir in different seasons were compared by the Kolmogorov–Smirnov (KS) test (stats::ks.test). The analysis revealed no significant differences in host infection rates between sexes or seasons (KS < 0.392, p > 0.069). Therefore, in subsequent analyses, fish were sorted only by age. The mean abundance of parasites was modelled by exponential regression of the form M = b exp (a age), where coefficient b represents the initial infection level in the hosts, and coefficient a represents the mean rate of its increase with age. The initial dataset was tested for bivariate normality using Mardia’s method (MVN::mardia) after a standard procedure of linearising the exponential function (lnM), and the outcome was positive – deviations from normality were insignificant in both skewness (p = 0.186) and kurtosis (p = 0.530). Coefficients for the exponential model were obtained by iterative fitting to minimize the residuals (stats::nls); confidence intervals were constructed by the percentile method after simple nonparametric bootstrapping with B = 1000 replications. Student’s t-test was used to test the difference of model parameters from zero. The goodness of fit between the model and the input data was measured by the coefficient of determination R2 (compositions::R2).
The observed frequency distributions in each age cohort were subjected to the Kolmogorov–Smirnov test to compare them with three theoretical distribution types commonly found in parasitic communities (Ieshko et al. Reference Ieshko, Gorbach and Parshukov2024; Pavlov and Ieshko Reference Pavlov and Ieshko1986) – Gamma distribution, Poisson distribution, and negative binomial distribution (fitdistrplus::fitdist with the arguments ‘gamma’, ‘pois’, ‘nbinom’). Akaike information criterion (AIC) was applied to select the best model: the smaller the AIC, the better the model performs in approximating the distribution of parasites among hosts.
The hypothesis that the infection intensity influences the growth of fish in a population was tested by comparing data for the Kureyskoye Reservoir versus other water bodies. The observed variability of fish length was modelled by a power regression of the form L = b age a, where age stands for the individual’s age, and L is the body length. Coefficient b stood for the average initial body length, and coefficient a represents the average growth rate. The first step was to fit model parameter values for each water body for males and females separately. Juvenile individuals, if any, were included in both subsets. We ran iterative fitting to minimize the residuals (stats::nls) and then compared homonymous parameters by resampling (MCR test – Monte Carlo Randomization). The significance of differences p in this approach represents the share of null model combinations (the observed difference of coefficients is not greater than the randomised difference, |d obs| ≤ |d rnd|) in the total number of runs B = 1000. The threshold for p was set at the standard level of α = 0.05 (Shitikov and Rosenberg Reference Shitikov and Rosenberg2013). There being no significant differences sex-wise for either coefficient (MCR test: p > 0.267), all fish captured within the same water body were pooled together (Table 1) and generalised power models of least cisco growth were fitted to each water body at the second step.
The lack of our own data on age cohorts of least ciscoes in lakes Sobachye and Kutaramakan was offset by published data (Nikulina Reference Nikulina2021; Nikulina and Romanov Reference Nikulina and Romanov2019). In this case, the growth models for males and females were adjusted to the mean body length indicated by the authors. Similarly to our datasets, the model parameters had no significant differentiation between sexes (MCR test: p > 0.471), so males and females were pooled together in each specific case. For Lake Kutaramakan, own and published data were also combined since comparisons showed no significant differences in the model parameters (MCR test: p > 0.125). The parameters derived from our own and published data for Lake Sobachye differed significantly (MCR test: p < 0.012), so both models were used for drawing comparisons with the Kureyskoye Reservoir.
After taking the logarithm of the initial variables (ln L and ln age), we tested all the generalised datasets for bivariate normality by Mardia’s method. Finding no significant deviations from normality (skewness p > 0.071 and kurtosis p > 0.054), we moved to the third step of fitting the power models of least cisco growth for all water bodies to a common value of coefficient b = const. Such unification reduces the adequacy (R2) of most final models, but enables comparisons between individual growth rates, i.e., values of coefficient a. The intervals of its variation were determined by the percentile method following simple nonparametric bootstrapping with B = 1000 runs. The fish growth rates a in least cisco populations of the water bodies under study were compared by randomisation as described above (MCR test).
Results
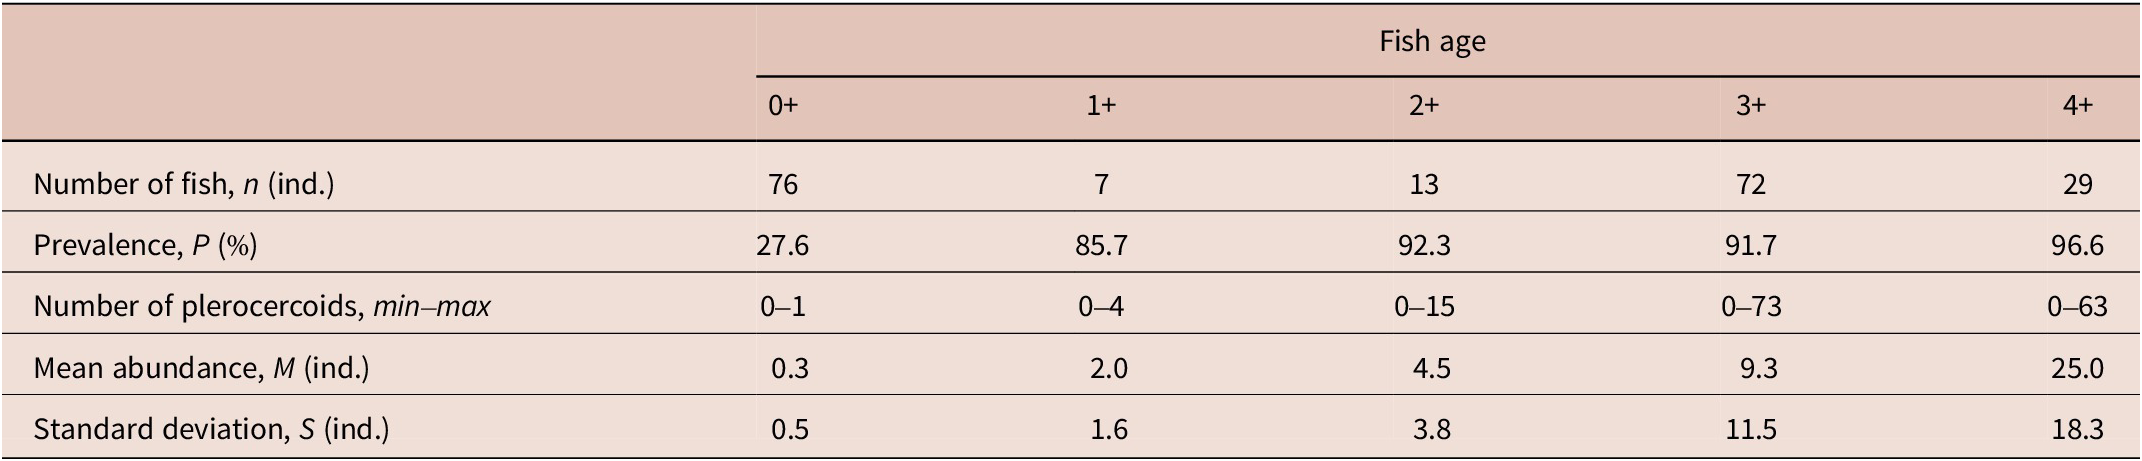
Least ciscoes captured in the Kureyskoye Reservoir were up to 4+ years old (Table 1). Plerocercoids were found in all age groups (Table 2). In heavily infected older fish, they amounted to 5.4 g total weight (up to 7.6% of the host’s body weight). Where infection intensities were high, exceeding 14 worms per fish, plerocercoids were predominantly located in muscles freely, not encysted in connective tissue. Penetrating into the musculature and apparently lysing the muscle tissue, plerocercoids produced deep ‘tunnels’ (Figure 2). Apart from the main localisation – the musculature, plerocercoids were retrieved from the kidney, liver, and pericardium, from under the skin, and from the base of gill filaments.
Parameters of T. crassus plerocercoid infection in least ciscoes of the Kureyskoye Reservoir

Table 2. Long description
The table consists of 6 columns and 6 rows. The first column lists the infection parameters, while columns 2 through 6 represent fish age groups: 0 plus, 1 plus, 2 plus, 3 plus, and 4 plus.
* Number of fish, n (ind.): 76 for age 0 plus; 6 for age 1 plus; 13 for age 2 plus; 72 for age 3 plus; 29 for age 4 plus.
* Prevalence, P (percent): 27.6 for age 0 plus; 85.7 for age 1 plus; 92.3 for age 2 plus; 91.7 for age 3 plus; 96.6 for age 4 plus.
* Number of plerocercoids, min-max: 0-1 for age 0 plus; 0-4 for age 1 plus; 0-15 for age 2 plus; 0-73 for age 3 plus; 0-63 for age 4 plus.
* Mean abundance, M (ind.): 0.3 for age 0 plus; 2.0 for age 1 plus; 4.5 for age 2 plus; 9.3 for age 3 plus; 25.0 for age 4 plus.
* Standard deviation, S (ind.): 0.5 for age 0 plus; 1.6 for age 1 plus; 3.8 for age 2 plus; 11.5 for age 3 plus; 18.3 for age 4 plus.
Right (a) and left (b) sides of a least cisco body upon the removal of encysted and unencysted T. crassus plerocercoids. The Petri dish (b) contains all the plerocercoids of the parasite, obtained from the musculature of this fish. Scale bar: 5 cm.

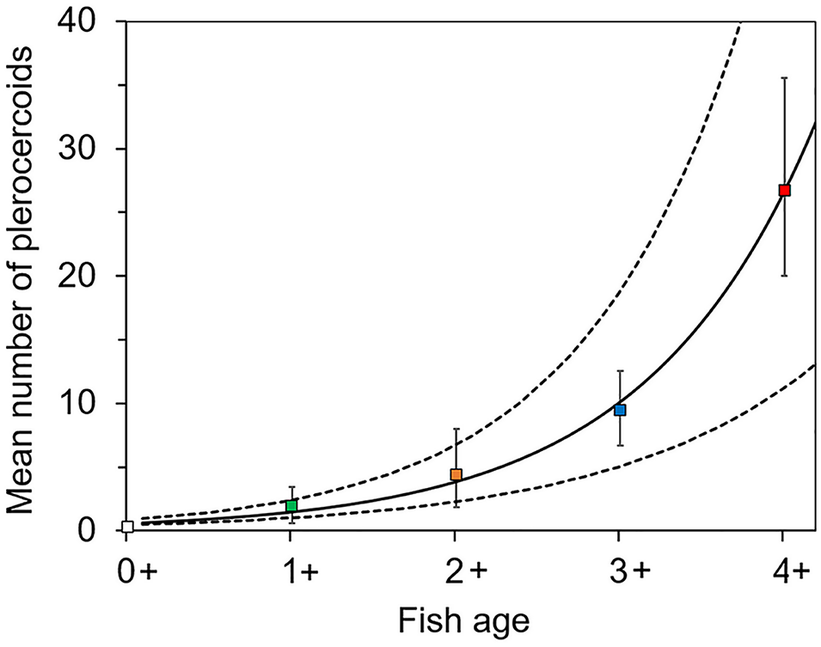
Analysis shows that the mean abundance of plerocercoids increased exponentially with the host’s age (Figure 3). The model predicts that an average host aged 5+ and 6+ will be infected with 69 (25–145) and 183 (55–403) worms, respectively.
Increase in the mean abundance of plerocercoids (M) with fish age in the least cisco population of the Kureyskoye Reservoir. Whiskers indicate the ranges of variation of the mean, obtained by the percentile method after bootstrapping, and the lines show the trend (solid line) and its confidence intervals (dashed lines) for the exponential regression model.

Figure 3. Long description
The horizontal X-axis is labeled Fish age and ranges from 0 plus to 4 plus in increments of 1 year. The vertical Y-axis is labeled Mean number of plerocercoids and ranges from 0 to 40 in increments of 10.
Data points are represented by colored squares with vertical whiskers indicating variation ranges:
* At age 0 plus, a white square sits near the origin.
* At age 1 plus, a green square is positioned just above 0.
* At age 2 plus, an orange square is positioned at approximately 5.
* At age 3 plus, a blue square is positioned at approximately 10.
* At age 4 plus, a red square is positioned at approximately 27.
A solid black line represents an exponential regression trend starting near 0 and curving upward sharply toward the top right. Two dashed lines flank the solid line, representing the confidence intervals. These dashed lines diverge significantly as fish age increases, with the upper interval reaching the top of the Y-axis before age 4 plus.
Young-of-the-year (0+) were predominantly uninfected (Table 2), with less than 5% of them hosting more than one worm. The distribution of plerocercoids among hosts aged 0+ does not fit any of the known distributions. In the following age groups, the observed frequency distribution is moderately well approximated by the Gamma distribution (Kolmogorov–Smirnov test: KS > 0.110, p > 0.166, AIC > 1000), but the negative binomial model describes the observed distributions much better, and frequencies at ages 1+ and 2+ also show a good fit to the Poisson distribution (Table 3). In yearlings, judging by AIC values, the Poisson distribution is more adequate to the observed data, while in fish aged 2+ the negative binomial distribution more adequately models the observed frequencies close to zero values. At ages 3+ and 4+, even fewer host individuals remained uninfected or slightly infected (Figure 4), and parasites became more evenly distributed among hosts. Plerocercoid distribution remained aggregated due to increased infection intensity, but it is worth noting that while the mean plerocercoid abundance increased markedly towards age 4+ (Table 2), no significant change from age 3+ occurred in the maximum infection intensity (~70 ind.), and thus the distribution shape parameter has attained stability.
Patterns of plerocercoid distribution among hosts in the Kureyskoye Reservoir

Table 3. Long description
The table consists of 10 columns and 6 rows including headers. The first column is Fish age, followed by two main categories: Poisson distribution (4 columns) and Negative Binomial distribution (5 columns).
Column headers for Poisson distribution include Lambda, K S, p, and A I C. Column headers for Negative Binomial distribution include size, mu, K S, p, and A I C.
Data by Fish age:
* 0 plus: Poisson (Lambda 0.28, K S 0.759, p less than 0.001, A I C 98.02); Negative Binomial (size greater than 100, mu 0.27, K S 0.759, p less than 0.001, A I C 100.02).
* 1 plus: Poisson (Lambda 2.00, K S 0.286, p 0.617, A I C 26.89); Negative Binomial (size 10.03, mu 2.00, K S 0.327, p 0.608, A I C 28.80).
* 2 plus: Poisson (Lambda 4.54, K S 0.215, p 0.583, A I C 76.26); Negative Binomial (size 2.77, mu 4.54, K S 0.245, p 0.414, A I C 69.10).
* 3 plus: Poisson (Lambda 9.28, K S 0.393, p less than 0.001, A I C 870.79); Negative Binomial (size 1.21, mu 9.28, K S 0.137, p 0.160, A I C 424.60).
* 4 plus: Poisson (Lambda 25.03, K S 0.409, p less than 0.001, A I C 526.04); Negative Binomial (size 1.37, mu 25.03, K S 0.137, p 0.584, A I C 250.49).
Note: λ = μ (M, mean) and size (shape of the Gamma mixing distribution) – frequency distribution parameters, KS – value of the Kolmogorov–Smirnov test, p – significance of differences from the theoretical distribution, AIC – Akaike information criterion.
Age-related changes in the distribution of plerocercoids in the least cisco population of the Kureyskoye Reservoir. The most adequate models are provided for each age group, with their parameters indicated in Table 3. The Poisson distribution is represented by dashed lines, the negative binomial distribution – by solid lines.

Figure 4. Long description
The X-axis represents the Number of plerocercoids ranging from 0 to 100. The Y-axis represents the Proportion of infected hosts ranging from 0.00 to 0.30.
Four age groups are plotted:
* Age group 1 plus is shown with a green dashed line representing a Poisson distribution. It has the highest peak at approximately 0.27 proportion with a low number of plerocercoids (around 2) and drops sharply to zero by 10 plerocercoids.
* Age group 2 plus is shown with an orange dashed line (Poisson) and an orange solid line (negative binomial). The dashed line peaks at 0.19 and the solid line peaks at 0.14. Both curves converge to zero by 20 plerocercoids.
* Age group 3 plus is shown with a blue solid line representing a negative binomial distribution. It has a lower, broader peak of 0.08 and tapers off more slowly, reaching near zero around 40 plerocercoids.
* Age group 4 plus is shown with a red solid line representing a negative binomial distribution. It has the lowest peak at approximately 0.03 and exhibits a very long tail that extends across the graph toward 100 plerocercoids.
Overall, as the age group increases from 1 plus to 4 plus, the peak proportion of infected hosts decreases and the distribution of plerocercoids becomes more dispersed.
In lakes Sobachye and Kutaramakan, no T. crassus plerocercoids were found in least ciscoes (Rudkovsky and Bocharova Reference Rudkovsky and Bocharova2007; Romanov et al. Reference Romanov, Polyaeva and Nikulina2019; Chugunova et al. Reference Chugunova, Ieshko, Gorbach and Polyaeva2024), and fish from the Khatanga River were occasionally infected with single worms (P = 6.6%, М = 0.13 ind.) (Chugunova and Budin Reference Chugunova and Budin2018).
The influence of T. crassus infection on the growth rate of least ciscoes in the Kureyskoye Reservoir and other water bodies does not allow for definitive conclusions to be drawn (Table 4). The growth rate in Lake Sobachye, according to the literature, was the same as in the Kureyskoye Reservoir (Figure 5, MCR test: p = 0.715), but our data show a faster growth rate in Lake Sobachye (MCR test: p = 0.002). Compared to the Kureyskoye Reservoir, least ciscoes in the Khatanga River grew faster (MCR test: p < 0.002), while their growth rate in Lake Kutaramakan was slower (MCR test: p < 0.001).
Parameters of the power regression L = b age a, modelling least cisco growth with age, b = const = 1.35

Table 4. Long description
The table contains eight columns: Water bodies, a, Min, Max, d f, t, p, and R super 2.
* Kureyskoye Reservoir: a is 0.294, Min 0.284, Max 0.302, d f 195, t 9.97, p less than 0.001, R super 2 0.793.
* Kutaramakan Lake: a is 0.147, Min 0.125, Max 0.169, d f 22, t 9.21, p less than 0.001, R super 2 0.475.
* Sobachye Lake: a is 0.348, Min 0.339, Max 0.354, d f 23, t 93.33, p less than 0.001, R super 2 0.884.
* Sobachye Lake (lit): a is 0.292, Min 0.278, Max 0.307, d f 16, t 22.08, p less than 0.001, R super 2 0.878.
* Khatanga River: a is 0.385, Min 0.373, Max 0.400, d f 29, t 51.15, p less than 0.001, R super 2 0.594.
The regression model used is L equals b times age super a, where b is a constant of 1.35. Min and Max represent the confidence interval bounds for coefficient a.
Note: (lit) – literary data (Nikulina and Romanov Reference Nikulina and Romanov2019), min and max – lower and upper bounds of the confidence interval of coefficient а determined by bootstrapping, df – number of degrees of freedom, t – Student’s t-test value, p – significance of the difference of coefficient a from zero, R2 – coefficient of determination.
Least cisco growth dynamics. Morphometric data and means derived from the literature (Nikulina Reference Nikulina2021; Nikulina and Romanov Reference Nikulina and Romanov2019) are indicated by diamonds and circles, respectively. Lines show the trends of regression models (their parameters are given in Table 4).

Figure 5. Long description
The X axis represents Fish age from 0 plus to 10 plus. The Y axis represents Fish total length A B in m m, ranging from 50 to 400. Four distinct datasets are shown with logarithmic regression curves and corresponding data points.
* Khatanga River: Represented by blue diamonds and a solid blue line. This is the highest growth trend, starting near 60 m m at age 0 plus and reaching approximately 330 m m at age 10 plus.
* Sobachye Lake: Represented by green circles and a solid green line. This trend sits below the Khatanga River, reaching approximately 300 m m at age 10 plus. A dashed green line also tracks this data closely.
* Kureyskoye Reservoir: Represented by black diamonds and a solid black line. This trend is intermediate, starting near 100 m m at age 0 plus and reaching approximately 270 m m at age 10 plus.
* Kutaramakan Lake: Represented by red circles and a solid red line. This is the lowest growth trend, starting near 100 m m at age 0 plus and leveling off significantly to approximately 190 m m by age 10 plus.
The data points show increasing variance in fish length as age increases, particularly for the Khatanga River and Sobachye Lake populations.
Discussion
The dependence of T. crassus plerocercoid infection on the age of the least ciscoes in the Kurei Reservoir increases exponentially (Figure 3). This growth is apparently bounded by the maximum possible infection intensity per host. Our data suggest the top limit is 70 worms per fish by the age of 3+ and 4+. The proposed model estimates that the mean infection intensity will reach this level by the age of 5+, and will exceed it 2.5-fold by 6+ years. Heavily infected fish will inevitably die. High mortality is the only plausible explanation for the absence of fish older than 4+ in a sample as large as n = 196 individuals. To compare, the least cisco population sample of n = 300 ind. for Lake Sobachye, which is free of T. crassus, comprises ten age groups (Nikulina and Romanov Reference Nikulina and Romanov2019).
The distribution of plerocercoids among hosts that have reached two years of age becomes aggregated, as indicated by a gradual increase in dispersion (Table 2). Overdispersion is an attribute of parasitism substantiated by Crofton (Reference Crofton1971a, Reference Crofton1971b), a property of the relationships between parasite and host populations in natural water bodies. It is now widely recognized that aggregated distributions, where most hosts in a population carry relatively few parasites whereas some hosts are heavily parasitised, are generally typical of host-parasite systems.
The characteristic aggregation in the abundance distribution of trophically transmitted parasites (Poulin Reference Poulin2013; Shaw and Dobson Reference Shaw and Dobson1995) renders statistical proof of their effect on the host’s morphophysiological and demographic parameters at the population level challenging, if at all possible. Multiple studies have demonstrated a lack of harmful effects of triaenophoriasis on coregonid fishes (Amundsen et al. Reference Amundsen, Knudsen, Kuris and Kristoffersen2003). For example, Yana River’s least ciscoes infected with T. nodulosus and T. crassus plerocercoids had the same length and weight as healthy fish (Gromova et al. Reference Gromova, Apsolihova and Reshetnikov2012). The absence of significant positive correlation between the size of Arctic charr Salvelinus alpinus (Linnaeus 1758) and their parasite burden (Henriksen et al. Reference Henriksen, Smalås, Strøm and Knudsen2019) has been explained, among other things, by the energy benefits the fish possibly gain when feeding on the intermediate hosts. However, testing this hypothesis, as the authors note, requires laborious experiments with a variety of dietary regimens. There is only one study, with a differentiation into mildly and heavily infected hosts, where the authors succeeded in proving the significance of the correlation between the infection intensity and the growth rate of the fish host (Pulkkinen et al. Reference Pulkkinen, Valtonen, Niemi and Poikola1999).
Overdispersion is well approximated by the negative binomial distribution model (Table 3). As demonstrated elsewhere (Ieshko et al. Reference Ieshko, Gorbach and Parshukov2024; Pavlov and Ieshko Reference Pavlov and Ieshko1986), the negative binomial distribution can be represented as a Poisson distribution with a Gamma-distributed random parameter. Hence, when testing hypotheses regarding the distribution of parasites within host populations, it is reasonable to expect fitness to the negative binomial, Poisson, or Gamma distribution, and this is indeed the case with data on infection rates in the studied age groups. The fitted frequency models provide a quantitative description of the stages of triaenophoriasis progression in least ciscoes of the Kureyskoye Reservoir. Infestation of young-of-the-year begins once they start feeding on zooplankton. The infection intensity at this age is so low that it can be described as a uniform distribution of zeros. The frequency distribution of plerocercoids in yearlings approaches a Poisson distribution, indicating its randomness. The 2+ age is a transitional phase for the fish, at which randomness is succeeded by aggregation (the observed distribution of plerocercoids is better approximated by the negative binomial distribution). Further on, the number of uninfected or mildly infected fish declines, the frequency distribution evens out, but still fits the negative binomial model because of a growing intensity of the infection.
According to an earlier assessment of their biological parameters (Zotov et al. Reference Zotov, Zuev and Chugunova2023), least ciscoes in the Kureyskoye Reservoir are of a slow-growing lacustrine form. At 4+ age, when somatic growth slows down sharply, they are smaller than fish from populations of the Yenisey River, Lake Sobachye, and the Khantaiskoye Reservoir. A factor named as a possible cause of stunted growth is a heavy burden of T. crassus plerocercoids in the musculature. The comparative analysis of growth rates in our study did not corroborate this hypothesis. We find this assumption perfunctory for several reasons. Firstly, individual growth rates primarily depend on nutrition. That is why semi-anadromous fish from the Khatanga River, which migrate to the Khatanga Gulf of the Laptev Sea to forage, grow faster than fish of the landlocked, lacustrine form. The slowest growth among lacustrine populations has been demonstrated for least ciscoes in the ultra-oligotrophic Lake Kutaramakan. There being more differences between the water bodies than just the infection rates, the results from comparing individual fish growth rates across the water bodies can hardly be interpreted definitively. Secondly, most fish in the Kureyskoye Reservoir are not infected or mildly infected, growing at a rate common for such environmental conditions, and thus generating a population-wide background that inevitably veils the growth deviations of the fairly few heavily parasitised individuals. Thirdly, complexity to the observed growth rate dynamics is added by among-year environmental fluctuations – fish can grow faster in favourable seasons and slower otherwise. As a consequence, the frequency distribution of measurements averaged over fish of the same age captured in different years can deviate from the expected normality due to superposition of the initial distributions. This pattern is showcased by Lake Sobachye, where most fish aged 7+ and 8+ in our sample were larger than the averages reported in the literature (Figure 5), and so the growth rate estimates also differed significantly. The only adequate way to prove the assumption about the effect of triaenophoriasis on host fish growth is the method suggested by Pulkkinen et al. (Reference Pulkkinen, Valtonen, Niemi and Poikola1999), who graded the sample of same-aged fish by infection intensities.
Common whitefish in the Kureyskoye Reservoir are infected with T. crassus plerocercoids at high prevalence (P ~ 70% in a sample of n = 26 individuals) but with relatively low intensity (6 ind. max and M ~ 2 ind. per host). The secondary role that this species plays in the parasite’s life cycle is explained by a change in its dietary preferences with age – the fish quickly switch over to aquatic organisms larger than copepods and not associated with T. crassus. This conclusion is supported by available data, according to which the diet of common whitefish in the Kureyskoye Reservoir consists primarily of flying insects, detritus, chironomids, and bivalves. The age-related diet change in common whitefish diminishes its role in the life cycle of T. crassus, leaving the least cisco to be the principal vector for the transmission of plerocercoids to the definitive host – northern pike. No information is available on T. crassus infection in other coregonid species inhabiting the reservoir, viz. peled Coregonus peled and tugun C. tugun, but considering their populations are small, we suppose their role in the spread and persistence of triaenophoriasis in the area is minor.
In natural water bodies, the characteristically northern cestode T. crassus usually occurs rarely and in small numbers. In addition to the water bodies in our study, other examples are natural water bodies of the Kola Peninsula (Mitenev and Shulman Reference Mitenev and Shulman1991), the Yenisey River (Nikulina and Polyaeva Reference Nikulina and Polyaeva2020), and the Indigirka River (Odnokurtsev et al. Reference Odnokurtsev, Apsolihova and Reshetnikov2009). In the Ural tributaries to the Ob’ River – the Synya, the Voykar, and the Sob’, least ciscoes are infected at high prevalences of up to 73%, but the mean intensity is low – less than 4 worms per host (Gavrilov et al. Reference Gavrilov, Bogdanov and Ieshko2013). The situation in regulated reservoirs is different. Apart from our case of Kureyskoye Reservoir’s least cisco population, data are available on whitefish in the Vilyuyskoye Reservoir, where the infection prevalence at the time of the study was over 93%, with intensities of up to 30 plerocercoids per host (Odnokurtsev et al. Reference Odnokurtsev, Apsolihova and Reshetnikov2009).
The emergence and evolution of a triaenophoriasis source area has been studied the most thoroughly for the Verkhnetulomskoye Reservoir, impounded in 1963–1965 on the Tuloma River in the Murmansk Region (Mitenev et al. Reference Mitenev, Shulman, Karasev and Ponomarev2010). The profound impoundment-induced changes in the communities have altered the trophic relations between aquatic organisms, destabilising the host-parasite systems. Common whitefish became one of the main intermediate hosts for T. crassus, with the infection prevalence growing to 80% (Mitenev and Shulman Reference Mitenev and Shulman1991). Two decades later, prevalences started declining gradually, with occasional relapses in some years. By the mid-2000s, infection rates in the reservoir remained relatively high, and there were no signs of recovery in the environment-parasite balance (Mitenev et al. Reference Mitenev, Shulman, Karasev and Ponomarev2010).
Similarly to the Verkhnetulomskoye Reservoir, it is safe to say that the High-Northern Kureyskoye Reservoir now also harbours a steady source of T. crassus infection, which will persist there for several decades at minimum. A major distinction is that the principal actor in maintaining the epizootic is the least cisco, in which infection intensities are at least an order of magnitude higher than in common whitefish. Surveys show that the prevalence and mean abundance of the parasite in the whitefish population of the Kureyskoye Reservoir are currently at about the same level as in the Verkhnetulomskoye Reservoir in the 1980s–1990s. As full-fledged benthic communities are formed over time, one can expect a shift to occur in the trophic niche of the whitefish and, accordingly, a reduction in its infection rates. As a result, the environment-parasite balance is supposed to start recovering. In the Kureyskoye Reservoir, however, the least cisco will probably slow down this process, since the species’ dietary specialisation makes it a much more reliable host for this parasite. The infection rates in least ciscoes can decline only if Copepoda numbers fall notably.
Conclusions
Impoundment to create a storage reservoir is an ecological disaster for aquatic organisms, with a catastrophic alteration of the entire ecosystem happening overnight. The centuries-long system of relationships is ruined, and the survivors begin to build new communities. Mass diseases induced in coregonid fishes by the cestode T. crassus arise in response to a productivity boost. In natural northern water bodies, the prevalence and intensity of infection with this parasite are never high, but the upsurge of eutrophication in recently created storage reservoirs causes these parameters to grow in line with the rise in the abundance of copepods in the zooplankton. Our studies have demonstrated that three decades after the Kureyskoye Reservoir had been created, there formed a stable seat of triaenophoriasis. The leading role in transmitting the parasites from their first intermediate hosts (copepods) to the final host (pike) belongs to the least cisco. The parasite burden in the population grows exponentially with age. Threshold infection intensities (~70 ind. per host) are found in least ciscoes already at 3+ age. By then, the distribution of plerocercoids becomes aggregated, which is typical of an established host-parasite system. By the age of 4+, frequencies become more uniform as there remain fewer uninfected or mildly infected individuals. The aggregation persists due to increased infection intensity. The absence of older fish points to substantial mortalities among heavily infected hosts. Ultimately, the productivity boost induced by extensive flooding will fade away. This process will take at least a quarter century – a steady decline in the T. crassus infection in the least cisco can be expected no earlier than the 2050s.
Acknowledgements
The authors thank Olga Kislova for language editing and Nikita Yablokov, leading specialist of the Ichthyology Laboratory of the Krasnoyarsk branch of the Federal State Budgetary Scientific Institution ‘VNIRO’ (‘NIIERV’), for creating the map-scheme.
Financial support
The research was supported by the federal budget under State Assignment to the Karelian Research Center RAS (FMEN-2022-0005, state registration № 122032100130-3).
Competing interests
The authors declare no competing interests.
Ethical standards
The authors assert that all procedures contributing to this work comply with the ethical standards of the relevant national and institutional guides on the collecting, care, and dissection of animals.