I. INTRODUCTION
Hard nitride-based coatings are widely used in applications requiring good wear resistance, such as cutting tools for machining and metalworking dies. In contrast, low-friction coatings can be realized with solid lubricant materials such as MoS2 and soft metal solid lubricants (Ag, Au, Pb, and In). The beneficial effects of soft lubricants in reducing friction can be combined with the wear resistance of hard coatings if the appropriate type of composite coating can be deposited.
Methods for depositing composite coatings include deposition of alternating layers (multilayers),Reference Simmonds, Savan, Van Swygenhoven, Pfluger and Mikhailov1 simultaneous deposition of insoluble compounds and elements,Reference Endrino, Nainaparampil and Krzanowski2–Reference Mulligan, Blanchet and Gall5 or patterning methods.Reference Narayan, Wang, Tiwari, Kumar, Meng, Cheng, Zabinski, Doll and Veprek6 Specifically, the simultaneous deposition approach has been used to deposit films of TiC–Ag,Reference Endrino, Nainaparampil and Krzanowski2, Reference Endrino, Nainaparampril and Krzanowski3 WC–Ag,Reference Endrino, Nainaparampril and Krzanowski3 CrN–Ag,Reference Mulligan, Blanchet and Gall4, Reference Mulligan, Blanchet and Gall5 diamond-like carbon/AgReference Narayan, Wang, Tiwari, Kumar, Meng, Cheng, Zabinski, Doll and Veprek6 as well as hard coatings incorporating Au.Reference Voevodin, Fitz, Hu and Zabinski7, Reference Voevodin, Hu, Jones, Fitz and Zabinski8 Some success has been realized with improved tribological properties, but control of the microstructure can be challenging, mainly distributing the solid lubricant particles in a uniform manner throughout the coating.Reference Krzanowski, Endrino, Nainaparampil and Zabinski9 Also, as noted by Krzanowski,Reference Krzanowski10 deposition of the desired constituent elements and compounds does not guarantee their replication within the deposited film due to the highly nonequilibrium nature of many physical vapor deposition processes. Consequences of this include the formation of new crystal structures and highly extended solubility limits.
One hard coating/solid lubricant combination that does not appear to have received much attention is that of TiN with indium. Indium has been proposed as a component of coatings for dry machining,Reference Fox-Rabinovich, Bushe, Kovalev, Korshunov, Shuster and Dosbaeva11 and lathe-turning tests using In have shown some promising results.Reference Guleryuz, Krzanowski, Veldhuis and Fox-Rabinovich12 Therefore, in this study we have investigated the deposition and properties of Ti–In–N coatings. The goal of this work is to create TiN/In composite coatings by a natural phase separation process during deposition. However, as an alternative, it is possible that In alloyed as a solid solution within TiN may diffuse to the surface by frictional heating, creating an In surface layer that would provide low friction. This possibility is investigated by conducting dry pin-on-disk wear tests in addition to the structural and mechanical properties evaluation.
II. EXPERIMENTAL METHODS
Ti–In–N films were deposited by reactive radio frequency (rf) magnetron sputtering using Ti and In targets. The deposition was carried out in a turbomolecular-pumped high-vacuum chamber (base pressure < 2 × 10⁻⁶ Torr) equipped with two 50-mm-diameter sputter sources, each located ≈9 cm from the target and fixed at angles of 14° from the substrate normal. High-purity (>99.99%) indium and titanium targets were used. The total pressure during sputter deposition was maintained at 4.3 m torr, and the gas flow rates during reactive sputtering were fixed at 90% Ar/10% N2. Before the deposition of Ti–In–N films, a bond layer of Ti (30 nm thick) was deposited in pure Ar using a bias voltage of −50 V. Deposition was carried out using bias levels of either −50 or −150 V and adjusting the rf sputter gun power levels to give a range of Ti/In concentrations in the films. The Ti sputter gun was maintained at a power level of 180 W for all films. The indium sputter gun power levels ranged from 10 up to 60 W for the −50 V bias films and up to 150 W for the −150 V films. The samples are denoted here as 180-xx/yy, where “xx” is the In sputter gun power (in Watts) and “yy” is the bias voltage value. All films were deposited without intentional heating of the substrate. Deposition was carried out for 90 min in all cases except one (as noted below), giving typical film thickness values of 0.5–1 μm. The substrates used were polished 440C steel disks and (100)-oriented Si wafers.
X-ray diffraction (XRD) analysis was carried out on a Bruker AXS XRD system (Bruker AXS, Inc., Madison, WI) equipped with a Hi-Star area detector and a Cu Kα x-ray tube (λ = 0.1542 nm). Integration of the area detector scan was carried out to avoid peaks from the single-crystal Si substrate. The diffraction patterns were analyzed by comparing the data to the JCPDS powder diffraction file (PDF). Film compositions were analyzed using both x-ray photoelectron spectroscopy (XPS) and energy dispersive spectroscopy (EDS) in a scanning electron microscope (SEM). XPS provides complete analysis of all elements present, however, the close proximity of the Ti 2p and In 3d peaks makes them difficult to use for quantitative analysis. The Ti 3p and In 4d peaks were therefore used, however, the peak intensity for these peaks is generally low and results in a higher level of uncertainty for quantification of films with lower indium contents. Therefore, XPS was only used for selected films to gain information on the nitrogen and oxygen contents. All films were analyzed using EDS, but due to difficulties in quantifying oxygen and nitrogen concentrations with this method, only the Ti and In concentrations were determined. Therefore, film compositions will be reported as a percentage of In relative to In and Ti only. EDS analysis was carried out on an Amray 3300FE SEM (Amray, Inc., Bedford, MA) using a PGT IMIX system (Princeton Gamma-Tech, Princeton, NJ) operating at 25 kV for analysis and 7 kV for imaging. XPS was conducted on a Kratos Analytical Axis/HS instrument (Kratos Analytical Ltd., Manchester, UK), using a Mg Kα x-ray source operating at 15 kV. Etching of sample surfaces was carried out in the instrument using an Ar ion source operating at 4 kV and 10 mA for 10–20 min. For compositional analyses, scans were run at a pass energy of 160 eV and a step size of 1 eV.
Atomic force microscopy (AFM) measurements were performed in air with a Nanoscope IIIa equipment (Bruker AXS, Inc., Santa Barbara, CA). The images were taken in intermittent contact mode and silicon cantilevers (Bruker AXS, Inc., Camarillo, CA) were used. Both topography and phase contrast images were obtained simultaneously.
Pin-on-disk wear testing was carried out using a load of 1 N and a speed of 200 rpm. The track radius was typically 1 cm giving a sliding speed of 10 cm/s. The counterface used was a 6.2-mm-diameter alumina ball. The ball was cleaned and rotated to a new location for each test. Results that are presented as “average friction coefficient” were obtained by averaging over all data for the indicated test.
III. RESULTS
A. Compositional and structural evaluation
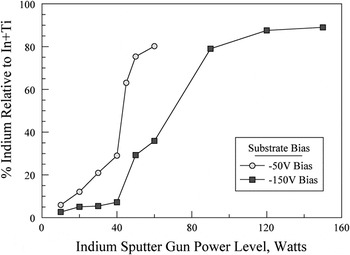
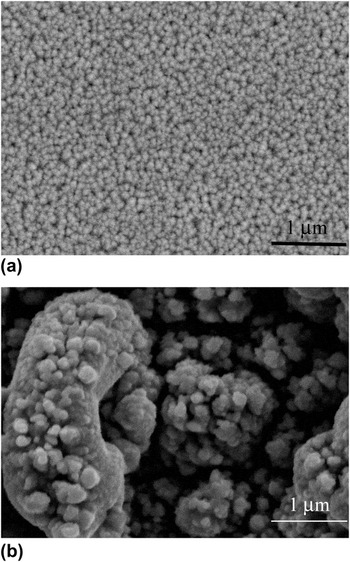
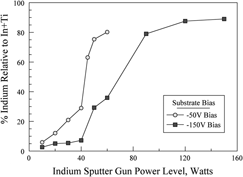
The results of the EDS analysis for the deposited films are shown in Fig. 1, where the relative indium concentration is plotted as a function of the indium sputter gun power. The indium concentration in the films increases with indium gun power, but in a highly nonlinear manner. For the films deposited at −50 V bias, the initially linear increase undergoes a sharp transition to higher indium concentrations at about 40 W. The indium concentration in the corresponding −150 V bias films is markedly lower, however, again there is a sharp transition to higher indium contents. This transition occurs in the range of 40–90 W, after which there is a saturation of indium content. The lower In content in the −150 V samples, compared to the −50 V bias films, is likely due to the higher preferential sputtering of indium at the substrate due to the higher bias level. The transition to the higher indium contents also has an effect on the surface roughness of the film. Films at the lower indium levels were smooth and highly reflective, whereas films at the higher indium contents were black and rough in appearance. This effect is shown in Fig. 2, where SEM images are shown for films 180-50/150, which had a smooth surface, and 180-90/150, which appeared very rough. Because of this very rough surface of the higher indium concentration films, they were judged as unsuitable for nanoindentation testing.
Relative indium concentration versus indium sputter gun power for films deposited at −50 and −150 V substrate bias. The curves show a highly nonlinear relationship between indium concentration and gun power, and also demonstrate a lower indium content in films deposited at the higher bias.

Scanning electron microscope images for films (a) 180-50/150 (29.3% In) and (b) 180-90/150 (79% In). A smooth surface is obtained at the lower indium content but at the higher indium content the film surface appeared very rough.

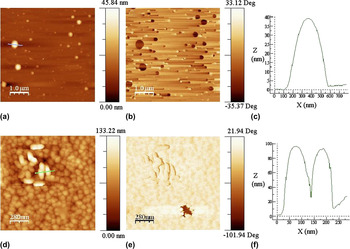
The effect of the application of high versus low bias voltage during the deposition can also be observed when comparing morphological and phase AFM images obtained in tapping mode for the two samples deposited with a 50 W indium power. Figures 3(a) and 3(b) show the formation of semispherical droplets on the surface of the samples obtained with low bias voltage (180-50/50, 65% In), and Fig. 3(c) shows a topographical section of a droplet. These drops can likely be due to the surface segregation of indium because of their high contrast in the AFM phase images [Fig. 3(b)]. In contrast, the sample obtained with the same sputtering rf powers at high bias voltage (180-50/150, 30% In) showed very different features. Figures 3(d) and 3(e) show morphological and phase contrast images, whereas Fig. 3(f) shows a topographical section of the line scan of the area highlighted in Fig. 3(d). There is a smaller amount of In segregated to the surface (as droplets), only in the lower part of the phase image; Fig. 3(e) shows the phase contrast image indicative of indium. In addition, because of the high bias voltage, sputtering effects also occur at the film growth surface. This results in an overall smooth coating surface but with the presence of grainy ellipsoidal “blisters” in some areas of the sample, however, these “blisters” are likely to be in a nitride form, as can be interpreted from the homogeneous contrast in the collected AFM phase image.

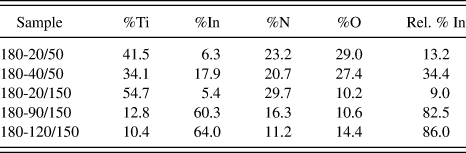
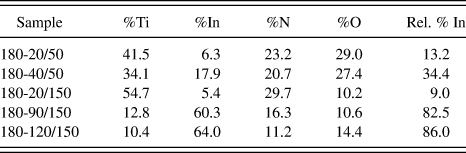
XPS results for selected samples are shown in Table I, showing the atomic percentage of each element, and in the last column the relative percentage of indium, i.e., relative to the combined indium and titanium content. The oxygen and nitrogen concentrations were found to be highly dependent on the substrate bias. Films deposited at −50 V had much higher oxygen levels, typically in the range of 25–30 at.%. For films deposited at −150 V, the range was generally 10–12 at.%. Film 180-20/150 had a gold color and was close to a lightly alloyed TiN sputter deposited film in terms of composition and nitrogen content. The nitrogen content decreased significantly as the indium content increased. Separate experiments conducted on the deposition of indium only in the N2-containing environment showed only metallic indium with no indication of InN formation. Therefore, it is not surprising that the higher indium content films would have lower nitrogen levels. Table I also shows the relative percentage of indium calculated based on the XPS data. These values were close to those found by EDS analysis, except for the 180-20/150 film, which was 9.0 by XPS and 5.1 by EDS; however, as noted above the XPS analysis is based on a very small In 4d peak, which results in a high uncertainty.
X-ray photoelectron spectroscopy (XPS) analysis of selected samples.
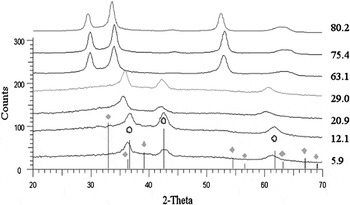
The XRD results are shown in Fig. 4 for the −50 V bias samples and in Fig. 5 for the −150 V bias samples. For the −50 V samples, the first four films show a set of three peaks, which correspond to the (111), (200), and (220) peaks or rocksalt-structured TiN (as indicated by the open circles). The peaks are shifted from the expected TiN peaks, most notably for the higher indium concentrations of 20.9 and 29.0%. In these cases, the peak shift is to the left (lower 2θ) which indicates an increase in the lattice size. Because In (atomic radius = 0.166 nm) is a larger atom than Ti (0.147 nm), this increase in lattice size would be expected due to alloying effects. Based on a Vegard’s law calculation using these atomic radii and a composition of 29 relative% In, a lattice parameter of 0.435 nm is expected, which compares very favorably to the 0.438 nm obtained from the XRD spectrum based on the (111) peak location of 2θ = 35.5°.
X-ray diffraction scans for films deposited at −50 V bias. The line positions for TiN (ο) and In (⋄) are shown. For films with 29% indium and below, the peak positions are generally consistent with the rocksalt–TiN structure.

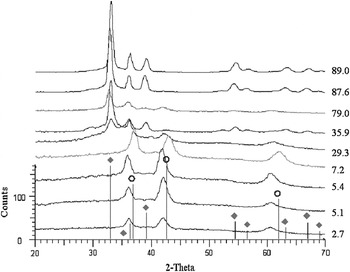
X-ray diffraction (XRD) scans for films deposited at −150 V bias with line positions shown for TiN (ο) and In (⋄). Films with lower indium content show structures similar to TiN, but at higher indium content the hexagonal indium structure dominates.

The XRD patterns for the remaining films deposited at −50 V reveal a change in crystal structure. Examination of Fig. 1 shows that these three films have compositions above the transition to higher indium concentrations. This new structure is inconsistent with peaks from either TiN or hexagonal indium (indicated by solid diamond symbols), as shown in the figure. Analysis was then carried out by attempting to match the pattern to one in the PDF (International Center for Diffraction Data) for Ti–In alloys, nitrides, and oxides, but no matches were found. The location of the first peak in these patterns, near 29.7°, is below that of the first peak of either TiN or indium. This indicates that a more complex superstructure with a larger unit cell has formed from the elements present. Assuming this to be an fcc-based superstructure, with the first peak shown as (111), an average lattice parameter (averaged over the four peaks shown) of 0.510 nm was calculated. However, consistency was good for the first two peaks (giving a = 0.525 ± 0.05 nm) and for the latter two peaks (a = 0.4885 ± 0.015 nm), but not for all peaks together. It is possible that the four peaks observed are from two different phases with different lattice constants.
Figure 5 shows patterns for the films deposited using a −150 V substrate bias. The first four films have peaks consistent with TiN but again shifted to lower angles. The fourth pattern, for 7.2% In, is closer to TiN, indicating a possible precipitation of indium from the TiN, although no indium peaks were observed. Within and above the compositional transition (29.3–89% In), the overall structure again changes. In this case, the highest indium contents (87.6 and 89.0% In) match well to the hexagonal metallic indium structure. The remaining three patterns (29.3, 35.9, and 79.0% In) show peaks from both In and TiN-structured phases. However, only the 29.3% In film shows substantial peaks from both phases; the remainder have primarily the indium structure. Again, referring to Fig. 1, this shows that the lower plateau (up to 40 W or 7.2% In) samples have a structure similar to TiN, that the upper plateau samples have a hexagonal In-based structure, and that the two samples within the transition between these plateaus have mixed TiN–In structures. It is interesting to note that the phase observed in the upper plateau of the −50 V samples was not observed in any of the −150 V samples.
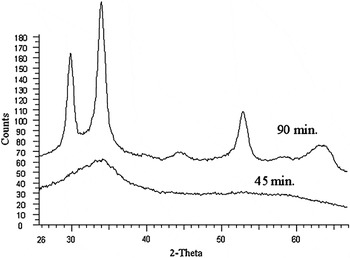
In addition to the bias effects described above, it was also found that the film thickness had an influence on the crystal structure. Figure 6 shows two films deposited under identical conditions of 180 W Ti, 45 W In, and −50 V substrate bias. One film was deposited for 90 min, while the other was for only 45 min. The film from the 45-min deposition had an amorphous structure, whereas the film deposited for the longer time was crystalline. This suggests a competition between crystallization and surface energy. The crystallization may result in either faceting or crystallographic planes on the surface that have higher energy that can be reduced by maintaining an amorphous structure. However, at some point the bulk energy driving crystallization becomes large enough to overcome any surface energy difference.
XRD scans for films deposited under identical conditions (180 W Ti, 45 W In, and substrate bias of −50 V) but different times. The upper curve is for a film deposited for 90 min, whereas lower scan shows results for a film deposited for 45 min.

B. Mechanical and tribological properties
Nanoindentation results showed that the films generally had very low hardness, with values ranging from 5 to 7 GPa for the −50 V bias films and from 7 to 12 GPa for the −150 V bias films. Among the latter films, those with the lowest indium content showed the highest hardness levels. Given that indium is a very soft metal, it is not surprising to see that it reduced the hardness when added to TiN.
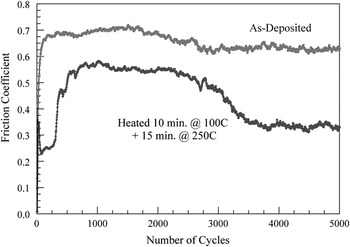
Samples deposited on 440C stainless steel substrates were evaluated using a pin-on-disk test instrument to determine friction coefficients and wear resistance. All samples were run using an alumina counterface in the form of a 6.25-mm-diameter ball. Samples were run at a speed of 200 rpm and a load of 1 N. Samples were typically run for a duration of 5000 cycles. It was generally observed that the films exhibited limited wear resistance, with most films breaking down in less than 2000 cycles, at which point alumina ball was in contact with the steel surface. Figure 7 shows a friction trace for sample 180-40/50. In the as-deposited state, the film quickly wears through and gives friction coefficients in the 0.6–0.7 range for the remainder of the test.
Sample friction coefficient traces for sample 180-40/50 in the as-deposited state (upper curve) and after heating for 10 min at 100 °C and an additional 15 min at 250 °C. In the as-deposited state, the film quickly wears through and gives friction coefficients in the 0.6–0.7 range for the remainder of the test, but after heating a lower friction coefficient is obtained.

In an attempt to improve this result, experiments were conducted on films subject to short-term heating. The concept was that rapid diffusion of indium to the surface would reduce friction (at least in samples with lower indium contents). Because indium has a melting point of 156.6 °C, we first heated below the melting point, at 100 °C for 10 min. Noting some improvement, we then heated samples for an additional 15 min at 250 °C. As shown in Fig. 7, heating this sample in this manner reduced the friction coefficient.
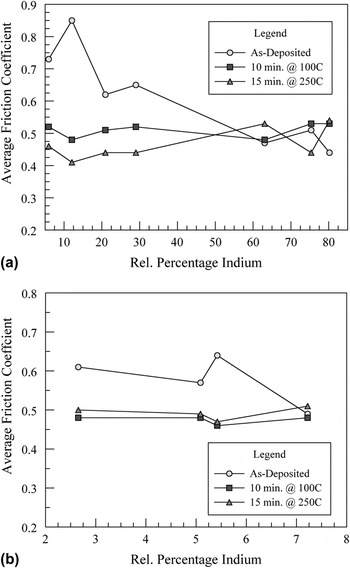
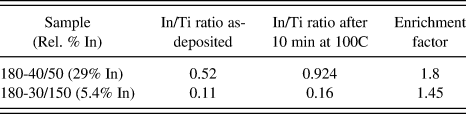
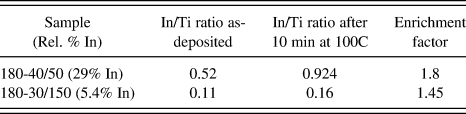
Figure 8(a) shows the average friction coefficients for all samples for films deposited at −50 V bias. Separate curves are shown for the as-deposited state, after heating for 10 min at 100 °C, and then for an additional 15 min at 250 °C. Films with lower indium contents heated at 100 °C showed a higher reduction in average friction than those with higher indium contents. Heating at 250 °C gave additional improvement for the lower indium concentrations. However, it can also be noted that for the heated samples, the average friction coefficient did not change much with indium content and that heating had no effect on films with greater than 60% indium. Figure 8(b) shows similar data for several films deposited with −150 V bias. Again, some reduction was realized on heating, but at 7.2% In (as well as higher In contents), no effect of In was found. These results suggest that for the lower In-content films, heating causes the diffusion of In to the surface where it reduces friction. However, for higher In-content films, this diffusion is unnecessary. To further examine this hypothesis, several samples were examined using XPS both before and after heating for 10 min at 100 °C. Samples were analyzed after 10 min of ion etching (4 kV, 15 mA), and film compositions were determined. Table II shows the In/Ti ratios calculated from this data, as well as an enrichment ratio, which is the In/Ti ratio for the heated sample relative to the as-deposited one. For both samples, the surfaces were enriched in indium with the −50 V sample exhibiting the higher enrichment factor.
(a) Average friction coefficients for all samples (averaged over all data) for films deposited at −50 V bias and (b) for films deposited at −150 V bias. Separate curves are shown for the as-deposited state, after heating for 10 min at 100 °C, and then an additional 15 min at 250 °C. Films with lower indium contents generally showed reductions in friction coefficients, whereas at higher indium contents little improvement was obtained.

XPS analysis of selected samples subjected to thermal treatments.
The reduced average friction coefficients cannot be completely ascribed to the presence of the film since, as noted above, the wear lives of the films were relatively short. However, it is proposed that in the early stages of the test, some of the indium or an indium-containing compound is transferred to the ball, giving lower friction coefficients despite exposure of the underlying steel substrate. This would occur in higher In-content films and be promoted by heating of the sample and segregation of In to the surface in cases where the overall In content is low.
IV. DISCUSSION
In this study, we have examined the concept of combining a hard coating material, TiN, with indium, which can act as a solid lubricant. Ti–In–N films were deposited by reactive codeposition from separate Ti and indium targets over a range of indium concentrations. It was found that the film composition is highly nonlinear with sputter gun power, with upper and lower plateaus in indium content clearly identified. The substrate bias also had a significant effect, and the higher bias level reduced the indium (and oxygen) concentration. The crystal structure of the films reflected these observations. For both −50 V and −150 V bias films at low indium concentrations, the films were effectively TiN alloyed with indium. At higher concentrations and at −50 V bias a new crystal structure formed, whereas at −150 V bias, films had a structure similar to metallic hexagonal indium.
For tribological purposes, the benefit of indium is likely to be realized only if indium is in the pure metallic state. As a solid lubricant, indium works by virtue of its low shear strength. Within a tribological coating, this benefit could be obtained in two possible ways: (i) creation of a composite coating with separate indium and TiN phases or (ii) by segregation of indium to the surface. In fact, previous work of TiC–AgReference Endrino, Nainaparampil and Krzanowski2, Reference Endrino, Nainaparampril and Krzanowski3 and CrN–AgReference Mulligan, Blanchet and Gall4, Reference Mulligan, Blanchet and Gall5 showed that Ag formed as a separate phase and also had a strong tendency to segregate to the surface. For indium, its ability to form a nitride phase as InN makes fabrication of an TiN/In composite film more difficult. In the present study, such a composite film was not obtained with the possible exception of sample 180-50/150 (29.3 rel.% In). Even in that case, the indium content was relatively high and did not perform well in tribological testing since majority fraction of the hard phase (TiN) would be desired for film durability and wear resistance.
To achieve a more desirable film structure, further manipulation of the deposition parameters will be required. One possibility is substrate heating, which was not done in this study. Another is to alter the nitrogen fraction in the chamber during deposition. A reduced N2 fraction may encourage TiN formation separately from In. However, the presence of oxygen in the chamber, when depositing under typical high-vacuum conditions, may complicate this effect. If the oxygen content is too high, the phase formed could still be a Ti–In oxynitride compound. Biasing the substrate reduces oxygen and indium content significantly and reduces the segregation of the soft lubricant to the surface as a soft semispherical drop, so this may be another route to alter film structure and morphology during the deposition.
V. CONCLUSIONS
(i). Deposition of Ti–In–N by magnetron sputtering showed that the indium content in films was not a linear function of indium gun power. For each bias level investigated (−50 and −150 V), the composition versus gun power curves showed both upper and lower plateaus.
(ii). The substrate bias strongly influenced the indium content in the films, with higher bias causing a corresponding reduction in indium content, and a plateau occurring at a higher gun power.
(iii). Film structures undergo transition between upper and lower indium plateaus: fcc structures are observed at the lower plateau and indium (−150 V) or mixed (−50 V) fcc structures at the upper plateau.
(iv). AFM images obtained in tapping mode showed the formation of semispherical drops on the surface of the samples obtained with low bias voltage, while at high bias voltage showed an overall smooth coating surface with the presence of grainy ellipsoidal “blisters” in some areas of the sample.
(v). Hardness levels were generally low (5–12 GPa) and decreased due to indium additions.
(vi). The pin-on-disk test results showed relatively low wear resistance but improved by heating films in the 100–150 °C temperature range.
ACKNOWLEDGMENTS
M. Nowicki and J. Krzanowski gratefully acknowledge support for this work from the National Science Foundation, grant no. DMII-0423329. The authors thank L. Vázquez for performing the AFM measurements. This work was also partially supported by the Spanish MICINN through projects FIS200912964-C05-04 and CSD2008-00023.