Implications
The estimated genetic parameters of reproduction and production traits are important to optimise breeding programmes to improve the sustainability of pig production with respect to economics and animal welfare. The study showed that genetic correlations are changing substantially due to genetic selection. In the dam line, the unfavourable genetic correlation of piglet survival with number of piglets born in total emphasises the importance of selection for piglet survival. In the sire line, the undesirable correlation of piglet survival with backfat thickness suggests a reduced emphasis of selection for backfat thickness combined with stabilising selection for piglet survival.
Introduction
A review of piglet survival has shown that piglet mortality from birth to weaning, internationally, is in the range from 10% to 25% (Alonso-Spilsbury et al., Reference Alonso-Spilsbury, Ramírez-Necoechea, González-Lozano, Mota-Rojas and Trujillo-Ortega2007). In the UK, recent figures indicate a mean stillbirth rate of 6.7% and mean mortality of live born pigs before weaning of 12.6% (BPEX, 2008), which involves a considerable economic loss for pig producers. The current selection pressure on litter size and lean tissue growth may exacerbate piglet mortality (Leenhouwers et al., Reference Leenhouwers, Knol and Van der Lende2002). Pig producers have tried to increase piglet survival through changes to husbandry and housing, such as introducing farrowing crates, but a limit in increase of survival due to these factors has apparently been reached (Edwards, Reference Edwards2002). Recently considerable research has been carried out to enhance piglet survival by genetic improvement. Several studies over the years looked at the survivability of piglets at birth and from birth till weaning and research has been carried out to determine the heritabilities of traits related to piglet survival (e.g. Rydhmer et al., Reference Rydhmer, Lundeheim and Canario2008; Su et al., Reference Su, Sorensen and Lund2008). These heritabilities are generally low, but the genetic variation is large enough to provide improvement through breeding. Correlations between survival traits and reproduction traits show contradictory results in the literature (Serenius et al., Reference Serenius, Sevón-Aimonen, Kause, Mäntysaari and Mäki-Tanila2004b; Rosendo et al., Reference Rosendo, Druet, Gogue, Canario and Bidanel2007b; Su et al., Reference Su, Lund and Sorensen2007), if considered at all, and there are few reports of correlations between piglet survival traits and production traits (Hermesch et al., Reference Hermesch, Luxford and Graser2000c; Knol, Reference Knol2001; Serenius et al., Reference Serenius, Sevón-Aimonen, Kause, Mäntysaari and Maki-Tanila2004a).
The aim of our study was threefold. Firstly, heritabilities of piglet survival traits were estimated, and their genetic associations with other reproduction traits such as number of piglets born in total (NBT) and number of piglets born alive (NBA), as well as production traits such as average daily gain (ADG) and backfat thickness (BF) were estimated. Secondly, the difference in genetic parameters for reproduction and production traits in a sire line and a dam line that originated from the same breed, but differed in their breeding goal, were examined. Thirdly, by changing the base population through a combined restriction of depth of the pedigree and performance data (to recent years), it was investigated how genetic parameters and associations between traits changed within line due to the selection emphasis on different traits. A Bayesian approach was used to estimate genetic variances and covariances between traits to obtain more specific information of the precision of the estimates using the posterior distribution of the genetic parameters.
Material and methods
Approximately 25 years ago, the British pig breeding company JSR Genetics separated their Large White breed into two different breeding lines: one line selected primarily for production traits and used as sire line and a second line selected with greater emphasis on reproduction traits and used as dam line. For each line three datasets were available, containing information on reproductive and production performance as well as causes of piglet death. Reproductive performance data were available from April 1992 till September 2006 for the sire line (4713 litters), and from June 1990 till January 2007 for the dam line (14836 litters). Data on production performance (i.e. information for the growing and finishing phases) were available from April 1991 till February 2007 in both the sire line (58329 pigs) and the dam line (108912 pigs).
In total, eight different traits were considered for the analysis: two mortality traits (percentage of stillborn piglets (SB) and percentage of piglets dead from birth till weaning (DW)), three litter traits (NBT, NBA and number of piglets weaned (NW)) and three production traits (ADG in kg/day, BF in mm and rib muscle depth in mm (MD)). MD was only measured in the sire line. SB was calculated as the percentage of piglets stillborn out of the number of piglets born in total, while DW was calculated as the percentage of piglets that died from birth till weaning out of the litter size after cross-fostering (i.e. including piglets fostered on and excluding piglets fostered off). Piglets for both lines entered the performance test on average at an age of 95 days. Piglets in the sire line weighed on average 44 kg at the start of the test and 90 kg at the end of the test, and spent on average 54 days on test; piglets in the dam line weighed on average 43 and 91 kg, respectively, and were on average 55 days on test. The performance test was between 40 and 91 kg so that ADG was adjusted for small differences from both of these targets weights and BF and MD were adjusted for an end of test weight of 91 kg. The two mortality and three litter size traits will be referred to as reproduction traits and the three growing finishing traits referred to as production traits.
Furthermore, the datasets contained information on several systematic effects, namely batch, service type, parity, gestation length and weaning period. Batches based on farrowing unit, year and season were fitted in the model for reproduction performance. Observations for the sire line came from four different farrowing units and for the dam line from 11 farrowing units, whereby three units were present in both lines. Management practices were standardised across the company and hence did not differ between units. The seasonal effect was determined by splitting a 12-month period in two seasons, April to September and October to March. Batches based on sex, production unit, year and season, which was the year divided into quarterly seasons, were fitted in the model for production performance. Animals for the production data came from three different production units for the sire line and five for the dam line, whereby one unit was present in both lines. Service type was either natural service, on farm artificial insemination (AI), or AI from an AI station. In the sire line parities one to five were considered as separate classes and all sows with six or more parities were grouped together. In the dam line parities one to seven were considered as separate classes and all sows with eight and more parities were grouped together. Gestation length in days was grouped as ⩽111, 112, …, 118, ⩾119 for both lines. Weaning period in days was grouped as ⩽16, 17, …, 35, ⩾36 for the sire line and ⩽11, 12, …, 36, ⩾37 for the dam line. Cross-fostering was applied 2 days after birth and occurred in 42% of the litters in the sire line and 37% of the litters in the dam line, with on average three piglets per litter cross-fostered in these litters. Whenever possible, litters were cross-fostered up or down into groups of 12, or the closest possible arrangement, and aimed to minimise the number of piglets moved and to mix animals of similar size. Cross-fostering practices were consistent across farrowing units and piglets were only cross-fostered onto sows of the same genetic line, so no cross-fostering occurred between the animals in the two lines. Information regarding cross-fostering in the dataset was restricted to the number of piglets fostered on or off per sow, without information of their biological mother or nurse sow, respectively, and could therefore not be accounted for in reproduction traits measured at weaning. Connectedness of the datasets was high; 70% (500 out of 711) of the sires in the sire line had offspring in both the reproduction and production dataset, accounting for 98% of the litters and 87% of the animals with production records; 67% (718 out of 1065) of the sires in the dam line had offspring in both datasets, accounting for 92% of the litters and 93% of the animals with production records. The 4713 litters in the sire line were from 2928 sows, with 60% of the sows having only one litter in the reproduction dataset and the remaining 40% of the sows up to seven litters (average 1.6 parities/sow). Production data were available for 1924 of these 2928 sows (66%). The 14836 litters in the dam line were from 7724 sows and 49% of the sows had only one litter in the reproduction dataset, whilst 51% of the sows had up to eight litters (average 1.9 parities/sow). Production performance data were available for 5504 of these 7724 sows (71%).
Fixed effects were tested for significance using the procedure MIXED (SAS, 2002). Based on this preliminary analysis, the following fixed effects were included in the models for corresponding traits: batch effect for the production traits ADG, BF and MD; batch, service type, parity and gestation length for the reproduction traits NBT, NBA and SB; batch, service type, parity, gestation length and weaning period for NW and DW. Models to estimate genetic parameters were for the reproduction traits

and for the production traits

where y is the vector of observations of the traits, b the vector of fixed effects (including effects described earlier), a the vector of additive genetic effects, c the vector of the permanent environmental effects of the sow and e the vector of residuals. X, Z and W are incidence matrices relating the vectors b, a and c with y. For the multiple trait analysis, models (1) and (2) were combined. The assumed (co)variance structure for reproduction data was
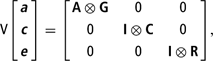
where A and I are the additive genetic relationship matrix and identity matrix, respectively. G, C and R represent the variance and covariance matrices of direct additive genetic effects, permanent environmental effects of the sow and residual environmental effects, respectively. For production traits the permanent environmental effects and its variances need not be considered because those traits were measured only once.
Pedigree files were checked with Relax2 (Strandén and Vuori, Reference Strandén and Vuori2006) for cycles, missing animals and consistency. After checking, the pedigree files were matched to the animals in the dataset to eliminate superfluous animals in the pedigree. Pedigrees for animals in the sire line were traced back as far as 1987, while pedigrees for animals in the dam line were traced back to 1985 and no overlap between animals in the two pedigree files occurred. No limit was set for the number of generations included in the pedigree files, so depending on the birth year of the animal up to sixteen generations were available. The two pedigree files contained 60 021 and 112205 animals for the sire and dam line, respectively. Records in the sire line included 602 sires and 3304 dams with offspring; records in the dam line included 800 sires and 6236 dams with offspring.
Datasets were analysed based on a Bayesian approach using the programme GIBBS2F90 (Misztal et al., Reference Misztal, Tsuruta, Strabel, Auvray, Druet and Lee2002). Due to computational limitation the traits were first genetically analysed in two groups per line, one group containing the two mortality traits and three litter traits, the other group containing the production traits. After some exploratory analyses, chains of 500000 to 800000 samples were used, depending on the (combination of) traits, with a burn-in of 50000 to 250000 and a lag of 50. Thus marginal posterior distributions were estimated with a minimum of 5000 samples each. Convergence was tested using the Geweke criterion (Geweke, Reference Geweke1992) and/or Raftery and Lewis criterion (Raftery and Lewis, Reference Raftery and Lewis1992). Cross-fostering from birth till weaning could not be accounted for and models containing these two traits often did not converge, therefore the traits NW and DW were excluded from further analyses. Current cross-fostering practices have a high influence on genetic parameters for traits measured at weaning and not applying cross-fostering could be of advantage to estimate reliable parameters for these traits. Genetic parameters of traits were then estimated in one single multiple trait analysis, containing all six traits in the sire line and all five traits in the dam line. Single trait analyses showed that this multiple trait analysis did not inflate the phenotypic variances (results not shown). In order to examine the change of genetic parameter within line, in a further analysis the dataset was restricted to only include records and litters of animals born in the year 2002 or later, which will be referred to as the ‘restricted dataset’ as compared to the ‘full dataset’. Additionally, the pedigree was restricted to animals born in the year 2000 and later, to change the base population from 1985 to 2000. Genetic analysis of the restricted datasets was performed for the dam line only due to the low number of records in the sire line.
Results
Descriptive results
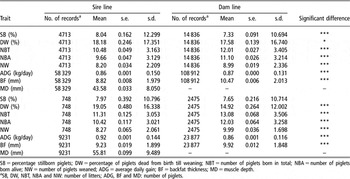
The mean SB and DW was 8.0% and 18.2%, respectively, in the sire line, and 7.3% and 17.6%, respectively, in the dam line (Table 1). The differences of these traits between the two lines were significant at P < 0.001 for SB and P < 0.05 for DW. In the restricted dataset, SB was still 8.0% in the sire line, but slightly increased in the dam line at 7.7%. DW increased in the sire line by approximately 1%-point to 19.1%, while it decreased in the dam line by almost 3%-point to 14.9% (P < 0.001). Litter sizes at different stages were also significantly different between the two lines. The dam line, selected mainly for reproductive performance, had on average 12.0 NBT and 11.1 NBA, and approximately 1.5 more piglets per litter born than the sire line (P < 0.001 for NBT and NBA). The difference between these two lines in NW was slightly less, with 0.8 more piglets per litter weaned in the dam line than in the sire line (P < 0.001). In the restricted dataset, means for NBT, NBA and NW increased compared to the full dataset, but showed a higher increase in the dam line compared to the sire line. Consequently, the difference between the lines increased to approximately 1.7 piglets per litter for all three traits (P < 0.001 for NBT, NBA and NW). Differences in ADG were small, 0.86 kg/day in the sire line compared to 0.87 kg/day in the dam line, but still significantly different between the lines (P < 0.001). In the restricted dataset the ADG in the sire line increased to 0.92 kg/day, while the ADG in the dam line stayed at almost the same magnitude. Selection pressure on productive performance in the sire line has led to a significantly lower value for BF in this line (8.8 mm) compared to the dam line (10.5 mm) (P < 0.001), but this difference was less notable, though still highly significant (P < 0.001), in the restricted dataset (9.2 mm in the sire line v. 9.9 mm in the dam line). This reflects the changing emphasis in the selection index, with a reduced emphasis on this trait once the average BF is below 10 mm in the UK.
Summary statistics for traits in sire line and dam line using all information (top) or information restricted to animals born in the year 2002 or later (bottom)

SB = percentage stillborn piglets; DW = percentage of piglets dead from birth till weaning; NBT = number of piglets born in total; NBA = number of piglets born alive; NW = number of piglets weaned; ADG = average daily gain; BF = backfat thickness; MD = muscle depth.
aSB, DW, NBT, NBA and NW: number of litters; ADG, BF and MD: number of piglets.
Separate analysis of production and reproduction traits
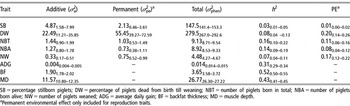
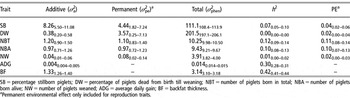
In the first genetic analysis, traits were analysed in two groups per line, one group containing the two mortality and three litter size traits, the other group containing the production traits. Tables 2 and 3 present the additive (σ 2a), permanent environmental (σ 2pe) and total phenotypic (σ 2phen) variances with standard errors for all eight traits in the sire and dam line. The reproductive traits (SB, DW, NBT, NBA and NW) had repeated measurements of traits as opposed to the production traits (ADG, BF and MD), which were measured only once per animal. Therefore, a permanent environmental variance based on the sow was included for the five reproduction traits, while none was included for the production traits. MD was only measured in the sire line.
Estimates of variance components, heritabilities and fractions of the permanent environmental effect (PE) of the sow for reproduction and production traits in the sire line (95%-highest posterior density interval as subscript)

SB = percentage stillborn piglets; DW = percentage of piglets dead from birth till weaning; NBT = number of piglets born in total; NBA = number of piglets born alive; NW = number of piglets weaned; ADG = average daily gain; BF = backfat thickness; MD = muscle depth.
aPermanent environmental effect only included for reproduction traits.
Estimates of variance components, heritabilities and fractions of the permanent environmental effect (PE) of the sow for reproduction and production traits in the dam line (95%-highest posterior density interval as subscript)

SB = percentage stillborn piglets; DW = percentage of piglets dead from birth till weaning; NBT = number of piglets born in total; NBA = number of piglets born alive; NW = number of piglets weaned; ADG = average daily gain; BF = backfat thickness.
aPermanent environmental effect only included for reproduction traits.
Phenotypic variances for the production trait ADG were similar in both the sire and dam line (less than 0.01% difference), while the phenotypic variance for BF was 16% higher in the sire line than in the dam line. The phenotypic variances for NBT and NBA were 11% and 5% lower in the sire line, respectively, and for NW 15% higher in the sire line. For SB and DW there were large differences. Total phenotypic variance for SB was 33% higher in the sire line than in the dam line, with a substantially higher residual variance in the sire line but additive genetic and permanent environmental variances that were twice as high in the dam line as in the sire line. Phenotypic variance for DW was 39% higher in the sire line than in the dam line. The additive genetic and permanent environmental variances of DW in the dam line were very small compared to those in the sire line, which may be influenced by cross-fostering of piglets.
Heritability estimates for reproduction traits were overall low, both in the sire and dam line (Tables 2 and 3). In general these heritabilities were slightly higher in the sire line than in the dam line (0.08 v. 0.00 for DW, 0.16 v. 0.12 for NBT, 0.14 v. 0.10 for NBA and 0.07 v. 0.01 for NW). In contrast, the heritability for SB in the dam line (0.07) was higher than the heritability in the sire line (0.03).
Heritability estimates for production traits were substantially higher than those of reproduction traits. These heritabilities were moderate to high, ranging from 0.30 for ADG in the dam line to 0.52 for BF in the sire line. Heritabilities for ADG were similar for both lines (0.31 v. 0.30) but for BF the heritability in the sire line (0.52) was much higher than in the dam line (0.42).
Analysis of production and reproduction traits using all pedigree information
Tables 4 and 5 present the results of the genetic and phenotypic correlations of the combined analysis of production and reproduction traits for the sire and dam line excluding the traits NW and DW because of influence due to cross-fostering. Heritabilities based on this analysis, which included all production and reproduction traits, were slightly lower than those estimated in separate analyses of reproduction (model 1) and production (model 2) traits. Genetic and phenotypic correlations between the two litter size traits were high, ranging from 0.92 to 0.97, while genetic and phenotypic correlations between SB and the two litter size traits were, by and large, not significantly different from zero.
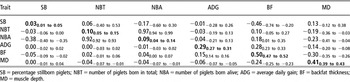
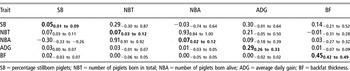
Heritabilities (diagonal, bold), genetic correlations (above diagonal) and phenotypic correlations (below diagonal) for traits of the sire line (95%-highest posterior density interval as subscript) based on a base population of animals born in 1987 and observations of animals born in 1991 or later

SB = percentage stillborn piglets; NBT = number of piglets born in total; NBA = number of piglets born alive; ADG = average daily gain; BF = backfat thickness; MD = muscle depth.
Heritabilities (diagonal, bold), genetic correlations (above diagonal) and phenotypic correlations (below diagonal) for reproduction and production traits of the dam line (95%-highest posterior density as subscript) based on a base population of animals born in 1985 and observations of animals born in 1990 or later

SB = percentage stillborn piglets; NBT = number of piglets born in total; NBA = number of piglets born alive; ADG = average daily gain; BF = backfat thickness.
Both the genetic and phenotypic correlations between the production traits ADG and BF were higher in the sire line than in the dam line (0.28 v. 0.07 and 0.15 v. 0.03, respectively). All genetic and phenotypic correlations among production traits were unfavourable, except the correlations between BF and MD.
Genetic correlations of reproduction traits with production traits in the sire line were generally not significantly different from zero, except for the genetic correlations of BF with SB and NBA and of MD with NBT and NBA. In the dam line, only the unfavourable genetic correlation of SB with ADG was significantly different from zero. The genetic correlation between SB and BF was negative in both lines, though much more pronounced in the sire line (−0.46) than in the dam line (−0.08).
Analysis of production and reproduction traits using restricted pedigree information
In order to identify the change of genetic parameters within line, the base population of the dam line was changed to pigs born in the year 2000, which resulted in some different genetic parameters compared to the full dataset (Table 6). Heritabilities for reproduction traits were again low; 0.05, 0.07 and 0.07 for SB, NBT and NBA, respectively. These heritabilities were slightly lower than the heritabilities in the full dataset. Heritabilities for production traits were similar to those in the full dataset.
Heritabilities (diagonal, bold), genetic correlations (above diagonal) and phenotypic correlations (below diagonal) for reproduction and production traits of the dam line (95%-highest posterior density interval as subscript) based on data restricted to a base population of animals born in 2000 and observations of animals born in the year 2002 or later

SB = percentage stillborn piglets; NBT = number of piglets born in total; NBA = number of piglets born alive; ADG = average daily gain; BF = backfat thickness.
Correlations of NBA with NBT were, as before in the full dataset, highly positive, but correlations of SB with NBT and NBA and correlations between the two production traits were not significant. Genetic correlations of reproduction traits and production traits showed more desirable genetic associations, though none of them were significant. Phenotypic correlations were generally in the same direction as genetic correlations but of lower magnitude. Restricted data of the sire line were too small to result in reliable estimates and are therefore not presented.
Discussion
All analyses in this study were carried out using a Bayesian approach in order to obtain information about the precision of the estimation of the genetic parameter as given as Bayesian confidence intervals. Depending on the trait (or combination of traits for correlations), varying chain lengths were used, with longer chains for correlations of reproduction traits with production traits due to the difference in records (sow/litter v. individual animal information), which increased the time needed for convergence. Due to the large number of traits, not all correlations could be estimated in one single multiple trait analysis per line, and therefore had to be estimated separately for production and reproduction traits. Due to computational limits, few studies in the past have used a Bayesian approach to obtain genetic parameters for datasets of this size, and even now analysis of datasets of this large size took several weeks to be completed.
The present study is unique in the fact that it is based on data from a sire and dam line originating from the same Large White population, divergently selected commencing 25 years ago. Few studies have differentiated between a sire and dam line, and none of them originating from the same breed (Knol et al., Reference Knol, Ducro, Van Arendonk and Van der Lende2002). Studies analysing and comparing different breeds showed that there are clear differences in genetic parameters between breeds (See et al., Reference See, Mabry and Bertrand1993; Roehe and Kennedy, Reference Roehe and Kennedy1995; Su et al., Reference Su, Sorensen and Lund2008). Only a few studies (Ferraz and Johnson, Reference Ferraz and Johnson1993; Hermesch et al., Reference Hermesch, Luxford and Graser2000c; Serenius et al., Reference Serenius, Sevón-Aimonen, Kause, Mäntysaari and Mäki-Tanila2004b) have used data from Large White pigs in their studies to compare different breeds, and none of these studies differentiated between sire and dam line within the breed. The restriction of the dataset of the dam line showed the effect of the change of parameters, given a more recent base population. The change of parameters is expected to be due to change in depth of pedigree and due to use of only recent performance data.
Reproduction traits
Heritabilities for NBT and NBA were 0.10 and 0.09 in the sire line respectively and 0.11 and 0.09 in the dam line. Heritabilities for NBT in literature have varied considerably, ranging from 0.05 to 0.24 (Serenius et al., Reference Serenius, Sevón-Aimonen and Mäntysaari2003; Su et al., Reference Su, Lund and Sorensen2007; Rydhmer et al., Reference Rydhmer, Lundeheim and Canario2008), with most values around 0.10. Moreover, heritabilities of 0.09 for NBA are in accordance with heritabilities for this trait in literature, which range from 0.05 to 0.16 (Rosendo et al., Reference Rosendo, Druet, Gogue, Canario and Bidanel2007b; Su et al., Reference Su, Lund and Sorensen2007; Fernández et al., Reference Fernández, Rodrigáñez, Zuzúarregui, Rodríguez and Silió2008).
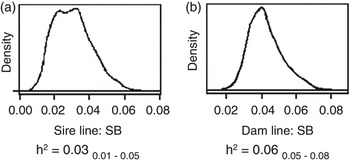
In the present study, piglet survival was defined as SB. As opposed to NBT and NBA, a clear comparison with other studies is more difficult, since piglet mortality or its inverse piglet survival is not always defined in the same way as in this study. Also, survival at birth and survival at various stages pre-weaning are generally considered to be different traits, but not always treated as such. Heritabilities reported in the literature for various survival traits such as survival at birth, survival during early pre-weaning, survival during late pre-weaning and total pre-weaning survival range from 0.01 to 0.13 (Rosendo et al., Reference Rosendo, Druet, Gogue, Canario and Bidanel2007b; Su et al., Reference Su, Lund and Sorensen2007; Roehe et al., Reference Roehe, Shrestha, Mekkawy, Baxter, Knap, Smurthwaite, Jarvis, Lawrence and Edwards2009). Only Knol et al. (Reference Knol, Ducro, Van Arendonk and Van der Lende2002) have reported differences in heritabilities between a sire and dam line and estimated heritabilities for survival at birth of 0.00 to 0.04 and 0.01 to 0.05 in the dam and sire line respectively, and for pre-weaning survival of 0.04 and 0.01 respectively. In the present study, heritability for SB was significantly lower in the sire line (0.03 ± 0.01) than in the dam line (0.06 ± 0.01; see Figure 1a and b).
Marginal posterior distributions, means (h 2) and highest posterior density intervals (as subscript) of the heritability for percentage of stillborn piglets (SB) in the sire line (a) and dam line (b).

In several studies, survival is treated as a character of the piglet and survival traits are analysed at the piglet level, distinguishing between a direct and a maternal genetic effect. Generally estimates for the maternal genetic effects in these studies are higher than the direct genetic effect (Grandinson et al., Reference Grandinson, Rydhmer, Strandberg and Solanes2005; Rydhmer et al., Reference Rydhmer, Lundeheim and Canario2008; Su et al., Reference Su, Sorensen and Lund2008). In this study, survival as SB was analysed at sow level, since individual piglet information was not available. These estimated heritabilities were in the same range as what other studies that analysed survival at the sow level, but using numbers of stillborn piglets as the trait, found (0.02 to 0.12) (Hanenberg et al., Reference Hanenberg, Knol and Merks2001; Serenius et al., Reference Serenius, Sevón-Aimonen, Kause, Mäntysaari and Maki-Tanila2004a and Reference Serenius, Sevón-Aimonen, Kause, Mäntysaari and Mäki-Tanila2004b).
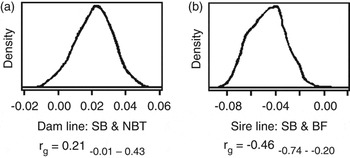
Genetic correlations between the two litter traits NBT and NBA were 0.97 and 0.94 in the sire and dam line, respectively. These correlations are at the upper end of previously reported correlations which ranged from 0.87 to 0.97 (Roehe and Kennedy, Reference Roehe and Kennedy1995; Bouquet et al., Reference Bouquet, Canario, Ligonesche and Bidanel2006; Chimonyo et al., Reference Chimonyo, Dzama and Bhebhe2006). Phenotypic correlations between NBT and NBA were 0.92 in both lines, slightly higher than those in literature (0.87 to 0.88; Bouquet et al., Reference Bouquet, Canario, Ligonesche and Bidanel2006; Chimonyo et al., Reference Chimonyo, Dzama and Bhebhe2006). The genetic correlation of SB with NBT in the dam line was unfavourable at 0.21, while the same correlation in the sire line was not significantly different from zero. Su et al. (Reference Su, Lund and Sorensen2007) found higher genetic correlations, ranging from −0.28 to −0.38 for the genetic correlation between percentage survival at birth and total number born in Landrace and Yorkshire, respectively. Serenius et al. (Reference Serenius, Sevón-Aimonen, Kause, Mäntysaari and Mäki-Tanila2004b) found an unfavourable genetic correlation of 0.29 between SB and total number born in Landrace pigs, but no significant correlation in Large White pigs, similar to the results we obtained in the sire line. In contrast, Rosendo et al. (Reference Rosendo, Druet, Gogue, Canario and Bidanel2007b) found a favourable correlation of −0.37 between SB and total number born in Large White pigs. The genetic correlation of SB with NBA was more similar between the two lines than the correlations for SB–NBT, with −0.17 and −0.13 for the sire and dam line respectively. Estimates of the correlation between SB and NBA reported in the literature are generally favourable, varying from −0.15 to −0.27 for the correlation between SB and NBA (Serenius et al., Reference Serenius, Sevón-Aimonen, Kause, Mäntysaari and Mäki-Tanila2004b) to 0.41 to 0.61 for the correlation between percentage survival at birth and NBA (Su et al., Reference Su, Lund and Sorensen2007). The present study shows that selection pressure on litter size in the dam line may have resulted in the higher undesirable correlation between NBT and SB in the dam line (Figure 2a) as compared to the sire line. Heritabilities for reproduction traits in the restricted dataset were slightly lower than in the full dataset. The change of genetic correlations due to selection was small.
Marginal posterior distributions, means (r g) and highest posterior density intervals (as subscript) of correlations between percentage of stillborn piglets (SB) and number of piglets born in total (NBT) in the dam line (a) and between SB and backfat thickness (BF) in the sire line (b).

Production traits
Heritabilities for production traits were estimated at 0.29, 0.50 and 0.41 for ADG, BF and MD, respectively, in the sire line and 0.29 and 0.42 for ADG and BF, respectively, in the dam line. Heritabilities for ADG and BF were similar to values in literature which ranged from 0.23 to 0.40 for ADG (Ferraz and Johnson, Reference Ferraz and Johnson1993; Serenius and Stalder, Reference Serenius and Stalder2004; Rosendo et al., Reference Rosendo, Canario, Druet, Gogue and Bidanel2007a) and from 0.30 to 0.51 for BF (Knol, Reference Knol2001; Serenius and Stalder, Reference Serenius and Stalder2004; Zumbach et al., Reference Zumbach, Misztal, Tsuruta, Holl, Herring and Long2007). The slightly higher heritability for BF in the sire line compared to the dam line was unexpected because breeding in the sire line primarily focused on reduction of BF, while this was of lesser emphasis in the dam line. The heritability for MD was slightly higher than previously reported heritabilities which ranged from 0.12 to 0.31 (Hermesch et al., Reference Hermesch, Luxford and Graser2000b; Zumbach et al., Reference Zumbach, Misztal, Tsuruta, Holl, Herring and Long2007). Genetic and phenotypic correlations among the production traits were approaching zero in the dam line. In the sire line, genetic correlations for ADG–BF (0.28) and ADG–MD (−0.14) were slightly unfavourable while the genetic correlation of BF with MD was slightly favourable (−0.30). Serenius et al. (Reference Serenius, Sevón-Aimonen, Kause, Mäntysaari and Mäki-Tanila2004b) found correlations between ADG and BF of 0.32 and 0.39 in Landrace and Large White pigs, respectively, and Hermesch et al. (Reference Hermesch, Luxford and Graser2000a) found a slightly lower but still favourable correlation between BF and MD of −0.16 in Landrace and Large White boars. Contrary to our study, Hermesch et al. (Reference Hermesch, Luxford and Graser2000a) based their ADG on the age of the pig, where we based it on weight of the pig. They distinguished between ADG from 3 to 18 weeks of age and ADG from 18 to 22 weeks of age and found desirable correlations between ADG from 3 to 18 weeks and both BF and MD, but undesirable correlations between ADG from 18 to 22 weeks and both BF and MD.
In the restricted dataset of the dam line, in which the selection pressure on BF was much lower than in the sire line, the phenotypic and genetic correlations between ADG and BF showed a slight decrease.
Correlations between reproduction and production traits
Genetic and phenotypic correlations between reproduction traits and production traits were generally low. Selection pressure on BF in the sire line may have resulted in the moderately negative correlation between SB and BF (Figure 2b), which was much lower (but still negative) in the dam line, and the unfavourable correlations for BF–NBT and BF–NBA, which were favourable in the dam line. Knol (Reference Knol2001) found unfavourable correlations of BF with both pre-weaning survival and piglet survival (defined as accumulated farrowing survival and pre-weaning survival) of 0.52 and 0.18, respectively, in a commercial sire line, similar to the correlation we estimated in the sire line. Correlations of ADG with reproduction traits were more pronounced in the dam line than in the sire line, with a low undesirable correlation of ADG with SB in the dam line, which was slightly favourable in the sire line, but correlations of ADG with the two litter size traits were low in both lines. Correlations between ADG and litter size traits in the literature are generally more distinctly negative, with correlations of ADG with NBA up to −0.42, depending on sow parity (Hermesch et al., Reference Hermesch, Luxford and Graser2000c). Additionally, Serenius et al. (Reference Serenius, Sevón-Aimonen, Kause, Mäntysaari and Maki-Tanila2004a) found a favourable correlation between the number of stillborn piglets and ADG, while Knol (Reference Knol2001) found a favourable correlation between piglet survival (farrowing and pre-weaning survival combined) and ADG, but an unfavourable correlation of pre-weaning survival with ADG. Selection pressure on litter size in the dam line may have resulted in these more pronounced correlations with ADG in our analysis as compared to the low correlations in the sire line.
In the restricted dataset, genetic correlations for ADG with litter size traits were slightly to moderately desirable, while the genetic correlation with the mortality trait SB was undesirable. For BF, surprisingly, most correlations were favourable except BF–NBA.
Comparison of the full dataset and the restricted dataset showed how selection pressure on different traits has led to a change in heritabilities and correlations in the dam line. However, low genetic correlations between traits showed that selection pressure on either production traits or reproduction traits still leaves room for improvement of the other trait.
Conclusion
Genetic improvement of piglet survivability without significant reductions performance traits is possible. Heritabilities for survivability and reproduction traits were low, but genetic variation was substantial in these traits and extensive pedigree information can be used to improve the accuracy of breeding values so that genetic improvement is expected to be efficient. Selection on reproduction traits such as NBA will lead to improvement in survival at birth. Genetic correlations between reproduction and production traits were often undesirable in the sire line, except for a weak favourable correlation of SB with ADG. In the dam line most correlations were favourable, though some slightly unfavourable correlations were also present. The unfavourably correlated responses of SB and NBT (dam line) and SB and BF (sire line) indicate the importance of selecting for NBA in the dam line and suggest a reduced emphasis of selection on BF in combination with stabilising selection on a trait such as piglet survival in the sire line. However, in particular in the dam line, undesirable correlations between these traits were relatively low, so that simultaneous improvement of performance traits as well as piglet survival at birth can be achieved.
Acknowledgements
The authors gratefully acknowledge SABRETRAIN Project, funded by the Marie Curie Host Fellowships for Early Stage Research Training as part of the 6th Framework Programme of the European Commission, Defra (LS3103 ‘Genomum’ project), the Scottish Government and SSPCA for funding the research. We also thank all project partners, JSR Genetics Ltd, Grampian Country Food Group, PIC International and Genesis Faraday, for their co-operation.