

Introduction
Common bean (Phaseolus vulgaris L. [Fabaceae]) is amongst the most important food legumes representing 50% of the grain legumes consumed worldwide (McClean et al., Reference McClean, Lavin, Gepts, Jackson and Stacey2008). It is a strategic crop that provides not only household food and income, but also a cheap source of protein, thus conferring nutritional security to poor people in eastern and southern Africa (Katungi et al., Reference Katungi, Farrow, Chianu, Sperling and Beebe2009). As a major legume crop in Ethiopia, it contributes to the income and nutrition of more than 3.3 million smallholder farmers (CSA, 2014). In addition to the direct economic advantages, common bean also plays a significant role in soil fertility replenishment by fixing biological nitrogen in the soil (Herridge and Danso, Reference Herridge and Danso1995), thereby providing sustainability to the farming system, particularly when grown in rotation with cereals.
Ethiopia is the third largest common bean producer in East Africa after Tanzania and Kenya (FAOSTAT, 2012). In 2014, for instance, 520,058 ha of land was allotted to common bean and a total of 621,651 tonnes of grain was produced in Ethiopia (CSA, 2014). Common bean is the second major food legume crop in Ethiopia next to faba bean (Vicia faba L.) in terms of area cultivated and volume of production. However, it is the most important legume for export to countries in Europe and the Middle East (Shaun et al., Reference Shaun, Paschall, Seville, Legesse and Gure2012; CSA, 2014). Despite its importance, the potential of common bean production is rarely attained in tropical and subtropical Africa (including Ethiopia), because of several biotic and abiotic constraints.
Storage insect pests are amongst the most serious problems constraining common bean production in the field and in storage at global level, particularly in the humid tropics and subtropics (Cardona, Reference Cardona, Rick and Graham2004; Keneni et al., Reference Keneni, Bekele, Getu, Imtiaz, Mulatu and Dagne2011). Some reports indicate that without postharvest management, storage insect pests may cause an estimated dry weight loss of 10–40% and up to 70% grain damage in less than 6 months under on-farm storage conditions (Kiula and Karel, Reference Kiula and Karel1985; Paul et al., Reference Paul, Lossini, Edwards and Hilbeck2009). Two species of bean bruchid, namely Acanthoscelides obtectus (Say) and Zabrotes subfasciatus (Boheman) (Coleoptera: Bruchidae), are the most important pests worldwide (Schoonhoven and Cardona, Reference Schoonhoven and Cardona1986; Parsons and Credland, Reference Parsons and Credland2003), the latter causing the most significant qualitative and quantitative losses to stored common bean seeds, not only in Ethiopia (Tadesse et al., Reference Tadesse, Amare, Emana, Tadele and Tadesse2008) but also elsewhere in eastern and central Africa (Nchimbi-Msolla and Misangu, Reference Nchimbi-Msolla and Misangu2002). In the warmer regions of the Central Rift Valley of Ethiopia, this species is known to cause immense damage (Wortmann et al., Reference Wortmann, Kirkby, Eledu and Allen1998) estimated at 38% with an equivalent weight loss of about 3.2% (Negasi, Reference Negasi1994). Getu et al. (Reference Getu, Ibrahim and Iticha2003) reported a grain loss of 60% only after 3–6 months in storage. In addition to the direct losses, the bean seeds are also liable to indirect losses; as, once damaged by bruchids, the common bean seeds are neither fit for planting due to poor germination, nor for food or feed (Aslam, Reference Aslam2004; Haile, Reference Haile2006). Losses also result in an indirect loss of profit, because farmers are forced to sell their beans at low prices immediately after harvest or at considerable price discounts for damaged seeds (Uebersax et al., Reference Uebersax, Kim and Chung1996).
Ethiopian farmers have attempted different control options, including drying of the seed before storage, cleaning of storage structures, admixing of grain with botanical pesticides, using seeds of small cereals or ash, storing of beans in smoke over a fire and treating the seeds with insecticides (Abate and Ampofo, Reference Abate and Ampofo1996; Tadesse et al., Reference Tadesse, Amare, Emana, Tadele and Tadesse2008). However, today, farmers do not often use most of these practices, due to a move towards chemical insecticides (Tadesse et al., Reference Tadesse, Amare, Emana, Tadele and Tadesse2008). Although insecticides can confer effective bruchid control, use of chemicals is not a method of choice for smallholder farmers, because of supply shortages, cost and concerns related to environmental hazards and food safety. Farmers also lack separate storage structures that are suitable for fumigation (Keneni et al., Reference Keneni, Bekele, Getu, Imtiaz, Mulatu and Dagne2011). The development of environmentally safe, sustainable and feasible control measures (such as host plant resistance), is the best option to manage storage bruchids in common bean, particularly amongst smallholder farmers.
The International Center for Tropical Agriculture (CIAT) has developed Mexican bean weevil resistant lines, using a few wild common bean accessions as sources of resistance (Schoonhoven et al., Reference Schoonhoven, Cardona and Valor1983; Acosta-Gallegos et al., Reference Acosta-Gallegos, Quintero, Vargas, Toro, Tohme and Cardona1998). Antibiosis expressed with the adverse effects of seed protein arcelin in the cotyledons of these wild accessions was found to extend the time of adult emergence, growth and life cycle of the insects (Cardona et al., Reference Cardona, Posso, Kornegay, Valor and Serano1989; Minney et al., Reference Minney, Gatehouse, Dobie, Dendy, Cardona and Gatehouse1990; Osborn et al., Reference Osborn, Burow and Bliss1988; Velten et al., Reference Velten, Rott, Petit, Cardona and Dorn2008). Even though promising results were achieved from past breeding efforts (in terms of developing genotypes with arcelin-based resistance) (Beneke, Reference Beneke2010; Cardona, Reference Cardona, Rick and Graham2004; Cardona and Kornegay, Reference Cardona, Kornegay, Clement and Quisenberry1999; Cardona et al., Reference Cardona, Kornegay, Posso, Morales and Ramirez1990; Myers et al., Reference Myers, Davis, Kean, Nchimbi-Msolla and Misangu2001), such efforts have not yet resulted in a release of any commercial variety for wider production. It is, therefore, essential to search for additional sources of the Mexican bean weevil resistance from the local landraces that are easier to use in the breeding programme. Some reports have indicated that Ethiopia has a wealth of genetic diversity in common bean (Asfaw et al., Reference Asfaw, Blair and Conny2009), but these genetic resources have not yet been systematically assessed for developing Mexican bean weevil resistance. The objective of this study was, therefore, to evaluate the Ethiopian common bean landrace collections, released varieties, breeding lines, and elite genotypes for resistance to the Mexican bean weevil.
Materials and methods
Plant material
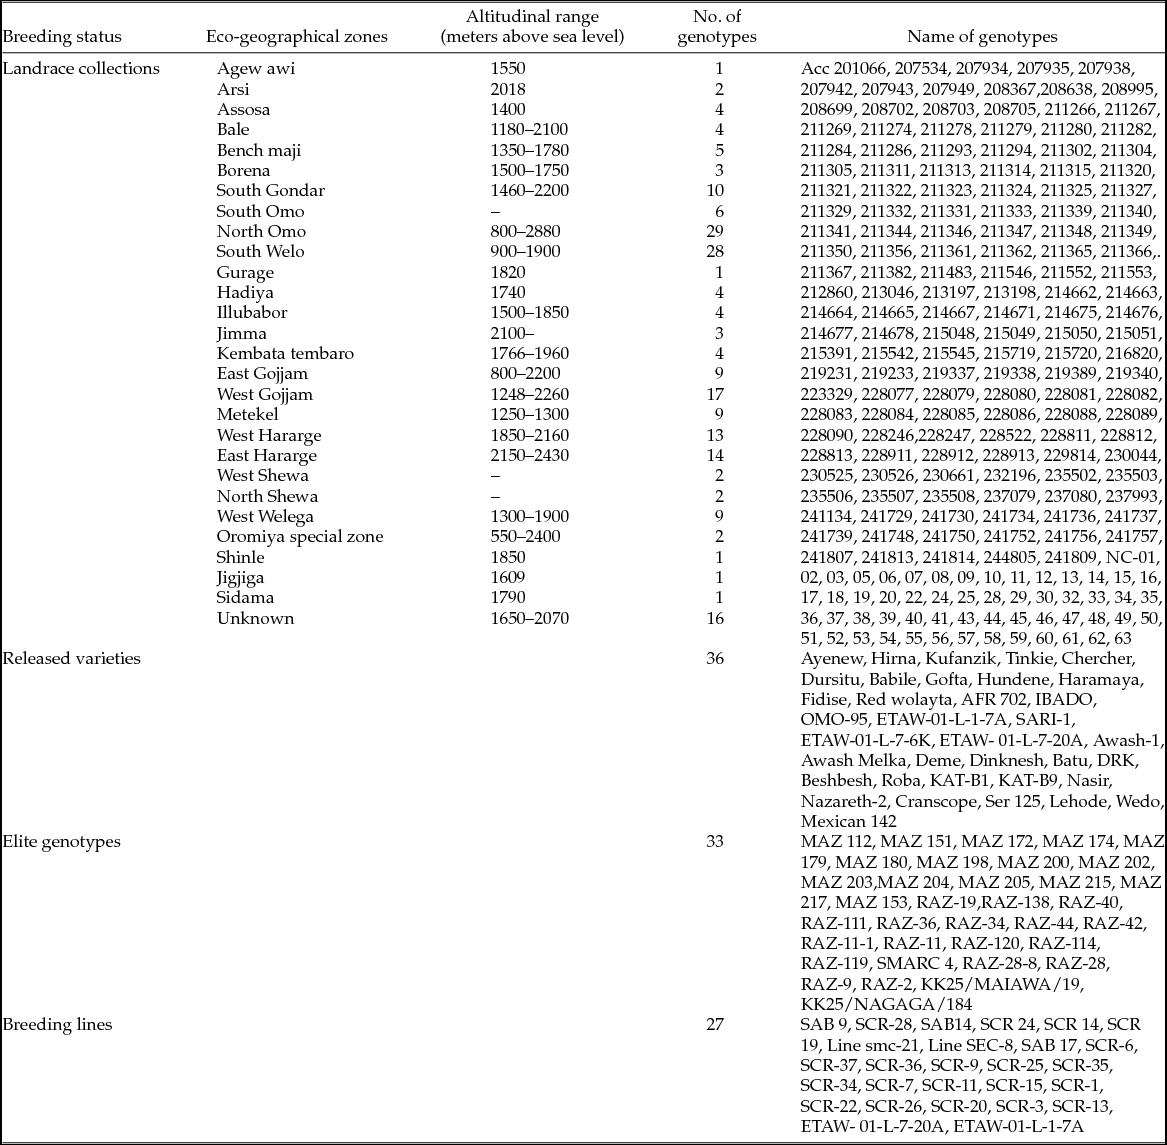
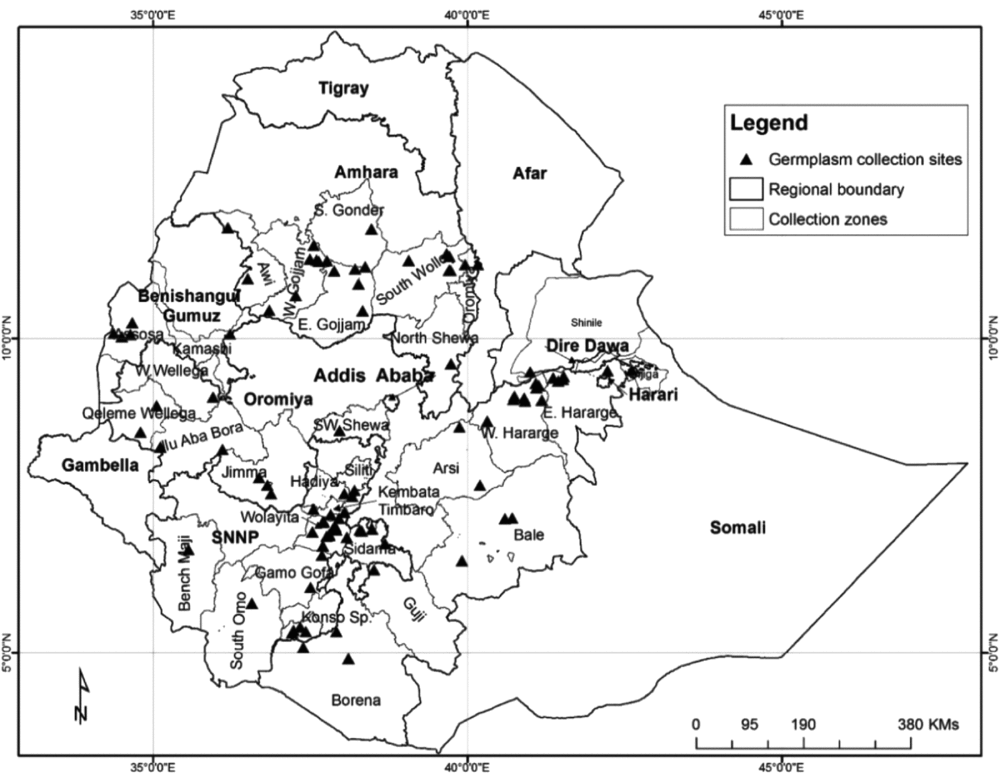
A total of 300 common bean entries (204 landrace collections, 34 released varieties, 27 breeding lines and 35 genotypes with known resistance to the Mexican bean weevil), referred to hereafter as ‘genotypes’ for simplicity, were evaluated in this study. Out of the landrace collections, 148 were obtained from the Ethiopian Biodiversity Institute (EBI) and the remaining 56 were collected from the major bean growing areas in Ethiopia. The released varieties and breeding lines were obtained from Melkassa, Sirnka and Areka Agricultural Research Centres and Haramaya University in Ethiopia, whereas the Mexican bean weevil resistant genotypes were obtained from the International Center for Tropical Agriculture (CIAT) in Uganda, Pannar Seed Company, and the Malawi National Bean Improvement Programme. Descriptions of the genotypes used in the study and the map showing the collection sites of the Ethiopian materials are presented in Table 1 and Fig. 1, respectively.
Breeding status, Ethiopian eco-geographical zones and designation of the common bean landrace collections and other genotypes used for the study

A map of Ethiopia showing the geographical positioning of the specific collection sites of 204 common bean landrace collections.

The genotypes were highly variable and contrasting for many features like seed colour (red = 114, white = 75, black = 30, carioca = 13, speckled = 9, yellow = 12, cream = 19, pinto = 5, mottled = 16 and brown = 7) and seed size based on hundred seed weight (g) (small < 25 g, medium = 26–40 g and large > 40 g). There were 185 small-seeded, 88 medium-seeded and 27 large-seeded genotypes. The genotypes were rejuvenated under the same conditions during the off-season of 2013 (February–May) at Melkassa under irrigation, for seed increase and to offset any differences in seed age and effects of the prior growing environments (Liao et al., Reference Liao, Hocking, Dong, Delhaize, Richardson and Ryan2008).
Bruchid resistance evaluation protocol
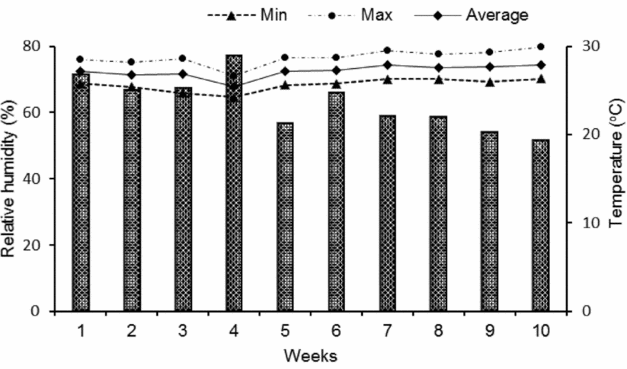
The experiment was conducted at Melkassa Agricultural Research Centre, Ethiopia, in the Entomological Research Laboratory under ambient temperature and relative humidity as presented in Fig. 2. Adult bruchids were collected from stored bean seed from which a culture of bean bruchids was developed, to supply similar age bruchids for the experiment. A susceptible variety, Batu, was used for mass rearing of bruchids under an average room temperature of 27 °C and a relative humidity of 70%. The experiment was intentionally set between March and May 2014, which is the period of the year when higher storage losses are commonly expected in the area, because of high temperatures.
Temperature and relative humidity at the Entomological Research Laboratory of Melkassa Agricultural Research Centre during the study period.

Freshly harvested seeds were cleaned and placed in a deep freezer (−20 °C) for 4 weeks to destroy any prior bruchid infestation, as suggested by Dobie (Reference Dobie1977). The seeds were subsequently acclimatized under experimental conditions for 7 days. Twenty grams of seed was placed in transparent plastic jars (6 cm × 7 cm) with an opening at one end for free air circulation. The experiment was laid out in a randomized complete block design (RCBD) with three replications. Each jar was infested with five pairs (five females and five males) of newly emerged bruchids that were kept in the jars for 10 days to allow for oviposition, after which they were removed. The seeds were observed daily to record any bruchid emergence. The removal and counting of emerged adult bruchids was done every second day, starting from the first emergence and continuing until the last emergence.
Data collection and analysis
Data were collected on insect traits, including number of eggs per female, number of adults emerged, percentage of adults emerged, days to adult emergence (DAE) and adult dry weight. Seed traits, including proportion of infested seeds (%), number of holes, number of holes per seed, percentage seed damage, seed weight loss, seed size (g/100 seed), seed coat weight (as percentage of total seed weight) and seed density, were also recorded. All the data were collected on the first progeny except percentage damage (1st and 2nd progeny) and seed weight loss (%) (2nd progeny).
The index of susceptibility (IS) scores were calculated as previously described by Cardona et al. (Reference Cardona, Kornegay, Posso, Morales and Ramirez1990) and used by Hartweck et al. (Reference Hartweck, Cardona and Osborn1997) for the Mexican bean weevil. The IS values were calculated as: Index of susceptibility = (log F/DAE)*100, where F = progeny per infesting female and DAE = days to adult emergence. The genotypes were classified based on Dobie's (Reference Dobie1974) indices of susceptibility as resistant (0–3), moderately resistant (4–7), susceptible (8–10) and highly susceptible (11).
Grain damage was calculated as the percentage of damaged seeds in each jar. The percentage seed weight loss of each genotype was calculated by separating damaged and undamaged seeds from each jar at the end of the experiment as suggested by Shaheen et al. (Reference Shaheen, Khaliq and Aslam2006).
 $$\begin{eqnarray*}
&&{\rm{Percentage}}\,{\rm{weight}}\,{\rm{loss}}\\
&&\quad = \frac{{{\rm{Initial}}\,{\rm{weight}} - ({\rm{Weight}}\,{\rm{of}}\,{\rm{damaged}} + {\rm{Undamaged}}\,{\rm{seed}})}}{{{\rm{Initial}}\,{\rm{weight}}}}\\
&&\quad \times 100
\end{eqnarray*}$$
Data based on count and percentage values were first log (count) and arcsine (percentage) transformed, to ensure homogeneity of variance. Analysis of variance (ANOVA) was done with the SAS software version 9.2 (SAS Institute, 2003) using the following model:
 $$\begin{equation*}
{p_{ik}} = \mu + {b_k} + {g_i} + {e_{ik}}
\end{equation*}$$
where pik = phenotypic observation on genotype i block k, (i = 1. . .G, k = 1. . .B) and G and B = number of genotypes and block, respectively, μ = grand mean, gi = the effect of genotype I and bk = the effect of block k and eik = error.
Tukey's honestly significant difference test was used for comparing the mean values. The best 10% of the genotypes was identified, their means independently computed for each character, and comparisons made between the mean performance of the best 10% of the genotypes and the original population using the Z-test (Singh, Reference Singh2001) as
 $$\begin{equation*}
Z = \frac{{\bar{Y} - \bar{X}}}{{\sqrt {\frac{{S_1^2}}{{{n_1}}} + \frac{{S_2^2}}{{{n_2}}}} }}
\end{equation*}$$
Where;
 $\bar{Y}$
= mean of original population, n
1 = number of individuals in original population,
 $\bar{X}$
= mean of selected individuals, n
2 = number of individuals in selected sample, S
1= standard deviation of original population and S
2 = standard deviation of the selected sample.
Comparison of the pattern of frequency distributions and a stratified ranking diagram for some important attributes of response of the original 300 and the best 10% of the selected genotypes was made to show improvements of the selected genotypes over the original population using the statistical software MINITAB Release 14 for Windows® (Fox et al., Reference Fox, Skovmand, Thompson, Braun and Cormier1990; Minitab, Inc., 2010).
Results
Genotypic performance
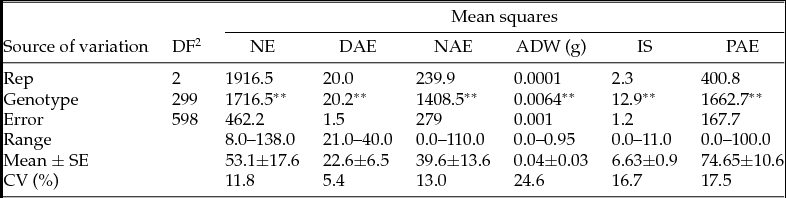
ANOVA showed highly significant differences (P<0.01) amongst the genotypes for all characters (Tables 2 and 3). The most resistant genotypes with no adult emergence were from the MAZ and RAZ lines including: MAZ-203, RAZ-2, RAZ-36, RAZ-44, RAZ-11, RAZ-120 and RAZ-40 as expected. On the other hand, the most susceptible genotypes with the highest number of adults emerged included Awash-1, Acc. No. 223329, Acc. No. 215719, NC-46, Acc. No. 214678, SCR-20, Beshbesh and MAZ-217. Even though some common bean genotypes (like Awash-1, NC-46, Acc. No. 215719 and Acc. No. 223329) with the highest number of eggs also had the emergence of the highest number of adults, a few others (like MAZ-217, NC-20, Acc. No. 214678, NC-18 and SCR-28) had the lowest number of eggs, but with the highest proportion of emergence into adults. All RAZ lines, with no exception, and some MAZ lines, prolonged the period of adult emergence to over 40 days, which may indicate existence of certain inhibiting factors. Similarly, a few others had the highest (like AFR-702, MAZ-151, SMARC-4, ETHAW-01-L-1-7A and MAZ-200) and the lowest (MAZ-180, MAZ-153, RAZ-114 and RAZ-9) number of eggs, but failed to support adult emergence.
Analysis of variance and range of the 300 common bean genotypesFootnote 1 for six insect traits after infestation by bean bruchid

ADW, Adult dry weight; CV, coefficient of variation; DAE, days to adult emergence; DF, Degrees of freedom; IS, index of susceptibility; NAE, number of adults emerged; NE, number of eggs; PAE, percent adult emergence; SE, standard error.
**Significantly different at P<0.01 probability level.
† Genotypes with no adult emergence were excluded from the calculation of analysis of variance and the range of days to adult emergence.
Analysis of variance and range of the 300 common bean genotypes for nine seed traits after infestation by bean bruchid

DF, degrees of freedom; FPD (%), first progeny damage; HSW, hundred seed weight; INS (%), per cent infested seeds; NH, number of holes; NH/S, number of holes per seed; SCW (%), seed coat weight; SD, seed density; SPD (%), second progeny damage; SWL (%), seed weight loss.
** Highly significantly different at P<0.01 probability level.
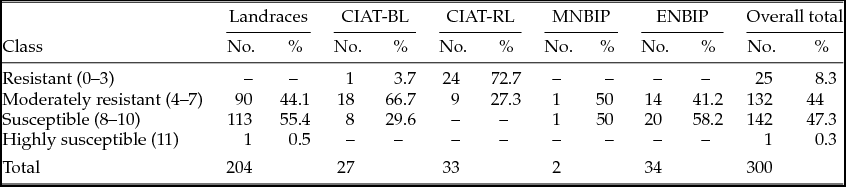
Based on the IS, performance of genotypes varied between zero for CIAT varieties with arcelin-based resistance to Z. subfasciatus and 11 for the most susceptible landraces. All RAZ lines, some MAZ lines and genotype SCR-11 showed resistance with IS values ranging from 1 to 3. There was no landrace in the resistant class based on the IS, but 44.1% were in the moderately resistant category (Table 4).
Distribution of 300 genotypes from different origin into different bruchid susceptibility classes as categorized by index of susceptibility

CIAT-BL, CIAT breeding lines; CIAT-RL, CIAT resistance lines; ENBIP, Ethiopian National Bean Improvement Programme; MNBIP, Malawi National Bean Improvement Programme.
Based on the IS, 8.3% of the 300 genotypes were categorized as resistant, 44.0% as moderately resistant, 47.3% as susceptible and 0.3% as highly susceptible. All genotypes were classified into two groups (moderately resistant and susceptible) except the CIAT varieties with known arcelin-based resistance of which 72.7% fell into the resistant and only 27.3% into the moderately resistant categories. Based on percentage seed damage, the genotype NC-38 had 50.31% damage, whereas no seed damage was observed on CIAT varieties with arcelin-based resistance, including MAZ-203, RAZ-2, RAZ-36, RAZ-44, RAZ-42, RAZ-11, RAZ-120 and RAZ-40 (Annexes 1 and 2, in the Supplementary material).
Simple measures of variability, including range, arithmetic mean and standard error also showed the existence of high variation amongst the genotypes (Tables 2 and 3). The number of eggs laid per female ranged from 8 to 138, the number of days taken to adult emergence from 21 to 40 (considering only genotypes in which adults had emerged), number of emerged adults from 0 to 110 (0–100%) and adult dry weight from 0.00 to 0.95 g. Wide ranges were also observed for other characters, including IS, number of holes per seed, percentage damage, seed weight loss (%), seed coat weight (%), seed size, and seed density (Tables 2 and 3). The standard errors of almost all parameters recorded in this study were low.
Comparison of selected genotypes with the original population
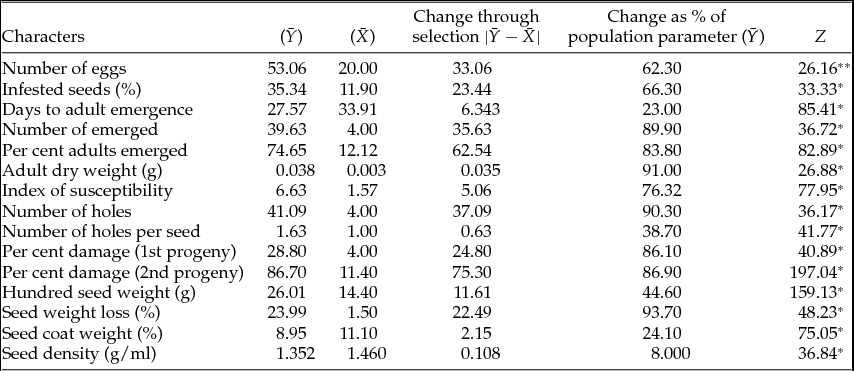
Comparison of mean performances of the best 10% selected genotypes with mean performances of the whole population for different characteristics is presented in Table 5. The selected best 10% genotypes exhibited a significantly lower number of eggs, number of infested seeds, number of adults emerged, lower adult dry weight, number of holes per seed, IS, longer days to adult emergence, lower percentage seed damage and seed weight loss. They also had small seed sizes, thick seed coat and higher seed density, as compared to the overall population (Table 5).
Comparison of the mean performance of the selected 10% best genotypes and overall population for response characters to infestation by bean bruchid

*Significant (P<0.05).
 $\bar{Y}$
indicates mean of the 300 population and
 $\bar{X}$
indicates mean of the 10% best genotypes.
The Z-test showed significant differences (P<0.01) between the mean of the original population (
 $\bar{Y}$
) and means of the selected 10% best genotypes (
 $\bar{X}$
) for all the response characteristics considered in this study. From the top 10% selected genotypes, MAZ 203, RAZ-2, RAZ-36, RAZ-44, RAZ-42, RAZ-11, RAZ-120, RAZ-40, RAZ-119, RAZ-114, RAZ-138, MAZ 174, RAZ-19, RAZ-111, RAZ-11-1, MAZ 153, MAZ 200, MAZ 179, MAZ 151 and RAZ-9 were completely resistant based on the percentage of adult emergence, IS and percentage of seed weight loss. There was no complete resistance for the other landraces, improved varieties and the rest of the breeding lines, although genotypes SCR-11, NC-16, Acc. no. 208705 and ETAW-01-L-1-7A were amongst the top 10% for different parameters of resistance. Statistically significant differences (P<0.05) were observed for percentage adult emergence, days to adult emergence, IS and seed weight loss amongst the released varieties, but none of them exhibited complete resistance. Two of the released varieties, namely AFR-702 and Awash Melka, were amongst the top 10% best performers, particularly for percentage adult emergence and percentage seed weight loss, respectively. Significantly higher percentage seed weight losses in released varieties were recorded on genotypes Nasir (42.82 %), Ayenew (43.61%) and Awash-1 (45.85%). On the other hand, percentage seed weight losses were lower in two other released varieties, namely Awash melka (3.74%) and Red wolayta (7.47%).
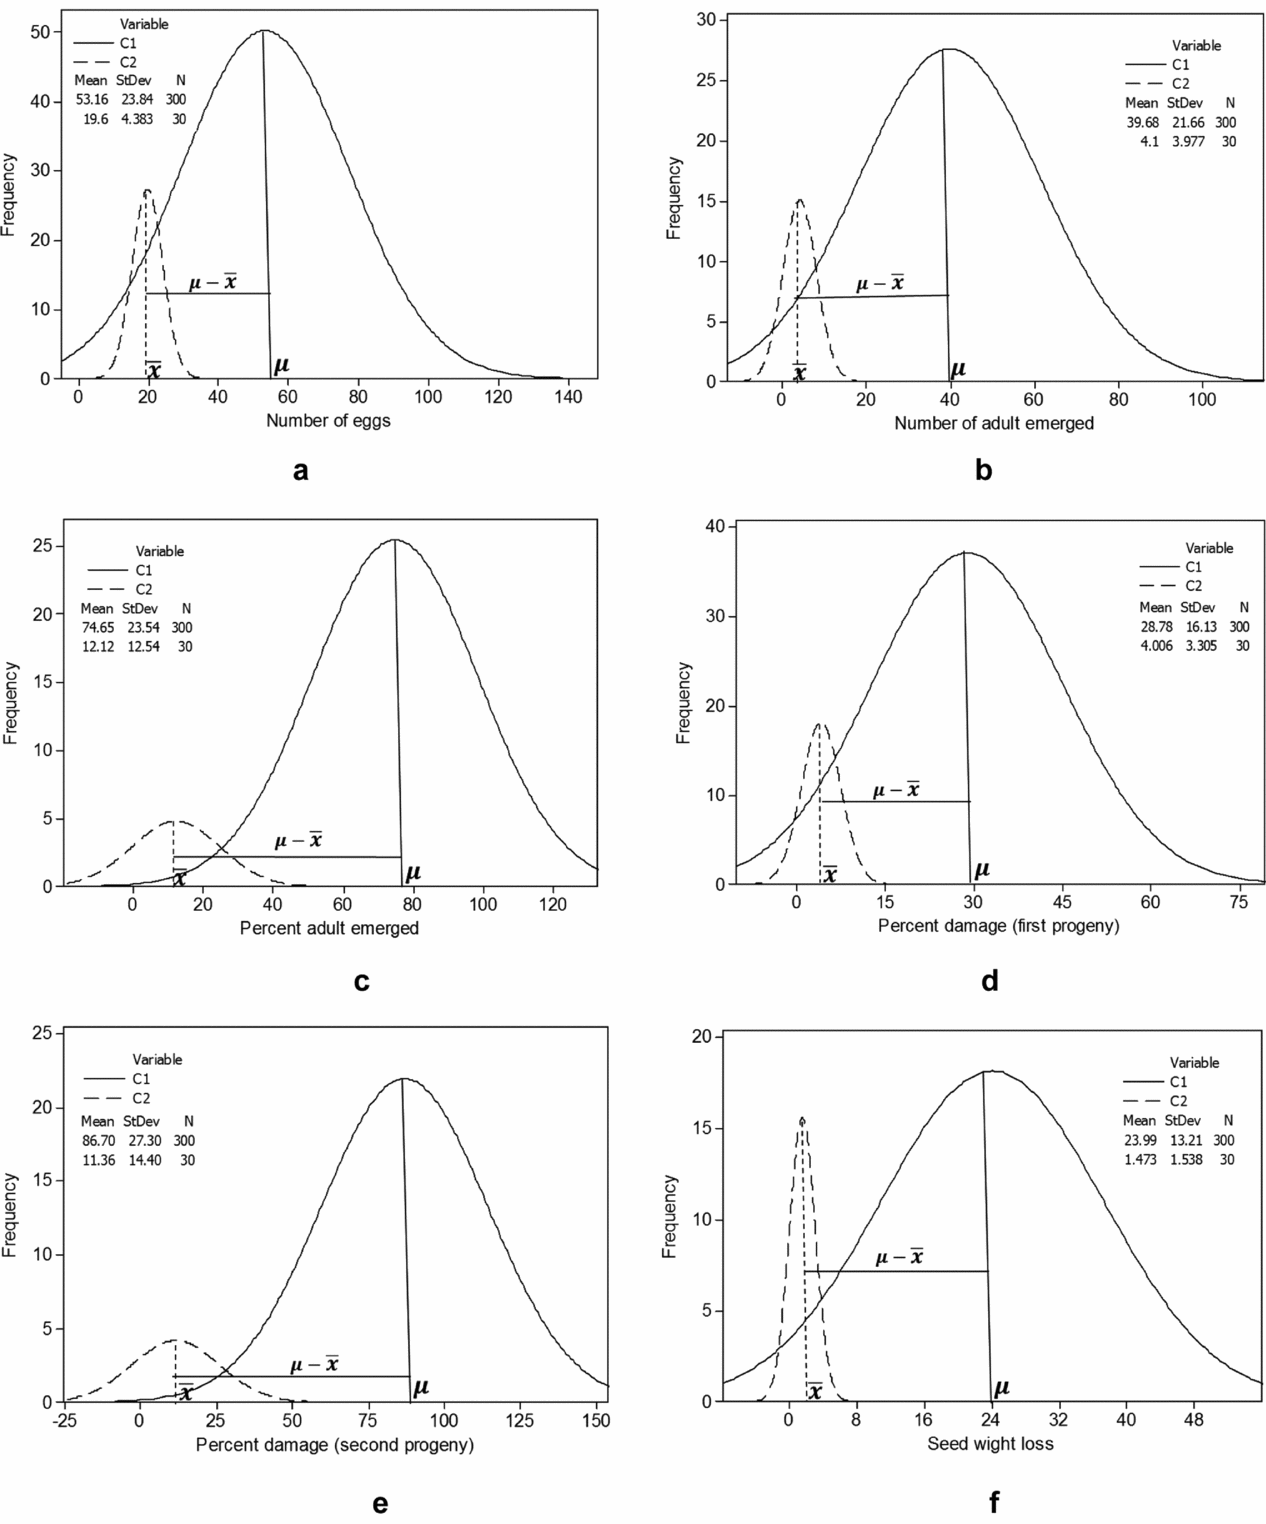
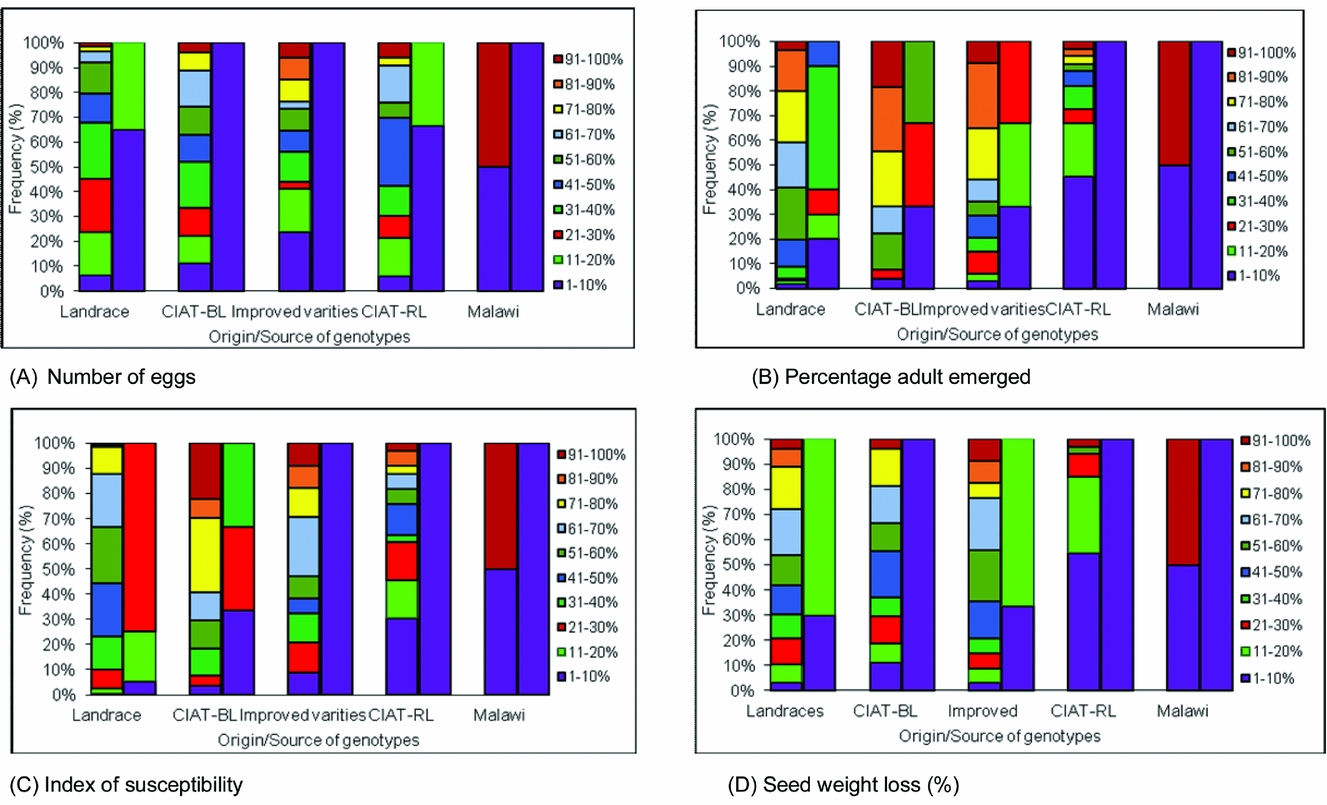
Comparison of the frequency distributions of the top 10% most resistant genotypes with the frequency distribution of the overall population revealed a significant level of improvement through selection (Fig. 3A–F). The average number of eggs was reduced from 53.2 in the overall population to 20.0 in selected individuals, number of adults emerged from 39.6 to 4.0, percentage adult emerged from 74.7 to 12.1, IS from 6.60 to 1.57, percentage seed damage from 86.7 to 11.7, percentage seed weight loss from 23.9 to 1.5, seed coat weight from 11.10 to 8.95 g and seed density from 1.46 to 1.35 g/ml. Similarly, comparison of the frequency distributions of the selected 10% of the most resistant genotypes with the frequency distribution of the overall population using a stratified ranking diagram of Fox et al. (Reference Fox, Skovmand, Thompson, Braun and Cormier1990) showed a significant level of improvement through selection of the best genotypes for different resistance traits (Fig. 4A–D).
Comparison of the distribution of the best 10% of the genotypes (
 $\bar{x}$
) with the distribution of the whole population (µ) for different characters related to response to infestation by bean bruchid.

Stratified ranking diagram showing the relative distributions for four different important traits in the original (1st bar) and 10% best (2nd bar) populations of common bean landraces, CIAT breeding lines (A), improved varieties released from Ethiopia (B), CIAT resistance lines (C) and introduction from Malawi (D).

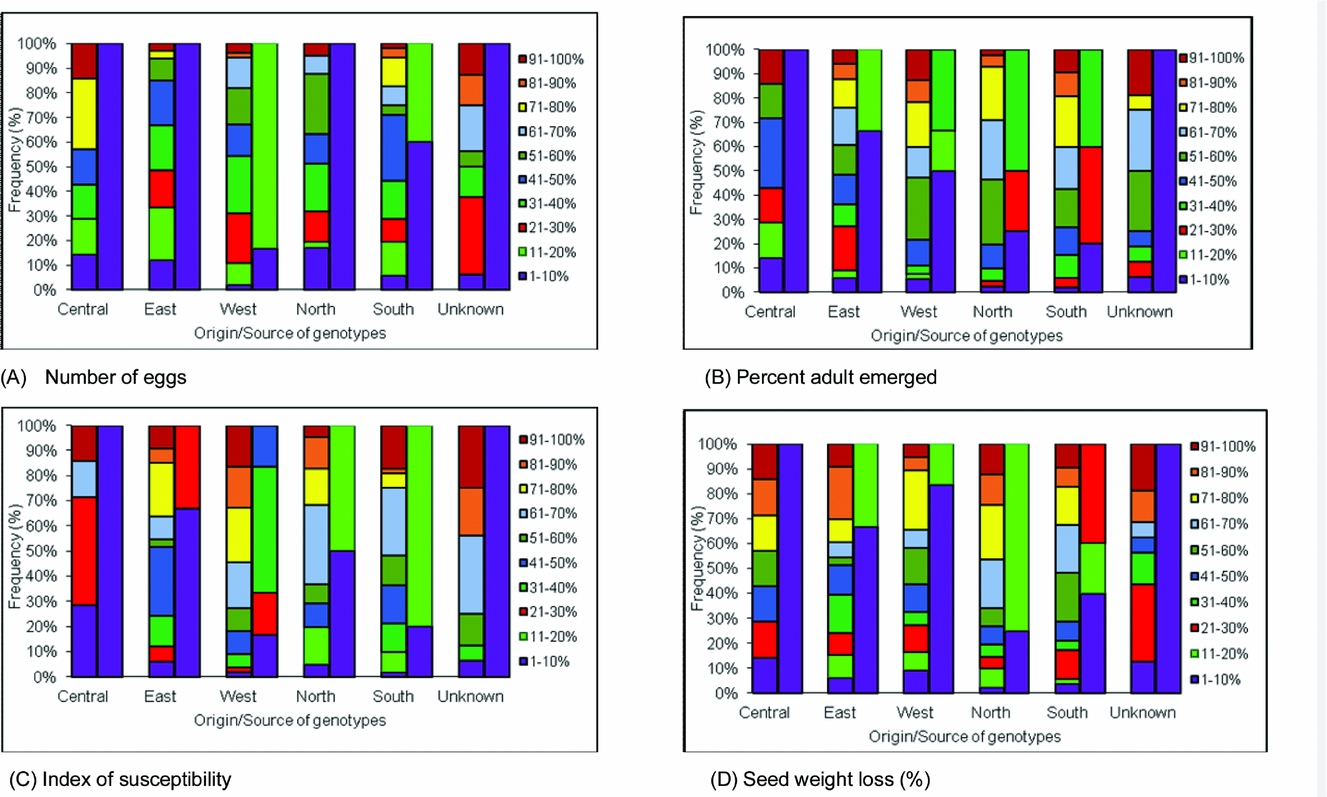
Genotypes from different sources had different patterns of response to infestation in terms of the four most important insect and seed related traits (number of eggs, percentage adult emerged, IS and seed weight loss). The resistant genotypes exhibited clear superiority as most of them ranked in the bottom (1–10%) for the above-mentioned traits in the original population. However, almost all categories (landraces, CIAT breeding lines, improved varieties released in Ethiopia, CIAT resistant lines and introductions from Malawi) showed possibilities for selecting individuals with a relatively fewer number of eggs, percentage adult emerged, IS and seed weight loss. The original and the selected population of landraces from different eco-geographical origins based on a stratified ranking diagram had different patterns of response for the four traits (Fig. 5). The common bean accessions collected from the central parts of the country resulted in a higher number of genotypes ranked in the lower part (1–10%) than those collected from the rest of the country for all the traits in the overall population. Except for some inconsistencies in the western, northern and southern parts of the country, almost all parts of the country showed potential for selecting individuals fewer eggs, percentage adult emerged, IS and seed weight loss.
Stratified ranking diagram showing the relative distributions for four different important traits in the original (1st bar) and 10% best (2nd bar) populations of common bean landraces collected from different eco-geographic regions of Ethiopia.

Relationship between different response traits
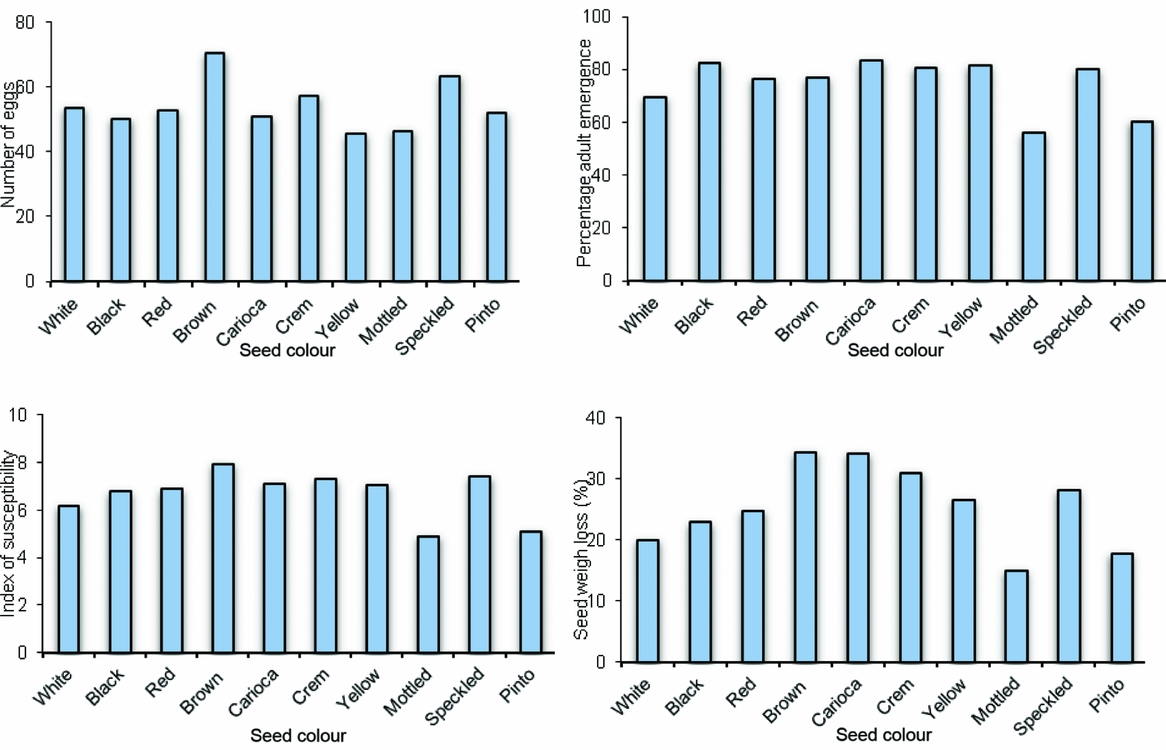
Comparison of the 300 genotypes based on their seed colour and insect resistance parameters showed different patterns of responses. The number of eggs laid was relatively small in genotypes with yellow (45.7) and mottled (46.6) seed colours, but a relatively higher number of eggs was laid on brown (70.5) and speckled (63.6) seeded genotypes. The percentage of adult emergence (55.8–69.5), IS (4.9–6.2) and seed weight loss (%) (15–20.1) were relatively lower in white, mottled and pinto-coloured seeds (Fig. 6).
Mean value of insect and seed traits for 300 bean genotypes grouped based on the seed colour of the genotype.

Discussion
The significant genotype mean squares for percentage adult emergence, days to adult emergence and IS showed that the 300 genotypes exhibited genetic variations for bruchid resistance. Apart from the genotypes with known resistance (33), only one breeding line (SCR 11) was found to be resistant based on Dobie's susceptibility index. Indicators of the presence of antibiosis, such as reduced adult emergence, prolonged life cycle and reduced adult dry weight were observed in the resistant materials (RAZ and MAZ lines). The results indicated that the above susceptibility parameters (percentage adult emergence, DAE and IS) were able to differentiate the genotypes based on their variations in bruchid susceptibility (Redden and McGuire, Reference Redden and McGuire1983; Schoonhoven et al., Reference Schoonhoven, Cardona and Valor1983; Cardona et al., Reference Cardona, Kornegay, Posso, Morales and Ramirez1990). In this study, the highest and lowest number of eggs failed to support the proportion of adult emergence, indicating that at least some mechanisms of host resistance, including antixenosis (non-preference) for ovipositioning and antibiosis (deterrence) for adult emergence might be involved as also indicated by De Morais and Pinheiro (Reference De Morais, Pinheiro, Fritsche-Neto and Borém2012). Negasi and Abate (Reference Negasi and Abate1992) and Shiferaw (Reference Shiferaw2004) also reported that during the no-choice test experiments, bruchids oviposited on all accessions and a high number of eggs may not necessarily result in correspondingly high number of progeny; thus, lower number of eggs laid per female may not be a good indicator of resistance, as reported by others.
Grouping of the genotypes was done based on the susceptibility index, as a measure of resistance. The susceptibility index is linearly correlated with the intrinsic rate of increase and the logarithm of the number of insects that emerge over a given time period; and, hence, it provides a reliable estimate of resistance levels (Dobie, Reference Dobie1974). Genotypes with low IS values are ranked as highly resistant and those with high values as susceptible (Cardona et al., Reference Cardona, Posso, Kornegay, Valor and Serano1989). A zero IS in this study indicated that no bruchids had emerged over the test period, which was the case for varieties with arcelin-based resistance to Z. subfasciatus (Singh and Singh, Reference Singh and Singh1992). The IS ranged from 0 to 11 amongst the tested genotypes, which indicated that there was a remarkable variation amongst the genotypes for this index. No complete resistance was observed in any of the landraces, breeding lines and improved varieties, as reported by many others (Schoonhoven et al., Reference Schoonhoven, Cardona and Valor1983; Acosta-Gallegos et al., Reference Acosta-Gallegos, Quintero, Vargas, Toro, Tohme and Cardona1998, Reference Acosta-Gallegos, Kelly and Gepts2008), but partial resistance was observed in a few genotypes in this study. The susceptibility index of all the improved genotypes ranged from 5 to 9, indicating that all the released varieties from the national programme fall into moderately resistant (Awash Melka, Hundene and Fidise) to susceptible categories. This may be because more priority by the hitherto common bean breeding in Ethiopia was given to productivity of the varieties at the expense of storage insect resistance. Seed weight loss ranged from 0 to 50.3 g (Table 2) in two generations and the insect completed up to 6–7 generations per year, showing that the damage level can be high within a short period. Getu et al. (Reference Getu, Ibrahim and Iticha2003) has reported 60% seed weight loss in bean seed stored for 3–6 months in Ethiopia.
Arcelin, a lectin like protein that affects the survival and development of Z. subfasciatus, is able to confer resistance against Z. subfasciatus and is found in the cotyledons of wild common beans (Osborn et al., Reference Osborn, Burow and Bliss1988; Cardona et al., Reference Cardona, Posso, Kornegay, Valor and Serano1989). CIAT resistant lines, i.e. RAZ-11, RAZ-36, RAZ-2, RAZ-44, RAZ-120, RAZ-40 and MAZ-203, exhibited complete resistance to Z. subfasciatus. Assefa (Reference Assefa2010) tested genotypes of common bean (30 RAZ and 10 susceptible commercial varieties) for their resistance against Z. subfasciatus and found that arcelin 1 variant (present in RAZ 4, RAZ 120, RAZ 42, RAZ 101, RAZ 173, RAZ 119, RAZ 44, RAZ 174 and RAZ 151) had a good level of resistance for Z. subfasciatus. The arcelin variants Arc-5 and Arc-1 showed the highest resistance to Z. subfasciatus in common bean accessions followed by Arc-4, Arc-2 and Arc-3, in order of importance (Harmsen, Reference Harmsen1989; Cardona et al., Reference Cardona, Kornegay, Posso, Morales and Ramirez1990). The difference in the resistance level is believed to be due to protein differences or carbohydrate content (Harmsen et al., Reference Harmsen, Bliss, Cardona, Posso and Osborn1987).
There are different views on the role of seed related traits, especially seed colour and seed size, in influencing resistance to bean bruchid. In the present study, common bean seeds with different colours showed differences in number of eggs, percentage adult emergence, IS and seed weight loss (%). Relatively, a low number of eggs was laid on yellow and mottled seeded genotypes. The percentage of adult emergence, IS and seed weight loss (%) was relatively low in white, mottled and pinto coloured seeds (Fig. 6) and this may be due to the presence of the resistance lines in these market classes. Odagiu and Porca (Reference Odagiu and Porca2003) also reported that red-seeded bean cultivars were more susceptible than the white-seeded bean cultivars to the different types of bean bruchid (A. obtectus). According to other researchers, seed colour was not important for Z. subfasciatus oviposition (Ofuya and Credland, Reference Ofuya and Credland1996; Teixeira and Zucoloto, Reference Teixeira and Zucoloto2003; Kananji, Reference Kananji2007). Seed morphological characters did not appear to affect female bruchids’ ovipositional preference and subsequent adult emergence and damage (Negasi, Reference Negasi1994; Negasi and Abate, Reference Negasi and Abate1992).
Conclusion
The present study shows that despite the existence of significant relative differences in response to infestation by bean bruchid, the Ethiopian common bean accessions failed to show complete resistance. The commercial improved bean varieties released in Ethiopia were susceptible to Z. subfasciatus. On the other hand, genotypes with known arcelin-based resistance also repeated complete resistance in this study. The resistant genotypes should be taken up by the Ethiopian bean breeding programme for a comprehensive yield trial at the national level and direct releases as commercial varieties carried out. The breeding line with a relatively better resistance to bruchids, namely SCR-11, should make the predominant part in the genetic backgrounds of the breeding materials, to exploit not only its relative resistance but also its adaptive genes to the local conditions. In addition, conversion of well adapted or released common bean varieties into their bruchid resistant versions through incorporation of the responsible genes employing backcross techniques supported with marker assisted selection (MAS) seems to be the best strategy, not only in terms of time saving, but also in terms of effectiveness and efficiency.
Acknowledgments
The authors wish to acknowledge the Alliance for a Green Revolution in Africa (AGRA) and University of KwaZulu-Natal for financial support. The test genotypes were received from Ethiopian Biodiversity Institute (EBI), Melkassa, Sirnka and Areka Agricultural Research Centers and Haramaya University. The authors would like to thank Melkassa Agricultural Research Centre (MARC) for providing the necessary material and technical support during the study period.
Supplementary material
To view supplementary material for this article, please visit https://doi.org/10.1017/S1742758417000248