Introduction
Multiple studies have reported an impairment of facial emotion perception in schizophrenia (Mandal et al. Reference Mandal, Pandey and Prasad1998; Edwards et al. Reference Edwards, Jackson and Pattison2002; Aleman & Kahn, Reference Aleman and Kahn2005). Typically, people with schizophrenia experience difficulties when trying to identify or recognize emotional facial expressions from pictures (Edwards et al. Reference Edwards, Pattison, Jackson and Wales2001; Kohler et al. Reference Kohler, Turner, Bilker, Brensinger, Siegel, Kanes, Gur and Gur2003; Johnston et al. Reference Johnston, Devir and Karayanidis2006) and experience difficulties discriminating or differentiating among different emotional expressions (Edwards et al. Reference Edwards, Pattison, Jackson and Wales2001; Addington et al. Reference Addington, Saeedi and Addington2006). In a recent meta-analysis by Kohler et al. (Reference Kohler, Walker, Martin, Healey and Moberg2010), the magnitude of these deficits in schizophrenia was quantitatively assessed and large effect sizes were observed both for studies examining facial expression identification (n=59, Cohen's d=−0.89) and differentiation (n=27, Cohen's d=−1.09). Kohler et al. (Reference Kohler, Walker, Martin, Healey and Moberg2010) and Edwards et al. (Reference Edwards, Jackson and Pattison2002) highlighted the need to examine the moderating effect of illness-related variables that could affect the severity of the emotion perception deficit. For instance, in their recent meta-analysis, Kohler et al. (Reference Kohler, Walker, Martin, Healey and Moberg2010) reported a highly significant association across 20 studies between total score on the Scale for the Assessment of Negative Symptoms and the severity of facial emotion perception deficits, with more severe negative symptoms associated with greater perception deficits.
Several studies have explored the functional neural correlates of facial emotion perception in people with schizophrenia. Another recent meta-analysis of functional neuroimaging data examined the neural correlates of facial emotion processing in people with schizophrenia and healthy subjects (Li et al. Reference Li, Chan, McAlonan and Gong2009). Overall, 17 functional neuroimaging studies [positron emission tomography or functional magnetic resonance imaging (fMRI)] reported neural activity during the presentation of emotional faces. Both schizophrenia and healthy groups exhibited significant activation of the amygdala bilaterally, extending to the parahippocampal gyrus, and in the right fusiform gyrus. When both groups were directly compared, the extent of activation induced by facial emotion perception was more limited in the amygdala, parahippocampal gyrus, fusiform gyrus and right superior frontal gyrus for people with schizophrenia. The authors suggested that this under-recruitment of the amygdala and other temporal and frontal regions may represent the neural basis of faulty facial emotion processing in people with schizophrenia. Another interesting observation made in this meta-analysis is that the nature of the orienting task performed during facial processing did not significantly influence the pattern of activity. Hence, both explicit processing of facial emotion and implicit processing (e.g. gender decision) yielded similar patterns of activity.
Although behavioral studies suggest a moderating effect of negative symptoms in general (Kohler et al. Reference Kohler, Walker, Martin, Healey and Moberg2010), and of flat affect in particular (Gur et al. Reference Gur, Kohler, Ragland, Siegel, Lesko, Bilker and Gur2006), on emotion perception, few studies have systematically examined the influence of flat affect on neural activity during emotional processing in schizophrenia. Fahim et al. (Reference Fahim, Stip, Mancini-Marie, Mensour, Boulay, Leroux, Beaudoin, Bourgouin and Beauregard2005) compared two groups of schizophrenia patients differing in the presence or absence of flat affect. Relative to the high flat affect group, the low flat affect group exhibited increased activity in multiple limbic and paralimbic regions during the viewing of negatively valenced scenes relative to neutral ones. More recently, Gur et al. (Reference Gur, Loughead, Kohler, Elliott, Lesko, Ruparel, Wolf, Bilker and Gur2007) examined neural activity during the identification and misidentification of emotional faces (happy, sad, angry, and fearful). They observed that amygdala activity for misidentified fearful faces selectively and strongly correlated with the severity of flat affect. It was suggested that flat affect was related to an overstimulation of the limbic system. Taken together, these studies suggest that flat affect can potentially affect neural activity in multiple limbic regions.
The current study examined the functional and structural neural correlates of facial emotion perception during a gender decision task for sad, happy and neutral faces. This task was chosen because it minimizes performance differences across groups. By focusing on the gender of the face as opposed to the emotional expression, participants are processing the latter implicitly. It has been shown that the influence of facial emotions on neural activity in schizophrenia is the same during such a task as during a task in which explicit processing is required (Li et al. Reference Li, Chan, McAlonan and Gong2009). Emotional valence rating was conducted after scanning to ascertain that both groups perceived the emotional stimuli similarly. To explore the functional neural correlates, we used event-related fMRI to examine two central questions: what the neural correlates of facial emotion perception are when comparing neural activity induced by sad and happy faces relative to neutral faces in people with schizophrenia and healthy subjects, and what the influence of flat affect severity is on the pattern of brain activity in the patient group. Hence, our analytical strategy consisted of identifying common patterns of activity across groups using a conjunction analysis and exploring group differences using an interaction approach. We then correlated the pattern of activity during facial emotion perception with the rating of flat affect. We hypothesized that people with schizophrenia would show abnormal activity in limbic regions during the processing of facial emotion perception. The examination of the influence of flat affect on neural activity was purely exploratory. For the structural exploration, we examined the volume of the amygdala using MRI. Based on previous findings (Lawrie et al. Reference Lawrie, Whalley, Job and Johnstone2003), we hypothesized that the amygdala would be significantly smaller in the patient group. The current report is part of a larger study on emotional face memory, and the effects of emotional expression on memory in healthy controls and people with schizophrenia have been reported elsewhere (Sergerie et al. Reference Sergerie, Lepage and Armony2007, Reference Sergerie, Armony, Menear, Sutton and Lepage2010).
Method
Participants
People with schizophrenia spectrum disorders
A total of thirty out-patients with Diagnostic and Statistical Manual of Mental Disorders, fourth edition (DSM-IV)-defined schizophrenia spectrum disorders participated in the fMRI study. People with schizophrenia were recruited from the various out-patient clinics of the Douglas Hospital as well as from the Prevention and Early Intervention Program for Psychoses (PEPP-Montréal). Inclusion criteria include age between 18 and 50 years; diagnosis of a schizophrenia spectrum disorder; clinically stable for at least 4 weeks; and on a fixed medication regimen for at least 6 weeks. Exclusion criteria include presence of an Axis I co-morbid disorder; very low cognitive functioning; and presence of any contraindication of MRI. Diagnoses were made by senior psychiatrists for the patients from the PEPP and by out-patient physicians for the others (as per medical records). All diagnoses were subsequently confirmed with the Structured Clinical Interview for DSM-IV Axis I Disorders, Patient Edition (SCID-I/P) administered by trained raters. As part of the administration of the SCID, special attention was given to the presence of current mood disorders and none of the participants reported having a mood disorder. All patients were administered a structured protocol which included symptom ratings using the Scale for the Assessment of Positive Symptoms (Andreasen, Reference Andreasen1984a) and the Scale for the Assessment of Negative Symptoms (SANS; Andreasen, Reference Andreasen1984b).
Healthy controls
Twenty-six healthy control subjects were recruited by means of advertisements placed in local newspapers, and a modified version of the SCID-I was used to rule out the possibility of current psychiatric illness. Control subjects reported no current or past history of neurological disease or head trauma causing loss of consciousness and no first-degree family members with schizophrenia or schizophrenia spectrum psychosis. Groups were matched for age, gender and parental socio-economic status as assessed with the Hollingshead two-factor index of social position.
After a complete description of the study, written informed consent was obtained from all participants. The protocol was approved by the institutional review boards of the Douglas Institute and the Montreal Neurological Institute (MNI).
Facial emotion perception task
We used a previously validated set of 168 black-and-white photographs of different individuals depicting sad, happy or neutral facial expressions (Sergerie et al. Reference Sergerie, Lepage and Armony2006). Two equivalent subsets of stimuli were made from this set, each including 28 sad, 28 happy and 28 neutral faces (half male). The facial emotion perception task was part of a larger experiment on emotional memory in schizophrenia (Sergerie et al. Reference Sergerie, Armony, Menear, Sutton and Lepage2010). The task was conducted during one single fMRI run. During this task, one stimulus subset was presented twice, in a pseudo-random order (counterbalanced across subjects). Subjects were asked to perform a gender decision on the faces. Following the scanning session, subjects rated all the faces in terms of valence using a visual analog scale. Stimulus duration was 2.5 s with a mean stimulus onset asynchrony (SOA) of 4 s. Longer SOAs (null events) were interspersed in a pseudo-random fashion to obtain an estimate of baseline activity. Stimulus presentations were de-synchronized with respect to the onsets of volume acquisitions to increase the effective sampling rate and thus get a better estimate of the hemodynamic response (Josephs et al. Reference Josephs, Turner and Friston1997).
fMRI acquisition
Scanning took place at the MNI, using a 1.5-T Siemens Sonata. Functional T2*-weighted echoplanar images were acquired using blood oxygenation level-dependent (BOLD) contrast [repetition time (TR)=2540 ms, echo time (TE)=50 ms, flip angle=90°, field of view (FOV)=256 mm, matrix=64×64], covering the entire brain (30 interleaved slices parallel to the anterior–posterior commissural plane; voxel size 4×4×4 mm). Two functional runs of 350 volumes each were acquired (emotion perception and memory recognition). An anatomical volume was also acquired (voxel size 1×1×1 mm3). Stimulus presentation and subject response recording were done with a personal computer laptop running E-PRIME.
Data analyses
Sociodemographic and behavioral data
Group differences for age was examined with a t test, gender with a χ2 test, and socio-economic status and handedness with a Mann–Whitney test. The emotional valence ratings were examined using a group×emotional expression (sad, happy and neutral) analysis of variance (ANOVA).
fMRI analyses
Functional data were analysed using SPM2, as described elsewhere (Sergerie et al. Reference Sergerie, Lepage and Armony2007). For the facial emotion perception task we defined three event types based on facial expression; namely sad, happy, and neutral. We also included the six covariates corresponding to the movement parameters obtained from the realignment procedure. Linear contrasts of subject-specific parameter estimates for conditions of interest were taken to a second-level random-effects model. Areas commonly activated by patients and controls for emotional expressions (sad and happy) relative to neutral faces were identified using a conjunction procedure according to the minimum statistic compared with the conjunction null hypothesis (Nichols et al. Reference Nichols, Brett, Andersson, Wager and Poline2005), by setting a threshold of 0.005 for each contrast separately, thus yielding an overall threshold of p<0.0052. Differences between patients and controls were calculated with a two-sample t test for the contrasts of interest. Comparisons were examined with a threshold of p<0.001, uncorrected, and a cluster extent of 10 contiguous voxels (2×2×2 mm). The effect of flat affect on facial emotion perception was examined by correlating the global rating of flat affect as determined with the SANS on the sad and happy faces versus neutral faces contrast, again using the same threshold and cluster extent.
Amygdala volumetry
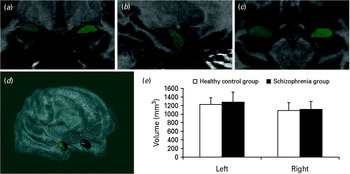
T1 images were preprocessed with non-uniformity correction, registration into standard stereotaxic space, and signal intensity normalization prior to manual amygdala segmentation. Volumetric analyses were performed with the software package DISPLAY developed at the MNI. Manual tracing of the amygdala was performed using a validated protocol (Pruessner et al. Reference Pruessner, Li, Serles, Pruessner, Collins, Kabani, Lupien and Evans2000). The high-resolution MRI images acquired yielded easily traceable borders in most cases. When a border was less visible, we used the predetermined landmarks proposed by Pruessner et al. (Reference Pruessner, Li, Serles, Pruessner, Collins, Kabani, Lupien and Evans2000) . The posterior border can be defined as where the gray matter starts to appear above the alveus of the hippocampus. When the alveus was not visible, the inferior horn of the lateral ventricle was used. For the superior border, a horizontal line connecting the superolateral part of the optic tract to the fundus of the inferior portion of the circular sulcus of the insula was drawn as a reference for the most superior gray matter to be included. The lateral and medial borders were defined in the horizontal view; the medial border is often evident against the entorhinal cortex, but when it was not, a semi-circle was drawn from the lateral ventricle to the alveus. This semi-circle would also form the lateral border when it could not be seen on the images. The tentorial indentation between the amygdala and the entorhinal cortex was used as the inferior border of the amygdala. In the horizontal view, we defined the anterior border at the level of the closure of the lateral sulcus. Fig. 1(a–d) illustrates the manual segmentation of the amygdala. Measurements were performed by two trained raters (A.B. and Y.C.) who were blind to clinical information. Group differences in the volume of the amygdala were examined with t tests and for the schizophrenia group the correlation between flat affect ratings and volume was examined with a non-parametric correlation (Spearman's ρ) because of the skewed distribution of flat affect ratings.
Manual segmentation of the amygdala. (a–c) Amygdala label superimposed on a T1 image on a coronal (a), sagittal (b) and horizontal (c) view. (d) Three-dimensional rendering of the brain and amygdala volumes. (e) Average amygdala volume (left and right separately) in the healthy control group (□) and in the schizophrenia group (▪). Values are means, with their standard deviations represented by vertical bars.

Results
Sociodemographical data
Of the schizophrenia participants, four were excluded from the final analysis due to excessive movement during the scan, poor behavioral performance or inability to complete the session. From the 26 remaining patients, 23 met diagnostic criteria for schizophrenia, two for schizo-affective disorder and one for psychotic disorder not otherwise specified. Of the 26 patients included in the study, 18 were taking antipsychotic medication (17 on second-generation antipsychotics, six taking a combination of second-generation and conventional antipsychotics) and three were neuroleptic-free (one missing information). One patient was taking an anticholinergic medication. The mean dose of antipsychotic medication was equivalent to 320.54 mg chlorpromazine/day. None of the patients had a concurrent mood disorder at the time of the study, although seven patients were receiving concomitant antidepressant medication [two on selective serotonin reuptake inhibitors (SSRIs) and five on benzodiazepines] and two patients were taking anticonvulsive medication.
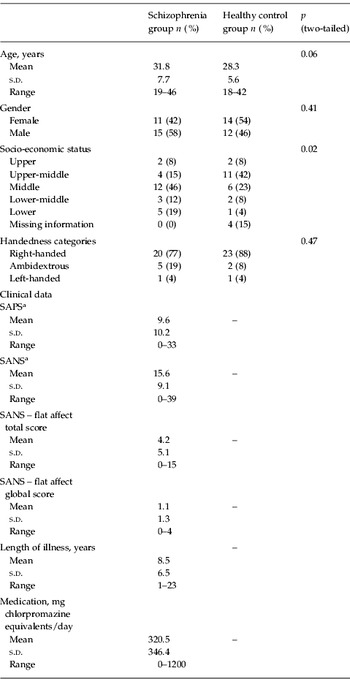
Table 1 presents the sociodemographical and clinical data for both the schizophrenia and healthy control groups. As can be observed, no significant differences were observed for any of the sociodemographical measures.
Sociodemographic, clinical and neuropsychological data for the schizophrenia group and the healthy control group

Data are given as number of subjects (%) or as mean, s.d. and range.
s.d., Standard deviation; SAPS, Scale for the Assessment of Positive Symptoms; SANS, Scale for the Assessment of Negative Symptoms.
a SAPS and SANS scores are composite totals for which the global ratings were not included.
Behavior
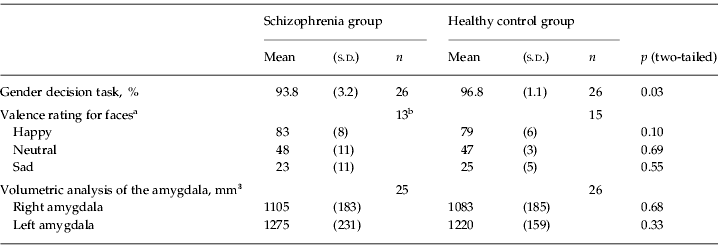
Both groups performed the gender decision task with great accuracy (94% in the schizophrenia group and 97% in the healthy control group) but because of a ceiling effect in controls this small group difference was significant, as can be seen in Table 2. A repeated-measures ANOVA of the ratings yielded a significant main effect of expression [F(2, 54)=335.8, p<0.0001] but no main effect of group (F<1) or interaction between expression and group [F(2, 54)=1.1, p>0.3]. In addition, ratings by patients and controls for each stimulus were highly correlated [r=0.98, p<0.0001], confirming that both groups rated all faces similarly in terms of their emotional valence. Table 2 presents the results for the valence ratings. We have reported a very similar pattern of results on this task with another independent group of people with schizophrenia (Harvey et al. Reference Harvey, Bodnar, Sergerie, Armony and Lepage2009).
Behavioral measures and volumetric estimates of the amygdala for the schizophrenia group and for the healthy control group
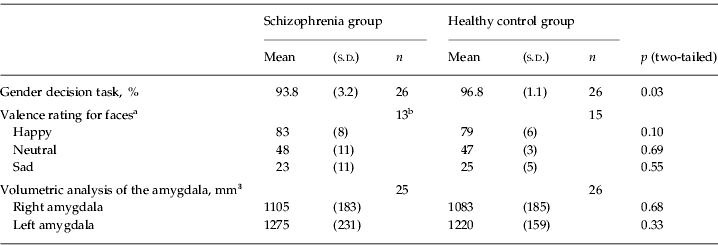
s.d., Standard deviation; SANS, Scale for the Assessment of Negative Symptoms.
a From a valence scale of 0 to 100, 0 being the most negative rating that can be given and 100 the most positive.
b The sample size for valence ratings is significantly smaller than the total sample. We compared the two subgroups of schizophrenia spectrum disorder participants with or without valence ratings and they did not significantly differ on age (30.5 v. 33.1 years, p=0.41), socio-economic status (3.15 v. 3.23, p=0.72), gender (8 male/5 female v. 7/6, p=0.69), handedness 10 right /2 ambidextrous/1 left v. 10/3/0, p=0.55), total SANS (17.7 v. 13.5, p=0.25) or flat affect total score (5 v. 3.3, p=41).
fMRI
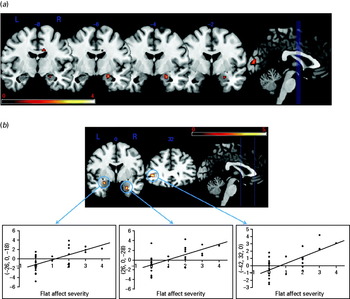
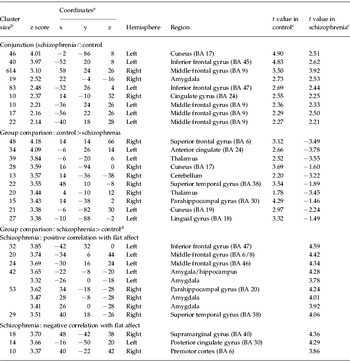
An analysis of the fMRI data examined the activation during the perception of sad and happy faces relative to neutral ones that was common to both the schizophrenia and control groups using a conjunction analysis. Table 3 and Fig. 2a present the significant regions identified in this contrast. As can be seen, the right amygdala and right parahippocampal gyrus, multiple regions of the prefrontal cortex bilaterally, and the cuneus showed significant increases in activity for emotional faces relative to neutral faces in both groups. A subsequent analysis examined group differences for the same contrast. Relative to people with schizophrenia, healthy control subjects exhibited increased activity in the right superior frontal gyrus, in multiple temporal lobe regions, in the thalamus and in the cuneus bilaterally. The schizophrenia group did not exhibit any significantly increased activity relative to the control group for this contrast.
(a) Conjunction analysis showing amygdala activity superimposed on multiple consecutive coronal magnetic resonance imaging (MRI) slices. The blue lines on the sagittal slice represent the positioning of the different coronal slices. The color legend represents t score values. L, Left; R, right. (b) Correlation between neural activity during facial emotion perception and flat affect severity in the schizophrenia group. The upper portion depicts two coronal MRI slices, one showing the amygdala activity bilaterally and the other the left inferior prefrontal activity. Their position on the sagittal plane is depicted by the blue lines. The color legend represents t score values. The three scatterplots in the lower part represent the relationship between neural activity and flat affect ratings for a peak in the left and right amygdala and for a peak in the left prefrontal cortex.

Between-group analysis and conjunction analysis for the different contrasts on emotional face processing in people with schizophrenia and healthy controls

BA, Brodmann area; MNI, Montreal Neurological Institute.
a x, y and z coordinates of local maxima are listed according to the MNI Talairach coordinate system.
b The cluster size represents the number of voxels.
c The t values reported in the last two columns were extracted from the within-group analyses for the control group and for the schizophrenia group.
d No significant clusters above statistical threshold.
A correlational analysis was used to examine the relation between flat affect severity and activity for the contrast emotional (sad and happy) versus neutral faces. Multiple brain regions showed a positive correlation with flat affect severity (global score), including the amygdala and parahippocampal gyrus bilaterally and the left inferior frontal gyrus. Fig. 2b illustrates the correlation between flat affect score and neural activity for the amygdala bilaterally and left prefrontal cortex. A significant negative correlation was observed between neural activity and flat affect in the left anterior cingulate cortex, right supramarginal gyrus and right precentral gyrus. This association between amygdala activity and flat affect rating was selective, as ratings for alogia, avolition–apathy and anhedonia–asociality did not show any significant activity for this region. Finally, we examined the potential confounding effect of gender, age, duration of illness and medication status on flat affect ratings. Age did not significantly correlate with flat affect (global score) (r=−0.16, p=0.44), duration of illness (r=−0.15, p=0.46), gender (r=0.11, p=0.6) or daily dose of medication in chlorpromazine equivalents (r=0.36, p=0.07).
Amygdala volumetry
Intra-rater reliability of the obtained volumes was assessed by performing volumetric measurements of the amygdala three times (on average 1 month apart) for four participants, and was found to be high [left amygdala, intra-class reliability coefficient (ICC)=0.986; right amygdala, ICC=0.959]. Inter-rater reliability for estimating amygdala volumes between the two raters involved was conducted on five randomly selected cases and was found to be high (left amygdala, ICC=0.996; right amygdala, ICC=0.988). The structural T1 image of one schizophrenia participant had a major artifact and could not be used for amygdala volumetry. Table 2 and Fig. 1e present the estimated volume for both groups. As can be observed, there were no significant group differences for either left or right amygdala volume (all p's >0.30). Correlations between flat affect severity and amygdala volume were examined in the schizophrenia group. No significant associations were observed (Spearman's ρ=−0.30, p=0.15 for the left amygdala and Spearman's ρ=0.28, p=0.18 for the right amygdala).
Discussion
This study used event-related fMRI and amygdala volumetry to examine the functional and structural neural correlates of facial emotion perception and their relation to flat affect severity in a cohort of people with schizophrenia. At the behavioral level, both the schizophrenia group and the healthy control group rated the emotional valence of facial expressions in a similar fashion. At the brain level, both groups exhibited increased brain activity during the perception of emotional faces relative to neutral ones in multiple brain regions, including multiple prefrontal regions bilaterally, the right amygdala, right cingulate cortex and cuneus. Group comparisons for the same contrast revealed increased activity in the healthy group in the anterior cingulate, right parahippocampal gyrus and multiple visual cortical areas, among other regions. The severity of flat affect correlated significantly with neural activity in several brain areas, including the amygdala and parahippocampal gyrus bilaterally, as well as multiple regions of the left prefrontal cortex. Taken together, these results suggest that many of the brain regions involved in emotional face perception, including the amygdala, are equally recruited in both people with schizophrenia and healthy controls, but flat affect can also moderate activity in some other brain regions, notably in the left amygdala and parahippocampal gyrus bilaterally. These effects were observed in the context of no significant group differences in the volume of the amygdala.
Brain activations during facial emotion perception in healthy subjects and schizophrenia
Our experimental task activated brain regions involved in emotional processing in both groups. This included the right amygdala, the prefrontal cortex bilaterally, the right cingulate gyrus and the cuneus in the occipital cortex, among other regions. Our results partly replicate those of a recent meta-analysis on facial emotion processing (Li et al. Reference Li, Chan, McAlonan and Gong2009) by showing the contribution of the amygdala to emotional face processing. It is notable that amygdala activity during facial emotion perception can increase irrespective of emotional valence, as a recent meta-analysis of 148 functional neuroimaging studies suggests (Sergerie et al. Reference Sergerie, Chochol and Armony2008). Similarly, the cingulate gyrus has been implicated in emotional processing (Phan et al. Reference Phan, Wager, Taylor and Liberzon2002). Multiple inferior and superior prefrontal regions bilaterally also exhibited increased activity for emotional faces relative to neutral ones, as has been previously observed (Sergerie et al. Reference Sergerie, Lepage and Armony2005).
In the healthy control subjects, increased activity relative to the schizophrenia group was also observed for the left anterior cingulate, the left thalamus, right cerebellum and multiple occipito-temporal regions bilaterally. These latter regions are known to be involved in early visual processing of emotional stimuli (Adolphs, Reference Adolphs2002). Unexpectedly, we did not observed any significant group differences in amygdala, fusiform or prefrontal activity as reported by Li et al. (Reference Li, Chan, McAlonan and Gong2009) in their meta-analysis of facial emotion processing in schizophrenia. In a recent fMRI study by Gur et al. (Reference Gur, Loughead, Kohler, Elliott, Lesko, Ruparel, Wolf, Bilker and Gur2007) on emotional face processing in schizophrenia, neural activity during the presentation of sad and happy facial expressions did not produce any significant group differences. Indeed, no significant group differences were observed for sad and happy faces relative to neutral faces, whereas such group differences were observed for threat-related emotions, namely anger and fear. Hence, it could be the case that group differences are more apparent for threatening faces, and there is evidence that such stimuli are processed differently in schizophrenia, especially in those with more negative symptoms (Van't Wout et al. Reference Van't Wout, van Dijke, Aleman, Kessels, Pijpers and Kahn2007; Michalopoulou et al. Reference Michalopoulou, Surguladze, Morley, Giampietro, Murray and Shergill2008).
Flat affect and neural activity during facial emotion perception in schizophrenia
We observed a significant correlation between neural activity in the left prefrontal cortex and the amygdala bilaterally and severity of flat affect. Few studies have examined the relationship between emotional processing and flat affect using functional brain imaging techniques. Fahim et al. (Reference Fahim, Stip, Mancini-Marie, Mensour, Boulay, Leroux, Beaudoin, Bourgouin and Beauregard2005) compared a group of schizophrenia patients with significant flat affect [Positive and Negative Syndrome Scale (PANSS) blunted affect item value of 5.5] with a group of schizophrenia patients without flat affect (PANSS blunted affect item value of 1.45). Using an fMRI block design, they compared the passive viewing of negative images from the International Affective Picture System (IAPS; Lang et al. Reference Lang, Bradley and Cuthbert1995) with that of neutral visual stimuli. Group comparisons revealed that the schizophrenia patients with low flat affect exhibited greater activity relative to the significant flat affect group in the left anterior cingulate cortex [Brodmann area (BA) 32], right orbitofrontal cortex (BA 47), left medial prefrontal cortex (BA 10) and left fusiform gyrus (BA 36). The authors suggested that flatness of affect in schizophrenia is related to abnormal activity of limbic and paralimbic cortical regions that are normally implicated in emotion processing. These results involve different brain regions than those observed in the current study and the stimuli used (IAPS collection) probably evoked a stronger emotional response than the use of sad and happy faces. Future studies might examine the relationship between flat affect severity and emotional processing across varying levels of arousal and valence.
More recently, Gur et al. (Reference Gur, Loughead, Kohler, Elliott, Lesko, Ruparel, Wolf, Bilker and Gur2007) conducted an fMRI study on flat affect and emotional face processing and examined four different types of facial emotions; sad, happy, fearful and angry. They observed a significant correlation between amygdala activity during the presentation of fearful faces and flat affect rating in a cohort of 16 people with schizophrenia. No such associations were reported for the other emotional expressions. The present results are at odds with this previous study, showing an association for sad and happy expressions relative to neutral faces with flat affect severity. Perhaps the larger sample size in the present study conferred greater statistical power. Clearly, there is a need to replicate those findings with an association between amygdala activity and flat affect severity. Both studies, however, reported an association in the same direction; namely, increased amygdala activity associated with higher flat affect rating. The present results, along with those of Gur et al. (Reference Gur, Loughead, Kohler, Elliott, Lesko, Ruparel, Wolf, Bilker and Gur2007), converge in identifying increased amygdala activity as a neural correlate of flat affect in schizophrenia.
We also observed a similar effect in an inferior and a superior left prefrontal region and in a left premotor area. Neuroimaging studies have related negative symptom severity in schizophrenia to decreased volume in brain regions that include the frontal cortex (Gur et al. Reference Gur, Cowell, Latshaw, Turetsky, Grossman, Arnold, Bilker and Gur2000; Lacerda et al. Reference Lacerda, Hardan, Yorbik, Vemulapalli, Prasad and Keshavan2007; Nesvag et al. Reference Nesvag, Saetre, Lawyer, Jonsson and Agartz2009). Although none of those studies examined flat affect in isolation, it could be the case that increased activity superimposed on structural abnormalities characterize this negative symptom.
Amygdala volume in schizophrenia
Reviews of MRI volumetric findings in schizophrenia (Shenton et al. Reference Shenton, Dickey, Frumin and McCarley2001; Lawrie et al. Reference Lawrie, Whalley, Job and Johnstone2003) suggest that the amygdala is significantly smaller in patients with schizophrenia compared with healthy subjects, but this conclusion is not well supported by post-mortem studies. Chance et al. (Reference Chance, Esiri and Crow2002) performed a post-mortem study of amygdala volume in schizophrenia and did not find any significant reduction relative to healthy comparison subjects. These authors also noted that the structural neuroimaging literature is equivocal concerning the integrity of the volume of the amygdala in schizophrenia. They observed that volume change in the left anterior amygdala/hippocampal complex was significantly correlated with PANSS negative symptoms. More recently, Berretta et al. (Reference Berretta, Pantazopoulos and Lange2007), in another post-mortem study, also failed to find any reduction of amygdala volume in schizophrenia.
In addition, some structural neuroimaging studies in schizophrenia did not observe significantly smaller amygdala volume in schizophrenia. For example, Tanskanen et al. (Reference Tanskanen, Veijola, Piippo, Haapea, Miettunen, Pyhtinen, Bullmore, Jones and Isohanni2005) did not observe any significant difference in amygdala volume as determined with MRI between a group of 56 people with schizophrenia and a group of 104 healthy comparison subjects. Amygdala protocols vary greatly from one study to another and this could account for the discrepancy observed in the literature. Moreover, our study had a relatively small sample size to detect such a group difference.
Face processing and emotional valence rating in schizophrenia
Both groups performed very well on the gender discrimination task that was used during fMRI scanning. As in a previous study (Harvey et al. Reference Harvey, Bodnar, Sergerie, Armony and Lepage2009), we observed that people with schizophrenia were as accurate as healthy controls in determining the emotional valence of facial expressions. This last finding is not in contradiction with the vast literature on facial emotion perception and discrimination reviewed in the Introduction because our valence task involved determining the positive or negative aspect of an emotional expression and not discriminating among multiple positive and negative emotions. In sum, our schizophrenia group did not show signs of a deficit in face processing or in emotional valence rating. Hence, the group difference observed between the control group and the schizophrenia group involving greater neural activity in multiple visual areas in the former cannot be attributed to a performance difference between the two. It is likely that the schizophrenia group did not process the face stimuli to the same extent as healthy controls. Indeed, recent studies have established a face-processing deficit in schizophrenia specifically related to configural processing (Chen et al. Reference Chen, Norton, Ongur and Heckers2008; Shin et al. Reference Shin, Na, Ha, Kang, Yoo and Kwon2008).
Limitations
Several limitations are important to consider in the present study. First, it could be argued that the implicit task used during the presentation of faces (gender decision) did not specifically focus on facial emotion processing. However, several other studies have used a similar gender decision task (e.g. Johnston et al. Reference Johnston, Stojanov, Devir and Schall2005; Williams et al. Reference Williams, Das, Liddell, Olivieri, Peduto, David, Gordon and Harris2007; Hall et al. Reference Hall, Whalley, McKirdy, Romaniuk, McGonigle, McIntosh, Baig, Gountouna, Job, Donaldson, Sprengelmeyer, Young, Johnstone and Lawrie2008; Michalopoulou et al. Reference Michalopoulou, Surguladze, Morley, Giampietro, Murray and Shergill2008) and the meta-analysis of Li et al. (Reference Li, Chan, McAlonan and Gong2009) suggests that both the explicit and the implicit processing of facial emotions lead to similar patterns of activity, notably in the amygdala. Second, the distribution of flat affect rating was skewed, with several participants having a rating of 0, as can be seen in the scatterplots of Fig. 2b. Future studies might examine people with more severe flat affect, as in the study of Fahim et al. (Reference Fahim, Stip, Mancini-Marie, Mensour, Boulay, Leroux, Beaudoin, Bourgouin and Beauregard2005) . In addition, it will be important to examine whether flat affect severity correlates with other negative symptoms, notably apathy (Foussias & Remington, Reference Foussias and Remington2008) and it will also be important to assess the presence of negative symptoms in healthy participants. Third, note that we did not administer a rating scale to assess the presence and severity of depressive symptoms. As such, we cannot rule out depressive symptoms contributing to the rating of flat affect. However, no participants reported the presence of a current episode of major depression on the SCID. Finally, several of the schizophrenia patients were either taking antidepressants (e.g. SSRIs) or antipsychotics with serotonergic actions (e.g. olanzapine, quetiapine, etc). Several studies have shown that short-term administration of SSRI medication can increase the processing of both negative and positive facial emotion (Merens et al. Reference Merens, Willem and Spinhoven2007) and the same observation was recently made in depressed patients (Tranter et al. Reference Tranter, Bell, Gutting, Harmer, Healy and Anderson2009). Moreover, a recent pharmacological fMRI study reported that citalopram (an SSRI) increased amygdala activity to happy faces relative to placebo control (Norbury et al. Reference Norbury, Taylor, Selvaraj, Murphy, Harmer and Cowen2009). Hence, we cannot rule out a moderating effect of serotonergic medication on the present results.
Conclusions
This study suggests that emotional face perception can recruit the same limbic and prefrontal regions in people with schizophrenia and healthy controls, but that the latter show more activity in brain regions involved in early visual processing. Interestingly, flat affect severity significantly modulated activity in the amygdala bilaterally and in the left prefrontal cortex, suggesting that flat affect could be related to increased limbic activity, particularly in the amygdala, in relation to the presentation and processing of emotional stimuli. Importantly, these fMRI findings were observed in the context of no significant group differences in valence ratings or in the volume of the amygdala.
Acknowledgements
This study was supported by a grant from the Canadian Institutes of Health Research (no. 53280). M.L. is supported by a salary award from the Fonds de la Recherche en Santé du Québec. We thank Alain Cormier and the staff of the Brain Imaging Centre of the Montreal Neurological Institute for their technical expertise. We thank Tom Howells for reading the manuscript.
Declaration of Interest
None.