Introduction
The Himalayas are one of the most diverse regions of the Northern Hemisphere (Fjeldså et al. Reference Fjeldså, Bowie and Rahbek2012, Favre et al. Reference Favre, Päckert, Pauls, Jähnig, Uhl, Michalak and Muellner‐Riehl2015, Martens Reference Martens, Miehe and Pendry2015) and recognized as one of the 36 global biodiversity hotspots (Marchese Reference Marchese2015). The World Wildlife Fund (WWF) ranked the Western Himalayas as an ecoregion with several sub-regions, including the Western Himalayan Sub-alpine Conifer Forests (Wikramanayake et al. Reference Wikramanayake, Dinerstein and Loucks2002). The latter extends along an elevational belt ranging from 3,000 to 3,500 m asl from the Kali Gandaki River Valley in central Nepal across north-west India to eastern Pakistan and it harbours 285 bird species, nine of which are considered “endemic or near-endemic” (Wikramanayake et al. Reference Wikramanayake, Dinerstein and Loucks2002). The Western Himalayan Sub-alpine Conifer Forest is home to the Koklass Pheasant Pucrasia macrolopha, Himalayan Monal Lophophorus impejanus, and the near-endemic Western Tragopan Tragopan melanocephalus. With an estimated population of about 3,300 mature individuals and a decreasing population trend, the Western Tragopan is presently classified as ‘Vulnerable’ on the IUCN Red List (BirdLife International 2017) and is included in CITES Appendix 1.
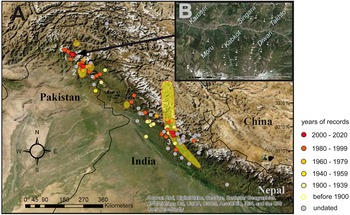
The distribution range of T. melanocephalus extends from the Swat Valley in northern Pakistan toward Indus Kohistan, the Kaghan Valley, Kashmir, Himachal Pradesh Gharwal, and possibly into Uttarakhand (Fig. 1; BirdLife International 2001, 2020, Del Hoyo and Collar Reference DelHoyo and Collar2014). Within this range, the species inhabits extremely steep terrain covered with undisturbed moist deciduous forests and temperate coniferous forests with a dense shrub understorey (Ali and Ripley Reference Ali and Ripley1983, Islam and Crawford Reference Islam and Crawford1987). However, IUCN emphasized a need for further surveys to “increase the knowledge of its current distribution and abundance”.
A) Distribution of the Western Tragopan Tragopan melanocephalus. The yellow shaded area represents the distribution range according to BirdLife International; dots mark occurrences before spatial filtering, colors refer to collection dates; numbers show hotspots of regional surveys and monitoring programs in the 21st century: 1 = Palas Valley, 2 = Machiara Valley, 3 = Great Himalayan National Park; B) study site Palas Valley, Pakistan, with 23 census points (flagged sites) in six side valleys.

Generally, expert-prepared range maps (e.g. BirdLife International 2020), are approximations of a species’ distribution and differences from occurrence point maps or modeled range estimates are expected. A recent study demonstrated that the IUCN range maps overestimated distributional ranges of 294 galliform species when compared to occurrence point maps (Ramesh et al. Reference Ramesh, Gopalakrishna, Barve and Melnick2017, Rotenberry and Balasubramaniam Reference Rotenberry and Balasubramaniam2020). For the Western Tragopan, IUCN range maps extend onto the high alpine area of the Qinghai-Tibet Plateau in Ladakh where the species has never been recorded, while numerous recent records confirm occurrences from well outside of the estimated range (Fig. 1, areas 1-3) including the Palas Valley in northern Pakistan (Fig. 1, area 1).
The Palas Valley provides a large extent of pristine forests and represents one of the most important refugia for the Western Tragopan (Raja et al. Reference Raja, Davidson, Bean, Drijvers, Showler and Barker1999, Saqib et al. Reference Saqib, Malik and von Wehrden2013). While the species has been intensively surveyed in other parts of its range (Fig. 1A; Miller Reference Miller2010, Saqib et al. Reference Saqib, Malik and von Wehrden2013, Shabbir et al. Reference Shabbir, Anwar, Mahmood and Beg2018) the Palas Valley has received little attention. Himalayan pheasant species are generally sensitive to disturbance (Wikramanayake et al. Reference Wikramanayake, Dinerstein and Loucks2002) and the presence of herders, livestock, and collectors of medicinal plants and fungi have been discussed as major threats for the Western Tragopan (BirdLife International 2001, Saberwal et al. Reference Saberwal and Chhatre2001, Mahabal and Tak Reference Mahabal and Tak2002, Miller Reference Miller2010). Local case studies (e.g. Miller Reference Miller2010, Jolli and Pandit Reference Jolli and Pandit2011a,Reference Jolli and Panditb), and interviews with local people (e.g. Awan and Buner Reference Awan and Buner2014) identified negative effects of disturbance on T. melanocephalus but did not quantify pressure levels.
Here we provide new occurrences and abundance data from the Palas Valley collected between 2017 and 2019 and assess major anthropogenic disturbance factors. In addition, we present range estimates derived from environmental niche models (ENMs) to determine the present and infer the past and potential future distribution of the Western Tragopan. Niche modelling approaches have previously been applied to identify suitable habitat for T. melanocephalus in north-east Pakistan (Ahmad et al. Reference Ahmad, Sharma, Pacchnanda, Suhai, Deb, Bhatnagar and Kaul2017, Ali et al. Reference Ali, Akram, Abbas, Ahmed, Qamer, Khan, Awan, Ali, Chaudry, Saghir and Nagai2015), and the Indian Western Himalaya (Singh et al. Reference Singh, Kumar, Kumar and Singh2020). However, due to a very regional focus of these studies results may not be transferrable across the entire distributional range of the species. Thus, ENMs based on range-wide occurrence data might provide an improved estimate of the extent of climatically suitable space for the Western Tragopan and the potential impacts of anthropogenic climate change.
Methods
Study area
The Palas Valley (Kohistan district, Pakistan) situated on the eastern bank of the Indus River, covers an area of ~1,400 km2 and an elevation of ~1,000 to ~5,200 m. It extends across two drainage basins (upper and lower Palas) isolated by a ridge. The area is home to at least 157 bird species (Raja et al. Reference Raja, Davidson, Bean, Drijvers, Showler and Barker1999). Our surveys were conducted in six side-river valleys of the upper Palas (Figs. 1B, 2) in 2017, 2018, and 2019 respectively. Three of these valleys (Takhto, Singara, and Karoser) are located on south-facing slopes north of the Musha’ga river, while the remaining three (Moru, Kabkot, and Diwan) are situated on the north-facing slopes south of Musha’ga.
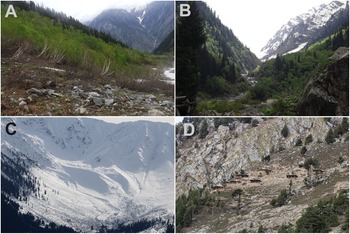
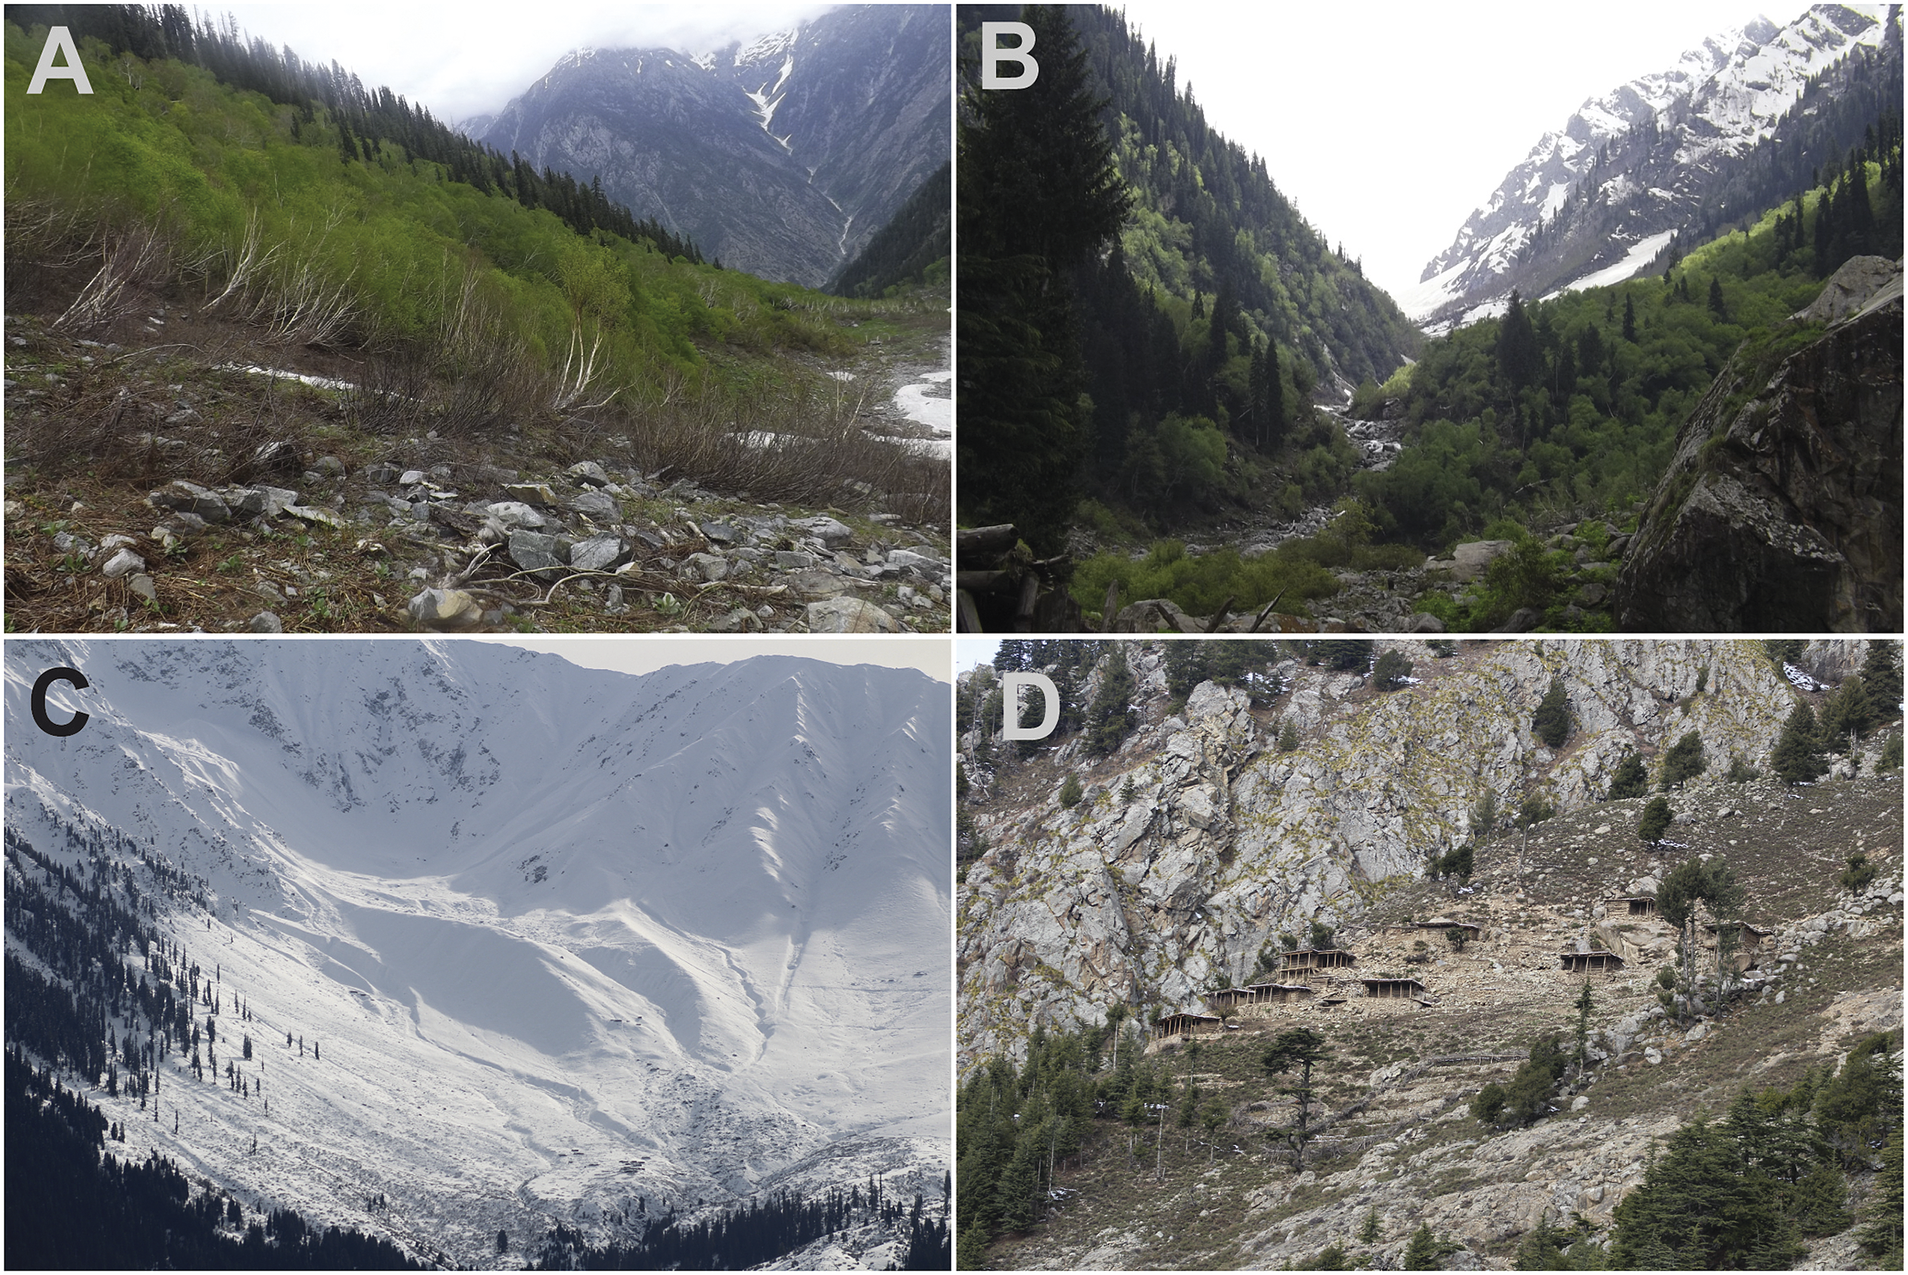
Study sites in the Palas Valley during summer surveys (A, B: June 2018) and winter surveys (C, D: November 2019); A) Diwan Valley, dense stands of Betula utilis in the foreground, view towards less densely forested Takhto Valley in the North; B) Diwan Valley, dense mixed conifer forest; C) Moru Valley, snow-covered northern aspects provide suboptimal habitat; D) Karoser Valley, southern aspects with less snow-cover provide suitable winter habitats.
Call count surveys
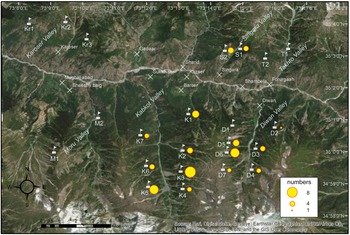
Dawn call-counts (Duke Reference Duke, Hill, Garson and Jenkins1991) were used to quantify breeding populations. A total of 23 census points situated within suitable habitat were selected (Fig. 3) and surveyed for 30 minutes in the early morning as recommended by Gaston et al. (Reference Gaston, Hunter and Garson1981) and Duke (Reference Duke, Hill, Garson and Jenkins1991).
Because the vocal activity of Asian pheasants is highest at the beginning of the breeding period (Duke Reference Duke, Hill, Garson and Jenkins1991, Miller Reference Miller2010) and strongly decreases in response to unfavourable weather conditions (e.g. heavy rainfall), call count surveys were restricted to dry and warm weather in April–May 2017 and 2018. At each census point the number of calling individuals was recorded along with altitude, GPS coordinates, and habitat characteristics such as predominant tree and shrub species. We surveyed one census point per morning. We arrived at a census point before dawn and started our observation period with the first call of a Western Tragopan, recording the number of calls during a time period of 30 min. To distinguish between calling individuals we noted the direction and the approximate distance of calling individuals within a listening radius of 300 m (Gaston et al. Reference Gaston, Hunter and Garson1981, Miller Reference Miller2010, Awan and Buner Reference Awan and Buner2014).
Surveys of seasonal distribution
Comparison quantified local abundances in summer and winter habitats via call count surveys is problematic because vocal activity of Western Tragopans strongly decreases outside the breeding season. Therefore, seasonal distributions of pheasants across the six side-valleys were previously determined and compared using ‘opportunistic sampling’ (Soldatini et al. Reference Soldatini, Albores-Barajas and Pellizi2010, Elsen et al. Reference Elsen, Kalyanaraman, Ramesh and Wilcove2017, Ramesh et al. Reference Ramesh, Gopalakrishna, Barve and Melnick2017) that included all records of sightings, calls, and other evidence such as lost feathers in an area. To account for seasonal changes in local distribution, we surveyed all six side valleys towards the end of the breeding season (June 2018; Fig. 2A, B) and winter (November 2019; Fig. 2C, D). For each occurrence, the date, GPS coordinates, and elevation were recorded. Local summer and winter occurrences were visualized in a map using ArcGIS. Because no local abundances were evaluated in these surveys these data were not subject to any further statistical analysis.
Anthropogenic disturbance analyses
We estimated potential sources of anthropogenic disturbance on the basis of 106 questionnaires handed out to local villagers. We inferred sizes of herds (goats and sheep), numbers of herding dogs, hunters, and collectors of mushrooms and medicinal plants who regularly visit the area during highly sensitive periods of the breeding season (incubation and parental care). To quantify local disturbance, we calculated a total of six categorical disturbance indices for livestock (sheep, goats) and herding dogs and human disturbance (hunters and collectors) each based on the number of individuals that invaded the breeding areas. Based on these counts, we assigned low, moderate, or high disturbance levels/categories to each census point (Table 1, and Tables S1, S2 in the online supplementary material). To account for temporal effects, disturbance indices for livestock (goats, sheep, and dogs) were corrected and set to 0 for those sites where the major parts of herds arrived at a very late stage of the breeding season. Since human disturbance (plant and in particular mushroom collection) starts in early March (Sher et al. Reference Sher, Aldosari and Bussmann2015, Laala et al. Reference Laala, Raja, Irshad, Gardezi and Akram2020) and therefore overlaps call counts, no correction was required.
Four categories of disturbance levels based on livestock numbers and people visiting the study area per season as inferred from questionnaires of 106 local persons; three livestock disturbance levels were classified according to numbers of goats, sheep and dogs accompanying herds; three anthropogenic disturbance levels were classified according to numbers of mushroom collectors, medicinal plant collectors and hunters.

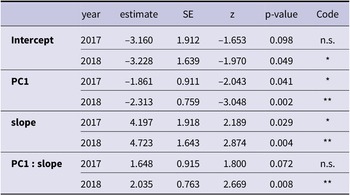
To test for possible effects of environmental variables on local abundance we applied Generalized Linear Models (GLMs) with Poisson-error structure and local count numbers (from 23 census sites) as response variable, using R version 3.6.1 (R Core Team 2019). In the first pilot runs with GLMs that included all environmental predictor variables, models did not converge due to very strong collinearity between predictors (e.g. the variables “goats”, “sheep” and “dogs” contained almost the same information; correlation coefficient close to 1). We therefore decided to condense the six environmental variables using principal component analysis (PCA). We relied on the first two principal component axes (PC1 and PC2) to model the effects of livestock and anthropogenic disturbance factors on local T. melanocephalus abundance. To account for an effect of multiple counts from the same census site (from successive annual surveys) we decided to run separate models for the different survey years (2017 and 2018). For each survey year, we ran two GLMs: a) including PC1 and PC2 as fixed effects and b) including PC1, slope (north-facing or south-facing) and the interaction between PC1 and slope as fixed effects. The intention of (b) was to allow testing for the impact of livestock and anthropogenic disturbance independently for north- and south-facing slopes. To test whether slopes predicted by the models differed from 0, we used the emmeans package (Lenth Reference Lenth2020). All tests were performed on the log-link scale of the original model coefficients. We provide the R script in Appendix S1.
Environmental niche models
We applied ENMs to estimate the current and infer the past and future potential distribution of the Western Tragopan. Occurrences from our own field research were supplemented with records from online databases (GBIF: http://data.gbif.org, VertNet: http://vertnet.org [metadatabase of mainly US American museum collections], Xeno-canto: https://www.xeno-canto.org [global database of sound recordings], and the Oriental Bird Club Image database: http://orientalbirdimages.org [image database of Asian bird species]), records obtained from BirdLife International (2001), and scientific publications (Table S3). All records were examined for vague or imprecise locality information to ascertain their reliability (Awan et al. Reference Awan, Buner and Kingdon2016). Records lacking coordinates were georeferenced using Google Earth. The final set of 176 records (Fig. 1A; Table S3) was filtered to a Euclidian distance of 5 km to remove spatially clustered occurrences, retaining 83 unique records for model building. As predictors we obtained a global terrain model (GEBCO Compilation Group, 2020) and a set of 19 bioclimatic variables with a spatial resolution of 2.5 arc-minutes representing annual trends, seasonality, and limiting environmental factors from WorldClim (http://worldclim.org, Hijmans et al. Reference Hijmans, Cameron, Parra, Jones and Jarvis2005). To prevent multicollinearity among predictors during projection (Braunisch et al. Reference Braunisch, Coppes, Arlettaz, Suchant, Schmid and Bollmann2013, Dormann et al. Reference Dormann, Elith, Bacher, Buchmann, Carl, Carré, García Marquéz, Gruber, Lafourcade, Leitão, Münkemüler, McClean, Osborne, Reineking, Schrörder, Skidmore, Zurell and Lautenbach2013) we selected nine uncorrelated (Pearson correlation coefficient R2 ≤ 0.70) predictors (bio 2, bio 3, bio 7, bio 10, bio 13, bio 15, bio 17, bio 19, and elevation) based on jackknifing and variable importance of an initial run. To reconstruct the potential distribution during the Last Glacial Maximum (LGM; ~22,000 years before present) we obtained matching predictors from climate reconstructions based on three general circulation models (GCMs); namely the Community Climate System Model (CCSM4) (Gent et al. Reference Gent, Danabasoglu, Donner, Holland, Hunke, Jayne, Lawrence, Neale, Rasch, Vertenstein, Worley, Yang and Zhang2011), the Max-Planck-Institute Earth System Model P (MPI-ESM-P), and the Model for Interdisciplinary Research on Climate (MIROC) (Hasumi and Emori Reference Hasumi and Emori2004) from WorldClim. To predict the potential impacts of future climate change we obtained 11 future simulations for 2070 (representing an average for 2061–2080) derived from downscaled climatologies of the Coupled Modelling Intercomparison Project 5 (CMIP5). For each simulation four representative concentration pathways (RCPs), describing possible future greenhouse gas concentration trajectories including moderate (RCP 2.6), intermediate (RCP 4.5, RCP 6.0) and extreme conditions (RCP 8.5) were obtained from WorldClim.
We employed the machine learning algorithm MaxEnt 3.4.1 (Phillips et al. Reference Phillips, Anderson and Schapire2006, Reference Phillips, Dudík, Robert and Schapire2019, Phillips and Dudík Reference Phillips and Dudík2008) with a circular buffer of 200 km surrounding each record used as background for model training and a rectangular bounding box as projection area. The feature classes linear, quadratic, and product were selected. A bootstrapping method with 100 replicates, randomly splitting the data set into a training (80%) and a testing subset (20%), was applied. Extrapolation was not allowed to reduce uncertainties due to projections onto non-analogous climates (Fitzpatrick and Hargrove Reference Fitzpatrick and Hargrove2009, Rocchini et al. Reference Rocchini, Hortal, Lengyel, Lengyel, Jiménez-Valverde, Ricotta, Bacaro and Chiarucci2011). Subsequently the resulting model was projected onto paleoclimatic conditions of the LGM and future climate change scenarios respectively. For all projections we applied multivariate environmental similarity surface (MESS) analyses (Elith et al. Reference Elith, Kearney and Phillips2010) to identify areas where one or more predictor variables experience conditions beyond the respective calibration range.
For current as well as LGM and future projections, the area under the curve (AUC) was used as a threshold-independent measure of discrimination ability (Swets Reference Swets1988, Ling et al. Reference Ling, Huang, Zhang, Xiang and Brahim2003). An AUC score of 1 refers to a perfect fit of the data while a score of 0.5 is considered no better than random (Elith et al. Reference Elith, Graham, Anderson, Dudík, Ferrier, Guisan, Hijmans, Huettmann, Leathwick, Lehmann, Le, Lohmann, Loiselle, Manion, Moritz, Nakamura, Nakazawa, Overton, Peterson, Phillips, Richardson, Scachetti-Pereira, Schapire, Soberón, Williams, Wisz and Zimmermann2006, Phillips et al. Reference Phillips, Anderson and Schapire2006). The average projection across all replicate runs was used for further processing, wherein the ‘10 percentile training presence cloglog threshold’ was applied as presence-absence threshold.
Results
Field surveys
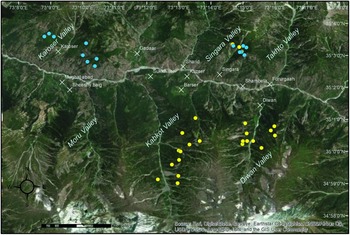
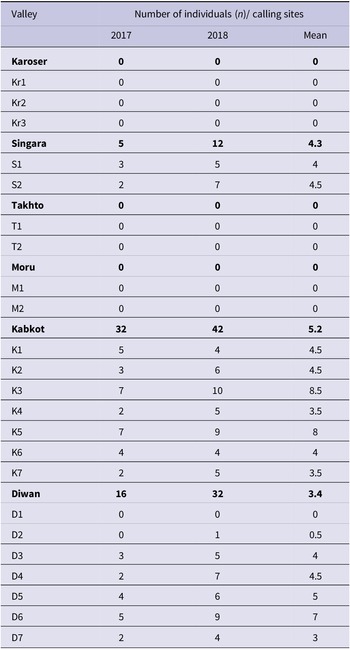
During the breeding season, calling individuals could be recorded at 15 of the 23 census points located in three valleys: Kabkot and Diwan on the north-facing slopes, and Singara at the south-facing slopes (Figs 3, 4). In Kabkot and Diwan, Western Tragopans were recorded in dense mixed coniferous-deciduous forests (Fig. 2A, B) dominated by Abies pindrow and Pinus wallichiana with a higher proportion of birch Betula utilis in Diwan (Fig. 2A). Forest vegetation in the Singara Valley was characterized by the presence of oak Quercus spp. During the winter survey in November 2019, Western Tragopan were exclusively recorded from two side valleys on the sun-exposed south-facing slopes north of the main river (Figs. 2D, 4), whereas the species was not recorded in breeding habitats on the now snow-covered north-facing slopes (Figs 2C, 4).
Local abundances of Western Tragopan Tragopan melanocephalus in the Palas Valley, Pakistan, inferred from call count surveys across 23 census sites (flagged sites: (Kr1-Kr3, S1-S2, T1-T2, M1-M2, K1-K7, D1-D7), during the breeding season (surveys in April and May 2017 and 2018); circle size equivalent to mean numbers of counted individuals across two years of survey.

Local distribution of Western Tragopan (Tragopan melanocephalus) occurrences in the Palas Valley, Pakistan, during the breeding season (June 2018; yellow dots) and winter season (November 2019; blue dots); each dot refers to one sighting.

Local numbers of birds per census point inferred from call counts during the breeding season ranged between two and seven in 2017 and 5 and 10 in 2018, with highest individual numbers recorded in Kabkot Valley (Table 2; Fig. 3).
Individual numbers of Western Tragopan Tragopan melanocephalus observed at 23 census points (Kr1-Kr3, S1-S2, T1-T2, M1-M2, K1-K7, D1-D7) during call count surveys in 2017 and 2018 (including means from both years); population density estimated for an assumed survey area of 0.28 km square per census point.

Anthropogenic and livestock pressure differed greatly among the six side valleys. Highest disturbance indices were estimated for the Moru Valley, where highest numbers of herds were registered (120–150 herds totalling 2,000–2,500 individuals; Tables S1, S2). With no regular visits of herds during the study period, Singara had the lowest livestock disturbance.
In both PCAs (disturbance variables uncorrected and corrected for timing of arrival) the first principal component (PC1) explained 63% and 67% of the total variation, respectively, and showed strongest positive correlations with livestock pressure variables (numbers of sheep, goats, and dogs; factor loadings ranged between 0.53 and 0.56; for details see Table S4). PC2 explained 14% and 24% of the total variance, respectively, but, unlike PC1, was positively correlated with livestock pressure variables but negatively correlated with anthropogenic pressure variables (Table S4). For both study seasons (2017, 2018) GLMs revealed a significant effect of disturbance levels on local abundance of Western Tragopans (Tables 3a, 3b) with numbers of calling individuals decreasing with increasing local disturbance from livestock (Fig. 5; Table 3a; only the effect of PC1 in 2017 was marginally not significant [P = 0.051]). This effect was generally confirmed when testing separately for data subsets from opposite slopes in the Pallas Valley (shown for PC1 in Fig. 6; model coefficients under “PC1” in Table 3b refer to the south-facing slope; for the north-facing slope, on the log-link scale [2017/2018]: estimate = –0.213/–0.278, SE = 0.091/0.076, z = –2.343/–3.683, P = 0.019/ <0.001).
Model coefficients (including standard error= SE and z-test statistics when tested vs. 0) of GLMs for field data from all 23 census points for the first two principal components (based on six environmental variables of livestock and anthropogenic disturbance) for each of the two survey seasons (2017 and 2018); coefficients and SE are presented on the log-link scale; z value= estimate / SE; significance codes: n.s. = not significant; p< 0.05 = *; p < 0.01 = **; p < 0.001 = ***.

Model coefficients (including standard error = SE and z-test statistics when tested vs. 0) of GLMs for field data from all 23 census points for slope (south- or north-facing), the first principal component (based on six environmental variables of livestock and anthropogenic disturbance) and their interaction, for each of the two survey seasons (2017 and 2018); coefficients and SE are presented on the log-link scale; z value= estimate / SE; significance codes: n.s. = not significant; P < 0.05 = *; P < 0.01 = **; P < 0.001 = ***.

Local abundances of calling Western Tragopans across all 23 survey sites in response to PCA-based disturbance variables (PC1 and PC2 for six predictor variables [numbers of goats, sheep, dogs, plant collectors, mushroom collectors and hunters]) during two field seasons; solid lines = GLM smoothing curves, grey shades = 95% confidence bands.

Local abundance of calling Western Tragopans in response to PCA-based disturbance variables (PC1 for six predictor variables [numbers of goats, sheep, dogs, plant collectors, mushroom collectors and hunters]) at different slopes (south-facing: n = 7 sites; north-facing, n = 16 sites) during two field seasons; solid lines = GLM smoothing curves, grey shades = 95% confidence bands.

Species distribution models
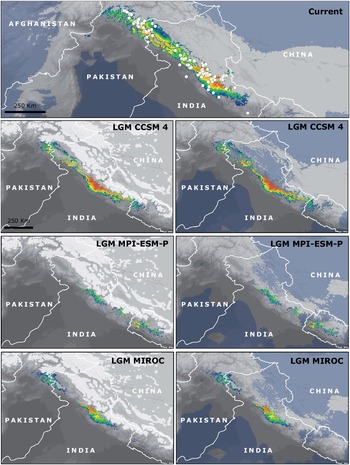
The discrimination ability of the model for current climatic conditions was high across replicate runs (AUCtraining = 0.95 ± 0.01 SD; AUCtest = 0.94 ± 0.01 SD). The model predicted climatically suitable space to stretch along the Pakistan and India portions of the Western Himalayas (Fig. 7). The extent of potentially suitable space measures approximately 750 km x 50 km and extends from Mingora in northern Pakistan to Uttarkashi in India with an area of highest predicted suitability for Western Tragopan between Palampur and Rohru in India (Fig. 7).
Top: Current potential distribution of the Western Tragopan as derived from MaxEnt with records used to build the model displayed as white dots. Below: Projections onto climatic conditions of the Last Glacial Maximum (LGM) according to the global circulation models CCSM4, MPI-ESM-P, and MIROC. Suitability ranges from moderate (dark blue) to high (red). On the left, the extent of ice sheets during the LGM is displayed as light grey area (https://crc806db.uni-koeln.de/layer/show/6) while on the right MESS areas where climatic conditions exceed those of the calibration range are displayed in blue.

Model projections onto paleoclimatic reconstructions received high AUC scores as well (AUCtest CCSM4 = 0.94 ± 0.01 SD; AUCtest MPI-ESM-P = 0.94 ± 0.01 SD; AUCtest MIROC = 0.94 ± 0.01 SD). While all three models consistently suggest that the extent of suitable space for Western Tragopan was smaller during the LGM, they significantly differ in predicted extents of suitable space. The CCSM4 projection predicted the largest extent (72% of the area presently predicted as suitable) and suggests that suitable space has only slightly shifted north since the LGM (Fig. 7). However, the MPI-ESM-P and MIROC projections concordantly suggest that suitable space will be restricted to small glacial refugia (measuring only 24% and 39% of the area of the current climate model respectively) situated in the eastern parts of the present distributional range (Fig. 7) including areas, where the species is not present today, e.g. western Nepal (Fig. 7).
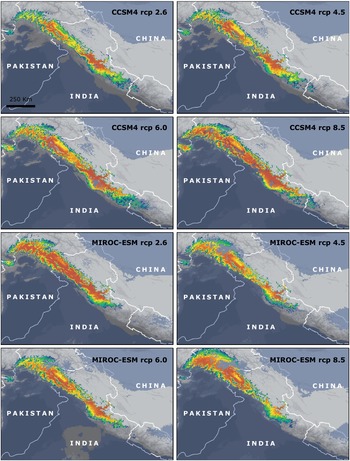
Projections onto future climate change scenarios derived from 11 GCMs were inconclusive. Seven simulations predicted suitable space to increase across all four RCPs while two GCMs were conclusive across all RCPs in predicting suitable space to shrink in response to climate change (Fig. 8, Figs. S1-S5; Table 4, Table S1). The remaining two GCMs yielded mixed results, with a slight decrease predicted for the moderate RCP 2.6 and increases predicted for RCPs 4.5, 6.0, and 8.5 respectively.
Potential future distribution of the Western Tragopan Tragopan melanocephalus according to MaxEnt models projected onto climatic conditions for 2070 as derived from the global circulation models; CCSM4 and MIROC. Suitability ranges from moderate (dark blue) to high (red). Regions where climatic conditions exceed those of the calibration range (MESS) are displayed in blue.

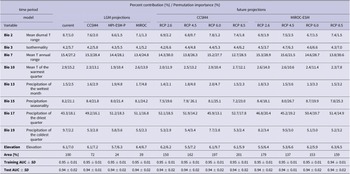
Contribution of environmental predictor variables, AUC values, and extent of environmentally suitable space for current, past, and future climatic conditions.

Both GCMs previously used for paleoclimatic reconstructions (CCSM4 and MIROC-ESM) consistently suggest climatically suitable space to expand across all RCPs by 2070. While the CCSM4 projections predict an increase between 50 and 101% (given as percentage of the current extent of suitable space) the MIROC-ESM projections suggest an increase between 37% and 79% (Fig. 8, Table 4). Variable contribution for current, past, and future climatic conditions was similar with mean temperature annual range (bio 7) having the highest contribution (permutation importance: 24.8-28.4%) to the model, followed by precipitation seasonality (Bio 15, permutation importance: 21.1-24.2%), precipitation of the driest quarter (Bio 17, permutation importance: 16.1-18.3%), mean temperature of the warmest quarter (bio 10, permutation importance: 10.4-15.2%), elevation (permutation importance: 7.0-12.1%), and isothermality (bio 3, permutation importance: 5.2-5.8%). Contribution of the remaining predictors did not exceed 5%. For details on variable contributions across all models see Table 4 and Table S1.
Discussion
Population survey and potential disturbance factors
We confirmed that 15 of the 23 census points located in the Palas Valley currently hold breeding populations of Western Tragopan and recorded a mean of 0.5–8.5 calling individuals per site. These numbers correspond to those inferred from previous monitoring results from the late 1990s and emphasize the importance of the Palas Valley for the conservation of the species (BirdLife International 2001). GLMs revealed significantly lower abundances at disturbed sites supporting the postulated sensitivity of the species to disturbance (Miller Reference Miller2010, Jolli and Pandit Reference Jolli and Pandit2011a,Reference Jolli and Panditb, Awan and Buner Reference Awan and Buner2014). We could no longer confirm the species at two sites located on north-facing slopes within the Moru sub-valley although it was previously reported to occur in this area (BirdLife International 2001). There, disturbance is associated with highest numbers of both livestock and of mushroom and plant collectors (Table S2) whose activities overlap with the early breeding season (Sher et al. Reference Sher, Aldosari and Bussmann2015). Generally, we found a greater negative effect of livestock disturbance on the Western Tragopan in the Palas Valley as compared to anthropogenic disturbance, such as collectors visiting the area. In that context, we might consider that even regular presence of livestock during the late breeding season could lead to generally less suitable or less attractive habitat for pheasant or grouse species due to a long-term effect of overgrazing (BirdLife International 2001, Dettenmaier et al. Reference Dettenmaier, Messmer, Hovick and Dahlgren2017). Accordingly, densities of other Himalayan pheasants were also found to decrease with increasing livestock pressure within the course of one year (Bhattacharya et al. Reference Bhattacharya, Sathyakumar and Rawat2009). In contrast, a comparatively lower sensitivity to regular presence of collectors or tourists might be related to the flexible foraging behaviour of some pheasant species like the Himalayan Monal Lophophorus impejanus, that was shown to shift its peak of daily activity to avoid temporal overlap with human activities (Sharief et al. Reference Sharief, Singh, Joshi, Singh, Mukherjee, Chandra, Thakur and Sharma2022).
Apart from anthropogenic disturbance, the exposure of a slope might help to explain the distribution and local abundance of Western Tragopans in the study area. According to BirdLife International (2001) sun-exposed, south-facing slopes with reduced snow cover are preferred during winter but knowledge on seasonal movements is scarce and compromised by uncertainties and discrepancies between studies and winter occurrences on scarcely vegetated, sun-exposed north-facing slopes were also reported (Mahabal and Tak Reference Mahabal and Tak2002, Sing and Tu Reference Sing and Tu2008). Nevertheless, seasonal habitat preferences might explain why we did not observe Western Tragopans at undisturbed sites in Karoser Valley on the south-facing slopes during the breeding season in three successive years, whereas birds were present in that area in winter (Fig. 4).
Past, present, and future distribution of the Western Tragopan
Compared to the species’ range depicted in the BirdLife International shape file (Fig. 1A), our model suggested a broader and less fragmented area to be climatically suitable (Fig. 7). Considering the species’ sensitivity to disturbance, these discrepancies could indicate that the observed distribution is already a result of habitat transformation and anthropogenic disturbance. Records since 2000 represented only a very limited area of the projected range, i.e. a few major national parks or nature reserves (Fig. 1: sites 1-3). From these records it is difficult to judge whether the lack of recent observations is due to a greater focus on local monitoring projects during the past two decades or whether populations where the species occurred in the 20th century have indeed gone extinct.
Because analogous data for biologically meaningful predictor variables such as vegetation or land-use are regrettably not available for the selected past and future scenarios, our niche models solely rely on terrain and climatic predictor variables. The use of predictors derived from a digital elevation model and remote sensing data in recent SDM approaches, restricted to current climatic conditions, resulted in a significantly more scattered and patchier estimate of potentially suitable space for Western Tragopans in Pakistan (Ali et al. Reference Ali, Akram, Abbas, Ahmed, Qamer, Khan, Awan, Ali, Chaudry, Saghir and Nagai2015). However, due to the very localized focus of that study which was restricted to only 32 sightings, all from the species’ extreme north-western range limits, it is possible that only a fraction of the species’ climatic niche was captured.
Paleoclimatic projections suggested that the Western Tragopan has likely survived the LGM in glacial refugia located in the Western Himalayas. According to the palynological record, paleoforest vegetation in the Western Himalayas underwent regular shifts between conifer forests dominated by Pinus and Abies species during warm cycles and evergreen oak Quercus semecarpifolia and alder Alnus forests during cold cycles (Manish and Pandit Reference Manish and Pandit2018). While these paleoforests might have harboured suitable glacial refugia for the species, fossil pollen records indicate that the higher elevations of the Western Himalayas were presumably covered by a community of Artemisia spp., chenopods, and grass, lacking suitable forest habitat (Behrensmeyer et al. Reference Behrensmeyer, Damuth, diMichele, Potts, Sues and Wing1992). According to the CCSM4 and the MIROC-ESM projections of the model climatically suitable space for the Western Tragopan was indeed restricted to small, isolated patches and had probably completely vanished from the western part of its current range. Accordingly, the mountain forests of Pakistan would have been (re-)colonized during post-glacial range expansion along forest corridors in the Kashmir Valley region.
Projections onto 11 global circulation models were inconclusive but the majority of models (including the previously used GCMs CCSM4 and MIROC-ESM) suggest that climatically suitable space for the Western Tragopan will expand rather than shrink. On that point, our results strongly disagree with Singh et al. (Reference Singh, Kumar, Kumar and Singh2020) who projected their SDM onto three RCPs (4.5, 6.0, and 8.5) of a single GCM (Miroc5) and postulated that suitable habitat in the Indian Western Himalaya will strongly decrease by 2070. In contrast the projection of our model onto the same GCM suggests climatically suitable space to increase significantly across all four RCPs (Table S1). These differences may be attributed in parts to the limited regional focus of the former study capturing only a fraction of the species’ environmental niche. However, such conflicting results demonstrate the importance of evaluating several preferably unrelated GCMs before drawing conclusions.
While environmental niche models are a suitable tool to aid conservation management decisions it is of utmost importance to be aware of their limitations. For instance, environmental niche models inferred from climate data alone cannot reflect dispersal limitations, biotic interactions, or effects of metapopulation processes. In addition, other drivers of population decline and local extinction, such as anthropogenic pressure or land use change, are not captured by climatic models but will also heavily affect the species’ future distribution. These impacts might even counteract any positive effect of the predicted increase of suitable space.
Implications for conservation management
In the 1990s, the Western Tragopan became the flagship species of the Himalayan Jungle Project. After initial opposition from villagers in remote areas, such as the Palas Valley, a continuous dialogue on sustainable forest management and hunting policies was established (Fuller and Garson Reference Fuller and Garson2000, Knudsen Reference Knudsen2009). Since 2001 the Palas Conservation and Development Project (PCDP) as the successor initiative, conducted several surveys and monitoring programmes for investigation and protection of the natural and cultural heritage of Pakistan. While in many parts of the Western Himalayas Western Tragopans suffered from habitat loss due to increased commercial exploitation of forest ecosystems (BirdLife International 2001), the Palas Valley still harbours large areas of undisturbed ‘pristine landcover’ (Saqib et al. Reference Saqib, Malik and von Wehrden2013). Yet also in the Palas Valley, logging and illegal hunting have been identified as major threats for the Western Tragopan and other pheasant species (Sutherland Reference Sutherland2000). Future conservation measures should be planned in close dialogue with local people, because for example morel Morchella spp. trade represents an important economic factor in the Palas Valley (Hamayun et al. Reference Hamayun, Khan, Ahmad, Shin and Lee2006, Sher et al. Reference Sher, Aldosari and Bussmann2015, Laala et al. Reference Laala, Raja, Irshad, Gardezi and Akram2020). At present only 2% of the species’ potential habitat in Pakistan is covered by protected areas (Awan et al. Reference Awan, Geldmann, Buner, Saqib, Pervez, Mahmood, Hashem, Al-Arjani, Alqarawi, Adh Allah and Akbar2021). For other areas, including the Great Himalayan National Park, GIS modelling of species-habitat associations suggested that only 10% of the protected area provides highly suitable habitat, whereas about 44% was unsuitable for Western Tragopans (Naithani et al. Reference Naithani, Mathur and Jeganathan2018). Future research should further determine impacts of disturbance on the local abundance of Western Tragopan. In addition, intensive surveys beyond the known major populations (Fig. 1A) are required e.g., in Northwest India (Himachal Pradhesh, Jammu and Kashmir) to assess whether extant populations of the Western Tragopan still exist west of the Great Himalayan National Park.
Acknowledgements
Academic exchange and a research visit by A.S. at the Senckenberg Natural History Collections, Dresden was funded by the Higher Education Commission Pakistan No 1-8/HEC/HRD/2919/8742. S.I. was funded by Deutsche Forschungsgemeinschaft (DFG PA1818/3-2). Wildlife watchers A. Hamza and R. Ahmad helped with the field work in Palas Valley, Pakistan. We are particularly grateful to Raffael Ernst for valuable support with GLM analyses. We cordially thank Francis Buner for helpful and constructive comments on an early draft of this manuscript.
Supplementary Materials
To view supplementary material for this article, please visit http://doi.org/10.1017/S0959270922000120.