Environmental surfaces are known to contribute to the transmission of healthcare-associated infections (HAIs). No standard sampling protocols are available for environmental surface sampling in healthcare settings.Reference Rawlinson, Ciric and Cloutman-Green1 Standardized, efficient sampling methods that include recommendations for optimum surface area to sample would provide confidence in the detection and quantification of surface contamination levels and would assist in investigations of transmission dynamics. We investigated the influence of surface area size and material on the recovery efficiency of flocked and foam swabs when each of 5 bacterial pathogens were sampled from steel and plastic coupons, typical fomite materials observed in the healthcare setting.
Methods
Stainless steel (T-304 alloy, 24-gauge, Steward Stainless Supply, Suwanee, GA) and plastic (Kydex-T, 0-80 thickness, P1 Haircell texture, Bloomsburg, PA) surfaces were washed, rinsed, and delineated into 3 sizes for comparison of sampling efficiency: 26 cm2, 323 cm2, and 645 cm2. The steel surfaces were sterilized by autoclave at 121°C for 20 minutes, and the plastic coupons were sterilized by ultraviolent radiance ≥40 µW/cm2 for 1 hour.
Suspensions of 5 healthcare bacterial pathogens were prepared. Staphylococcus aureus ATCC 43300 (MRSA), vancomycin-resistant Enterococcus Van A+256 (VRE), Acinetobacter baumannii MLST12 (AB), and carbapenemase-producing KPC+ Klebsiella pneumoniae ATCC BAA-1705 (KPC) were incubated overnight on tryptic soy agar with 5% sheep blood. Clostridioides difficile ATCC 43598 (CD) spores were prepared as described previously.Reference Hasan, Japal, Christensen and Samalot-Freire2 Serial dilutions were prepared for vegetative cells and spores then were adjusted to a final concentration of 105 colony-forming units (CFU)/mL in a body fluid simulant (artificial test soil [ATS], Healthmark Industries, Frasier, MI). Aliquots of 100 µL for the 26-cm2 coupon, 500 µL for the 323-cm2 coupon, and 1,000 µL for the 645-cm2 coupon were placed on each of the 3 surface-area coupons and 2 surface types, resulting in 104–105 CFU per coupon. The inocula were spread with a cell spreader in a Class II Biological Safety Cabinet (BSC; Nuaire, Plymouth, MN) with airflow on, then were allowed to dry for 1 hour at ambient temperature and humidity in the closed BSC with no airflow before sampling. Sampling was conducted inside the BSC with airflow on, with either a nylon flocked swab (E-swab Copan Diagnostics, Murrieta, CA) or a polyurethane foam swab (Puritan Healthcare, Guilford, ME) premoistened with 100 µL phosphate-buffered saline solution (PBST). Swabs were swiped across the surface in a uniform manner as described previously,3 then placed in test tubes for 1 hour before processing. Foam swabs were spun in a vortexer and were then sonicated for 3 cycles of 30 seconds each in 5 mL PBST. Flocked swabs were placed in Liquid Amies storage medium provided with the swab (1 mL) and an additional 4 mL PBST then vortexed and sonicated. The eluates were diluted 10-fold in series and cultured at 35°C; MRSA, VRE, and AB on TSA II with 5% Sheep Blood for 18–24 hours, KPC on MacConkey Agar (Becton Dickson, Franklin Lakes, NJ) for 18–24 hours, CD on CCFA-HT (Anaerobe Systems, Morgan Hill, CA) anaerobically for 36–48 hours. The CFUs were counted, and the percent recovered (%R) was determined relative to the inoculum CFU. Statistical significance was set at 0.05, as determined using the Kruskal-Wallis test to compare the surface area sizes in SPSS version 21 statistical software (IBM, Armonk, NY).
Results
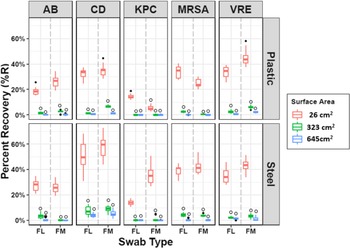
For all organisms evaluated and both swab types, the median %R was significantly greater when sampling from 26-cm2 steel surfaces (median %R, ≤59.7%) than from the 323-cm2 steel surfaces (median %R, ≤9.2%) or 645-cm2 (median %R, ≤4.8%) steel surfaces. Approximately 1 log10 fewer organisms (CFU) were recovered from 323-cm2 coupons than from 26-cm2 coupons, and 1–2 log10 fewer from 645-cm2 coupons than 26-cm2 (a decrease from 25.0% to 2.5% represents 1 log10 reduction) (Fig. 1 and Supplementary Table S1 online). The highest median %R was observed in CD sampled using either foam or flocked swabs from 26-cm2 steel coupons. In contrast, the lowest median %R was observed when KPC was sampled using foam swabs from plastic coupons (Supplementary Table S1 online).
Median percent recovered (%R) of 5 organisms (104 CFU/coupon) using foam and flocked swabs from 3 surface areas (26 cm2, 323 cm2, and 645 cm2) and 2 surface types (steel and plastic) as suspended in artificial test soil (ATS). Note: Box-and-whisker plot: box; interquartile (IQ) range, line: median, whiskers; maximum and minimum data point, closed circle symbols (•): outliers (likely due to clusters of cells being dispersed during spread-plating), open circle symbols (○): median % R values ≤ 9.2%, red box plot to left (26 cm2), green box plot in the middle (323cm2), blue box plot on the right (645 cm2). Swab types: FM, foam swabs; FL, flock swabs; organisms: AB, Acinetobacter baumannii; CD, Clostridioides difficile; KPC, Klebsiella pneumoniae; MRSA, methicillin-resistant Staphylococcus aureus; VRE, vancomycin-resistant Enterococcus faecalis (VRE).

The median %R varied with each organism, as seen in Figure 1, with the %R from 26 cm2 ranging from 14.0% for KPC to 49.6% for CD using the flocked swab and from 4.9% for KPC to 59.7% for CD when using the foam swab. When VRE was sampled from 26-cm2 and 645-cm2 steel surfaces with foam swabs, 2-log10 decreases in recovery were observed: 43.5% (SD, 4.4%) for the 26-cm2 steel coupons) and 0.4% (SD, 1.6%) for the 645-cm2 steel coupons.
For all organisms sampled from either surface material, as surface area increased from 26 cm2 to 323 cm2, at least a 1-log10 decrease in recovered organisms was detected, and in some cases, a 2-log10 reduction was detected (Fig. 1 and Supplementary Table S1 online).
Discussion
In this study, the %R of the organisms evaluated using flocked and foam swabs decreased significantly with increasing surface area sampled, suggesting that it is best to limit the swab sampling areas to ≤26 cm2. Similar decreases in recovery over larger surface areas have been observed when swabs were used to sample norovirus from steel surfaces.Reference Park, Lee, Trefiletti, Hrsak, Shugart and Vinje4 The organisms are most likely absorbed by the swab when it is still moist, then the swab loses moisture as it continues to move across the larger surface areas. As the swab dries, the organisms are more likely to adhere to the surface than the swab, and the organisms are redistributed back onto the subsequent surface areas. Redistribution of Bacillus atrophaeus spores onto subsequent surfaces was demonstrated by Tufts et alReference Tufts, Meyer, Calfee and Don Lee5 when using a cellulose sponge sampler. The variability in %R between organisms may be attributed to organism-specific properties that can influence adherence to materials, and to persistence, as discussed in Rose et al.Reference Rose, Houston, Martinez-Smith, Lyons, Whitworth, Reddy and Noble-Wang6 In other studies, researchers have noted that various properties can influence cell adherence to surfaces: hydrophobicity, the charge of the cells, extracellular polysaccharide, pili or flagella, and the presence of organic material, which simulates body fluids encountered in the hospital setting.Reference Katsikogianni and Missirlis7,Reference van Merode, van der Mei, Busscher and Krom8 Previous research demonstrated that different sampling devices released organisms into their elution liquids (when processing in the laboratory) to different degrees, suggesting that the physical and chemical properties of the sampling device can influence the %R.Reference West-Deadwyler, Moulton-Meissner, Rose and Noble-Wang9 The differences in physical properties of the sampling tools (e.g., surface area, hydrophobicity) may explain the differences in %R. Additional factors that may affect recovery efficiency include ambient room temperature and humidity.Reference McEldowney and Fletcher10 Further work is needed to address detection by molecular methods, which may prove helpful when detecting viruses and bacteria not typically detected by culture. These data illustrate the need to limit swab sampling areas to 26 cm2 when sampling for bacterial pathogens in healthcare settings.
Supplementary material
To view supplementary material for this article, please visit https://doi.org/10.1017/ice.2022.101
Acknowledgments
Financial support
No financial support was provided relevant to this article.
Conflicts of interest
All authors report no conflicts of interest relevant to this article.