1.0 Introduction
Many engineers probably see riveted joints only as a brief reference or a basic feature in a first-year engineering course. In fact, modern aircraft riveting is an extremely complex subject [Reference Giddings7].
For many years, aluminum alloys (AA), which can be improved by heat treatment, have been widely used in aircraft construction. Rivets are still the most reliable and safe fasteners for the non-detachable connection of AA structural parts. Due to the special quality of the AA metal group, natural material properties, heat treatments and the fact that the connections of aircraft structural parts are complex and highly stressed, rivets in aircraft are always made cold. Due to these conditions, the machines, rivet guns and working methods used to strengthen riveting are different from the riveting methods commonly known in general machine building [Reference Pleines14].
An approximate formula for the rivet loads transmitted to the sheet metal supporting stringers is derived. The effect of the rigidity of the aircraft stringers and frames in reducing the magnitude of shear buckling is considered. Although the rivet loads are not high, the effect of the initial irregularities is significant [Reference Mansfield13]. Damage initiation points around connections such as bolts should be investigated in the preliminary design phase of large composite structures such as composite airframes. In the research conducted by Azeem, a global low-fidelity model was used to create high-fidelity local models around the features of interest. Appropriate customisation of model inputs and outputs using feature engineering and machine learning methods enables damage initiation prediction. The results show that the proposed methodology has a time saving advantage of over three orders of magnitude and satisfactory accuracy [Reference Azeem1].
There has been a long-standing demand for the development of new materials and their processing technologies for the design of lightweight, strong and cost-effective structures, as well as for the load-carrying bodies of aircraft, automotive and high-speed trains. To meet these demands and support industrial applications, the aluminum alloy family is one of the most important lightweight materials that has been extensively developed and improved. The use of heat-treatable AAs, such as the 7000 and 2000 series, poses significant challenges to existing spot-welding joining technologies. Thermal softening problems occur when these AAs are fused to temperatures where precipitation phases are dissolved. Grain coarsening of aluminum alloys is also a critical problem that hinders their application. As an alternative to these problems, rivet joining processes are being developed, especially in aircraft structures [Reference Ma, Yang, Hu, Shan, Geng, Li and Ma12].
After the 1990s, self-piercing riveting (SPR) has come to the fore as one of the joining techniques for aluminum vehicle bodies [Reference Chrysanthou4]. SPR is a cold mechanical joining process used to join two or more sheets of material by pushing a rivet through the upper sheet under the guidance of a suitable die and then locking it into the lower sheet. SPR has made significant progress in joining lightweight materials such as aluminum alloy structures, aluminum-steel structures and other mixed-material structures, and has become the main joining method for the automotive industry [Reference Li, Chrysanthou, Patel and Williams9].
Compared with other traditional joining methods, SPR has many advantages, such as no pre-drilled holes, no smoke, no sparks and low noise, no surface treatment, the ability to join multilayer materials and mixed materials, and the ability to produce joints with high static and fatigue strengths. Studies have been conducted on the mechanical properties, corrosion behaviour and simulation of joint performance of SPR joints [Reference Li, Chrysanthou, Patel and Williams9]
The effect of SPR connections on mechanical properties was investigated using three different AA sheets – 7075, 6061 and 5754. Microhardness, mechanical and fatigue properties were compared in the samples formed with the connections of three AA. The results showed that the connections were good in all three aluminum alloys, but the expansion of the rivet was relatively lower in 7075 alloy. This is because AA 7075 is stronger than the others. Due to the plastic deformation occurring in the riveting region during the SPR process, an increase in microhardness occurred in the riveted areas of the joined sheets. The hardness of the joined sheets was measured as 7075 > 5754 > 6061. In addition, AA 5754 exhibited better performance than AA 6061 at lower fatigue load levels as a result of plastic hardening [Reference Zhang, Lei, Wang, Zhu, Lu and Jiang17].
The effect of riveting position on the structural strength, absorbed energy and instantaneous stiffness of SPR joints of AA5052 sheets in lightweight automotive body panels was analysed using the edge riveting method. Mechanical tests were conducted by considering four edge distances for the experimental study. The results showed that this riveting method changed the failure mode of the joint, with rivet pullout from the bottom sheet and riveted edge sheet fracture coexisting. In the tensile-shear tests, the maximum shear load, absorbed energy and deformation resistance decreased as the distance from the riveting point to the strip edge decreased [Reference Duan and Chen5]. A finite element simulation model was established to evaluate the effect of three die types, namely flat, pip and spherical, on the joint quality and failure modes of AA 5052 SPR joints, and the accuracy of the model was verified by comparing with the experimental results. The results showed that the samples produced with the flat type die exhibited the highest locking value and mechanical properties. However, their forming quality was lower than the pip-type die due to the higher rivet head height. The pip die increased the rivet expansion by providing superior mechanical properties compared to the flat-type die samples. In contrast, the samples produced with the spherical-type die exhibited the lowest forming quality and mechanical performance [Reference Lun, Monier, Zhang, Li, Elkaseer, Abbas and Ye11]. The interaction of sheet thickness, sheet hardness and rivet hardness has the greatest effect on the failure load and maximum riveting force of AL1420, AA5052 and AA5182 Al alloy SPR parameters [Reference Chen, Zeng, Xing and He2].
SPR is a promising method for joining thin-walled structures in the automotive industry, especially for joining dissimilar materials. Due to their excellent strength-to-weight ratio and vibration/noise reduction properties, foam aluminum sandwich composite panels are considered the best choice for modern automobiles. In tensile-shear tests, foam sandwiches reduced maximum failure loads and increased maximum failure displacements of the joints [Reference Huang, Zhang, Lin and Jiang8].
The application of cast aluminum alloy is very important in the development of automotive lightweight technology. The SPR joining process is the basic technology to guarantee crash safety for the body. However, due to the low ductility of cast aluminum, cracks are easily formed in the joining parts. It shows that SPR joinability can be improved with appropriate heat treatment, AlSi10MnMg-T6 and AlSi10MnMg-T7 with larger elongation and lower yield strength. In the riveting process, similar to the overlapping process, tangential tensile stress is generated on the bottom surface, which leads to the formation of cracks on the bottom surface [Reference Lun, Monier, Zhang, Li, Elkaseer, Abbas and Ye11].
Ultra-high strength steels have become a commonplace in automobile bodies. In recent years, due to the increasing safety demands, especially regarding the protection of battery packs in electric vehicles, the thickness of steel parts has been steadily increasing, and the ability of conventional SPRs to penetrate such steel parts has been exceeded. Therefore, the need to combine experimental and numerical methods for improved SPRs for ultra-high strength steel sheets with increasing thickness has become evident. In this study, significant improvement in rivet performance has been achieved by extensively changing the rivet material and applying heat treatment with a slight adjustment in the commonly used rivet geometry [Reference Uhe and Meschut16].
Fretting wear problems are encountered in rivet joints of 6061-T6 aluminum alloy sheets, which are widely used in aircraft construction. In this context, experiments have shown that tensile load cycles in riveted overlap joints cause damage on all surfaces. As the load and cycles increase, fretting marks and surface roughness increase. As a result, it has been determined that fretting damage occurs between the contact surface of the sheets and between the sheet and rivet contact surface [Reference Erturun and Odabas6]. Fretting wear in AA5754, which is joined with SPR, a relatively new connection technique increasingly used in vehicle structures, occurs when the joint is exposed to sinusoidal cyclic loads, creating fretting surface patterns [Reference Chen, Han, Chrysanthou and O’Sullivan3].
In this research, a new technique is proposed for the SPR joining of Al alloys, widely used in the aerospace industry. A split Hopkinson pressure bar test system was used specifically for this study, using suitable molds. The system pressure can be adjusted to the desired value, and this process can be repeated. With this test setup, riveting operations were performed at speeds ranging from 10−2 to 10−4 seconds. Furthermore, creating various numbers of slots in the rivet tail section using wire erosion adds originality to the study, and the results are compared experimentally for processes at different deformation rates. The Phoenix V|tome|x C450, a powerful and compact 450 kV mini-focus computed tomography scanner designed for 3D metrology, was used to image the joint without cutting the SPR joining mechanisms.
In a competitive market, airlines are constantly looking for solutions that can reduce costs [Reference Rostami, Bardin, Neufeld and Chung15]. It has been observed that the microstructure and mechanical properties of SPR aluminum alloys are significantly affected by varying loads and slotted rivet lockhing mechanism. SPRs have been widely used in automotive and aviation with high-strength Al alloy sheets. Therefore, this article provides benefits for the development of SPR in Al alloys widely used in aviation.
2.0 Experimental procedures
In this study, the SPR process was carried out with the split Hopkinson pressure rod test system. In the experimental setup, transmission rods made of maraging steel with a diameter of 20 mm and a length of 400 mm were used (Fig. 1). The pressure obtained from the sudden opening of the compressed helium gas in the storage unit is applied to the moving steel rod. Helium gas was preferred in pressurisations since it is least affected by environmental conditions and has high stability. The pneumatic valve opens in approximately 30 ms and provides acceleration of the moving rod in the cylinder. The angle between the centre axis of the moving rod and the impact surface of the riveting unit is 90° thanks to the mechanical design (Fig. 2). The rod in the cylinder accelerated by pressure performs the riveting process by hitting the surface of the mold developed for SPR (Fig. 2). The system pressure can be adjusted to the desired value, and this process can be repeated. There is a sensor system that measures the speed of the rod moving in the cylinder of the experimental setup. With this test setup, the riveting process was carried out at speeds between 10−2 and 10−4 seconds.
Pulling extension with a diameter of 20 mm and a length of 400 mm.

SPR unit 3D test design.

The rivet is placed in the mold as seen in Fig. 2. The load from the transmission rod is transmitted to the rivet by the impact transmission part, and the rivet is stuck into the AA sheets.
1.5 mm (0.059") thick AA 6061-T6 sheets were used for SPR joints. The chemical content of the AA 6061 sheet is given in Table 1.
Composition of AA 6061

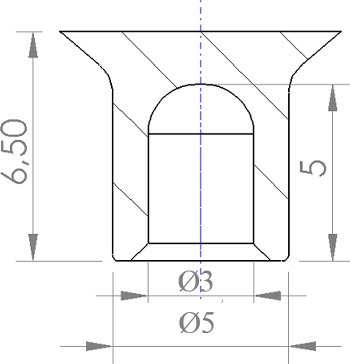
In this study, the Ø5 × 5 mm Rivset SPR manufactured by Böllhoff, which does not require pre-drilling and is easier to position, was used (Fig. 3).
Technical drawing of SPR rivet.

SPR is an ideal rivet for various material combinations, including high-strength steel. It maintains its flexibility even when subjected to changing loads. The semi-tubular rivet pierces the upper layer of the workpiece in a single step and creates an undercut in the lower layer that forms the characteristic locking head. In this way, it provides liquid and gas tightness. SPR can be used for different material types and thicknesses.
In this study, different numbers of slots were opened on the rivet tail section with wire erosion and the process was carried out using SPRs at different deformation speeds. Rivets without slots and with three different numbers of slots are shown in Fig. 4. Firstly, by using slotless, two-slotted, three-slotted and four-slotted rivets, samples suitable for both straight tension and cross tension were obtained at 18 psi pressure. In the numbering of the samples produced at 18 psi, the slotless sample was named as 18-1, the two-slotted sample as 18-2, the three-slotted sample as 18-3 and the four-slotted sample as 18-4. For different pressure values, the slotless samples were named as 18-1 at 18 psi pressure, 24-1 at 24 psi pressure, 26-1 at 26 psi pressure, 28-1 at 28 psi pressure and 30-1 at 30 psi pressure. By comparing the obtained results, it was aimed to determine the effect of the optimum SPR applied pressure and the slot. In addition, the locking dimensions of the rivet in the plate in slotted riveting processes were comparatively examined.
SPRs (a) without slots (b) with two slots (c) with three slots (d) with four slots.

After the riveting process, the SPR rivet was cut from its mid-axis and a cross-sectional image was taken as follows (Fig. 5).
Rivet cross-section.

In order to image the SPR joining mechanisms without cutting, a powerful, compact 450 kV minifocus computed tomography (CT) scanner Phoenix V|tome|x C450 designed for 3D metrology was used (Fig. 6). The voltage was 250 kV and the current was 1500 uA in the imaging process. This tomography device is a Minifocus CT system for the examination of a wide range of applications such as light metal castings, turbine blades, additive manufacturing parts, etc. This technological development provides the image quality obtained with traditional fan beam scanning at speeds up to 100 times higher.
Load directions applied to tensile test samples (a) Tensile-shear tests (b) Cross-tensile test.

Tensile-shear tests were applied to the samples made with rivets with different numbers of slots and different pressures, and cross-tension tests were also applied to the samples prepared with different numbers of slots (Fig. 6). Figures 6a and b show the load directions applied to the tensile-shear tests performed at different numbers of slits and different pressures and to the experimental samples used in cross-tension.
3.0 Results and discussion
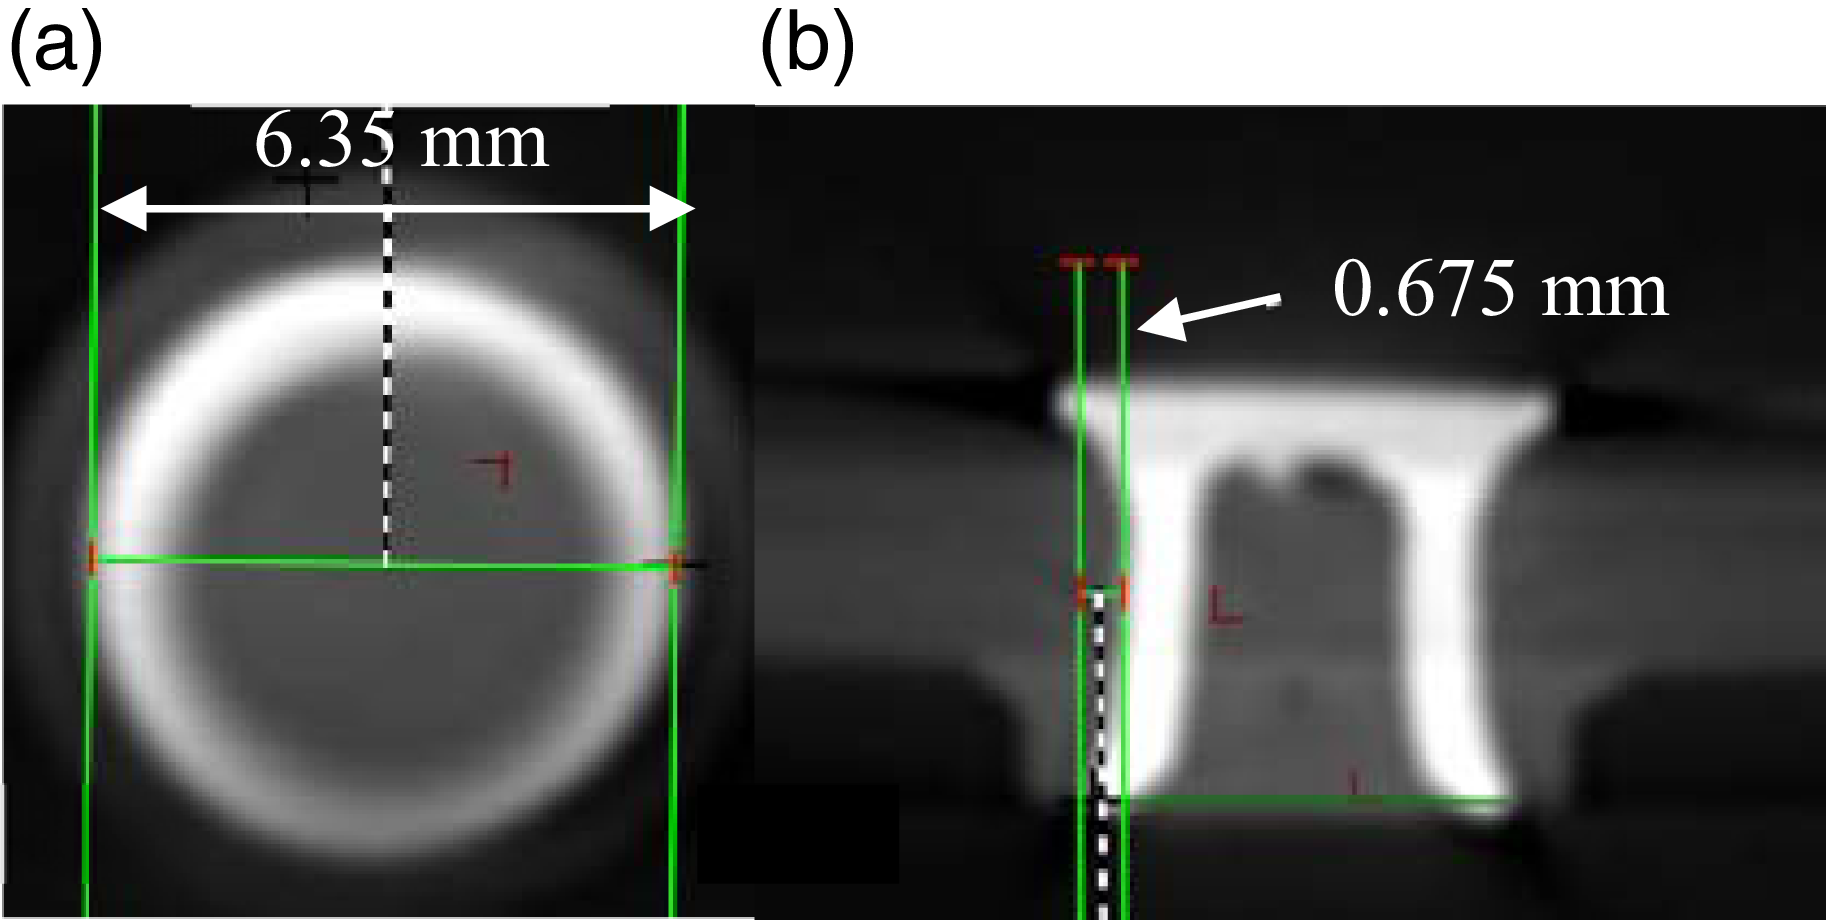
The data obtained from the tomography device is explained below. After the SPR riveting process performed at 18 psi without a slot, the largest diameter of the rivet foot was measured as 6.35 mm (Fig. 7a). In other words, the foot part clamping opening was 0.675 mm (Fig. 7b). There was a 27% increase in the rivet diameter. The clamping opening at the rivet foot was measured as 13.5%.
Tomography image of sample no. 18-1 (a) Top view (b) Side view.

In the image taken after SPR riveting, which was performed with two slits opened on the foot and 18 psi pressure, the largest opening diameter was 8.54 mm (Fig. 8a). The spread of the clamping part was measured as 1.77 (Fig. 8b). The rivet spread diameter increased by 70.8%. The opening in the diameter of the two-slot rivet was approximately 34.5% more compared to the rivet without slots. The opened slots allowed the rivet legs to open more while the rivet was being driven.
Tomography image of sample no. 18-2 (a) Top view (b) Side view.

The largest diameter of the foot of the SPR, which was performed with three slits opened on the foot and riveting at 18 psi, was measured as 8.70 (Fig. 9a). The opening of the clamping part was 1.85 (Fig. 9b). The opening of the clamping part of the three-slot rivet was greater than both the slotless and two-slot rivets. The increase in rivet diameter was 74% compared to the one without slots, while it was 7.5% compared to the one with two slots. The increase in the number of slots causes an increase in the clamping opening.
Tomography image of sample no. 18-3 (a) Top view (b) Side view.

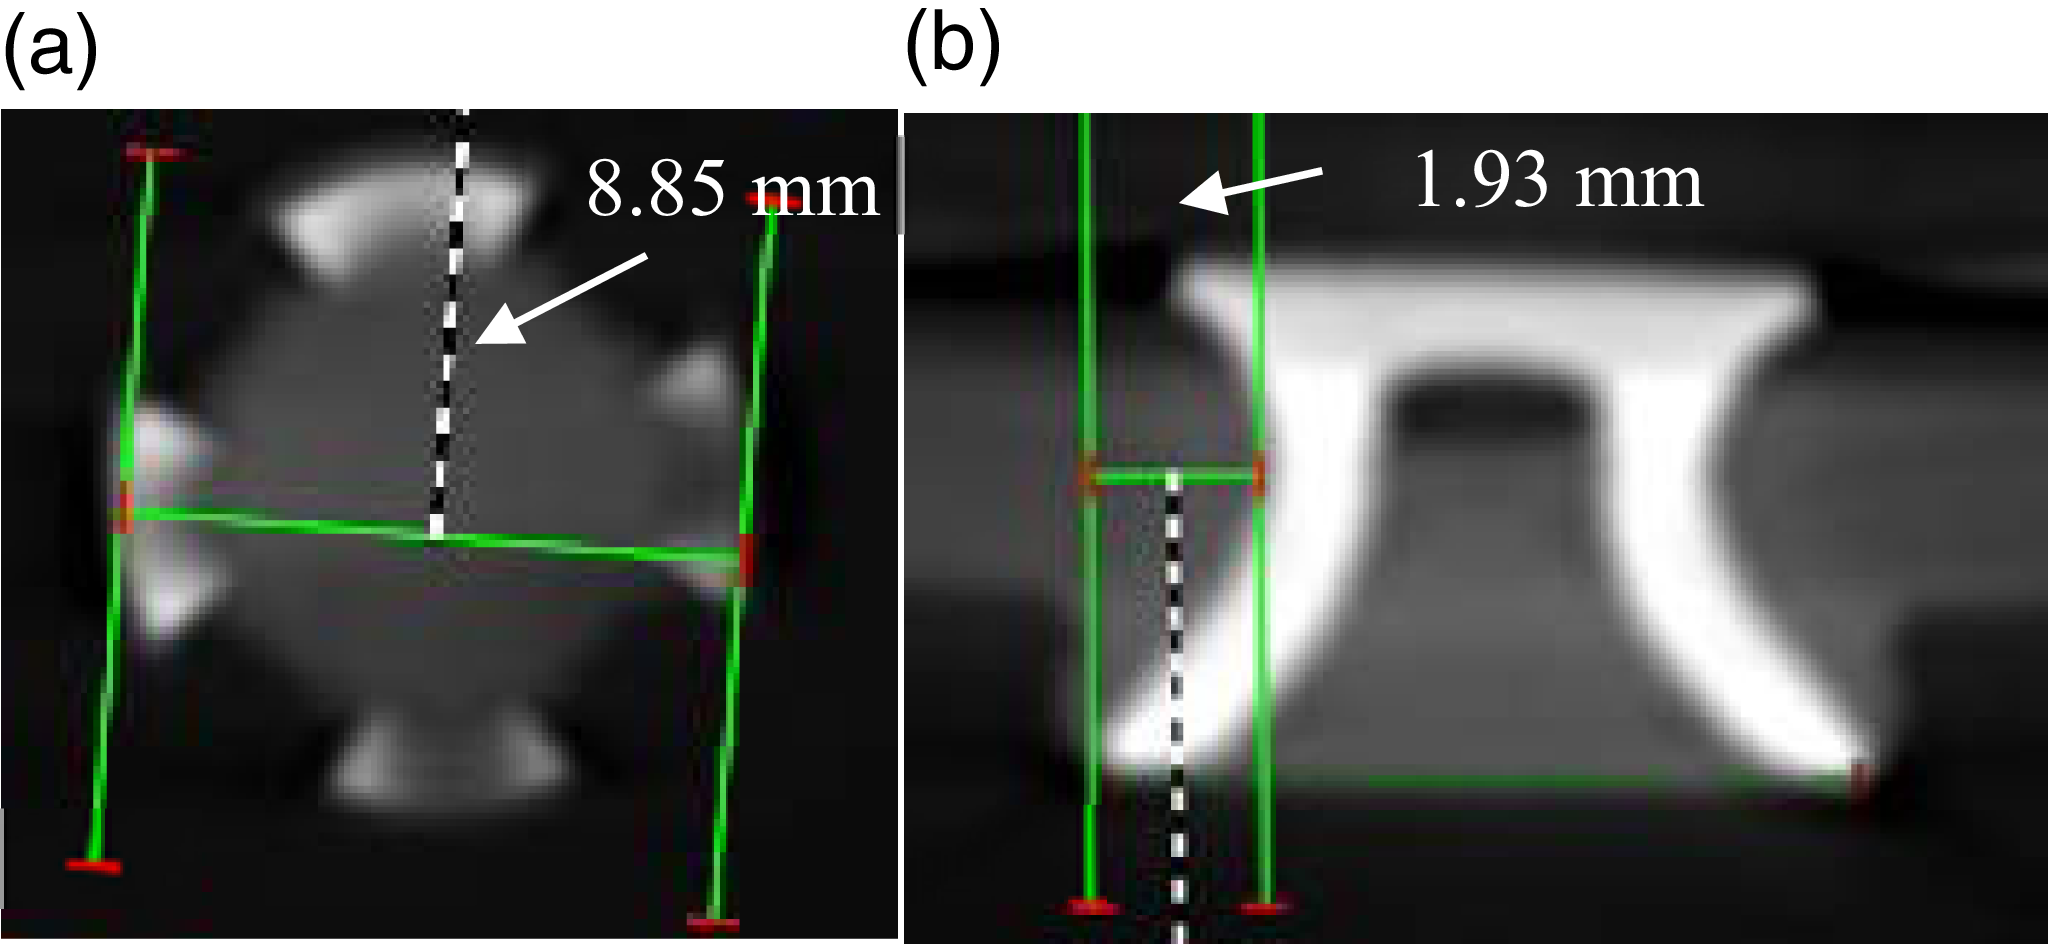
When the number of slits in the foot section was increased to four, the largest opening diameter of the foot section at 18 psi became 8.85 (Fig. 10a). The opening of the clamping section was measured as 1.93 (Fig. 10b). Compared to the one without a slot, the opening radius of the four-slot rivet increased by 77%. The more slits there are, the opening in the clamping section also increases accordingly. The maximum opening occurred in the four-slot rivet.
Tomography image of sample no. 18-4 (a) Top view (b) Side view.

The samples prepared after riveting of the samples without a slot, with two slots, with three slots and with four slots at 18 psi pressure for tensile-shear tests are shown in Fig. 11. Thus, the effects of the number of slits opened in the rivet at the same pressure on the connection could be seen.
Samples no. 18-1, 18-2, 18-3 and 18-4 prepared for tensile-shearing.

For tensile-shear tests, the rivet samples prepared at 24, 26, 28 and 30 psi pressures are given in Fig. 12. The aim here is to examine the effect of pressure difference on the rivet connection.
Samples no. 24-1, 26-1, 28-1 and 30-1 prepared for tensile-shearing.

The sample image of the four-slot rivet made at 18 psi pressure representing the cross-tensile test samples is as seen in Fig. 13. Here, the upper sheet is pulled up while the lower sheet is pulled down. Thus, the rivet’s resistance to cross-tensile stretching is determined.
Image of sample no. 18-4 riveted for cross-tensile (a) Top view (b) Bottom view.

The tensile-shear samples are connected to the tensile device jaws as seen in Fig. 14 and the applied load directions are as in the figure. The forces tend to cut the rivet due to the overlap connections.
Tensile-shearing sample attached to the tensile bench and applied forces.

The force-elongation curves obtained in the tensile-shear tests of the samples obtained by riveting the foot part of the rivet without slots, two-slot, three-slot and four-slot rivets at 18 psi are given in Fig. 15. Figure 15 shows the force-elongation graphs obtained as a result of tensile-shear tests of samples riveted with rivets of different slot numbers. The highest force was in the 18-1 sample without slots, while the lowest force was obtained in 18-3. The change between the highest force obtained in 18-1 and the highest force obtained in 18-3 was approximately 12.6%. The decrease in force in samples 18-2 and 18-4 compared to sample 18-1 was 8% and 11.2%, respectively. The highest force in the slotted samples occurred at a lower value than in the unslotted sample. The decrease in force in the two-slotted sample compared to the unslotted sample was less than the decrease in force in the three- and four-slotted samples. The opened slits caused a decrease in the maximum force of the samples. The elongation of 18-1 was less than 18-2 and 18-4. In general, the maximum force increased while the elongation decreased. There are similar results to the force values obtained in SPRs in the literature [Reference Li, Chrysanthou, Patel and Williams9].
Shear-tensile test force-displacement graphs of samples obtained from different number of slotted rivets at 18 psi pressure.

The results obtained in the tensile-shear tests of the samples obtained by riveting the unslotted rivets at 18, 24, 26, 28 and 30 psi pressures are given in Fig. 16. The highest force was obtained at the highest pressure of 30 psi, while the lowest elongation occurred in this sample. The lowest force occurred in the sample at the lowest pressure of 18 psi. In this system, the increase in pressure generally caused the maximum force to increase. The riveting process at high pressure provided the connection to be more durable. The highest force in sample no. 30-1 increased by 48.8% compared to sample no. 18-1. It is understood from this that the effect of the pressure applied in the SPR riveting process on the strength of the connection is very high. It was understood that the appropriate riveting pressure can change the connection strength by approximately 50%.
Shear-tensile test force- displacement graphs of samples riveted with non-slotted rivets at different pressures.

As a result of the tensile-shear test, a tear occurs in the sheet metal as seen in Fig. 17.
Sample image because of shear-tensile.

The samples obtained by riveting the foot part of the rivet without a slot, two-slot, three-slot and four-slot rivets at 18 psi were connected to the tensile device with a specially designed apparatus for this study and cross-tension operations were performed (Fig. 18). The force values obtained in the cross-tension tests here are generally lower than the results obtained in the tensile-shear tests. The SPR rivet strength is lower in cross-tension, and the tensile loads obtained in cross-tension are approximately half of the tensile-shear loads. Similar results to the force values obtained in the cross-tension tests for SPRs in this study are found in the literature [Reference Lin, Qi, Wan, Min, Chen, Zhang and Zhang10]. The highest force value was obtained in the 18-1 sample without any slots. The least force value was obtained in the 18-4 sample with at least four slots. In general, as the number of slots increased, the force values decreased. The slots cause the rivet legs, which expand in the connection when force is applied in cross-tension, to close more easily. Thus, the connection can be separated from each other at lower force values.
Cross-tensile test force- displacement graphs of samples obtained from different number of slotted rivets at 18 psi pressure.

Cross-tensile process image.

Plate images after cross-tensile (a) Bottom face of the upper plate (b) Top face of the lower plate.

Cross-tensile specimens are attached to the tensile device jaws as seen in Fig. 19 and the applied load directions are vertical. When forces are applied, the sheet metal sheets bend as shown in the figure and then the rivets come out of the clamped part (Fig. 20). The rivet legs are separated from the lower sheet metal and the connection is broken.
4.0 Conclusions
In this study, the results of tensile-shear and cross-tensile tests of aluminum alloy sheets joined with SPR with different numbers of slots and at different pressures were examined experimentally. The results obtained are given below.
The more the number of slits opened on the foot of the rivet, the opening in the clamping section increases accordingly. The highest opening occurred in the four-slot rivet.
In the results of the tensile-shear tests, it was observed that the highest forces in the samples with slits occurred at lower values than in the sample without slits. The slits opened on the rivet feet caused a decrease in the maximum tensile forces of the samples.
In the tensile-shear tests, the increase in pressure generally caused the maximum force to increase. It was understood that the appropriate riveting pressure could change the connection strength by approximately 50%.
In general, as the number of slits increased in cross-tension, the force values decreased. When force is applied in cross-tension, the slits cause the rivet feet, which expand in the connection, to close more easily.
Acknowledgement
The authors would like to thank Erciyes University for their financial support of the present study (Project no: FBAÜ-2024-13462.). There are no people who contributed to the study in the article but whose names are not mentioned in the list of authors.
Author contributions
M. SOYLAK: Conceptualisation, methodology, validation, formal analysis, investigation, resources, data curation, project administration.
M: AYDIN: Conceptualisation, methodology, validation, formal analysis, investigation, resources, data curation.
V. ERTURUN: Conceptualisation, writing – review & editing, supervision.
Funding
This research work is supported by Erciyes University with Project No: FBAÜ-2024-13462.
Competing interests
The authors declare that they have no known competing financial interests or personal relationships that could have appeared to influence the work reported in this paper.
Data and code availability
Data will be made available on request.
Ethical approval
Not Applicable.