I. INTRODUCTION
Recently, ferroelectric materials, particularly those in thin-film form, have attracted the attention of many researchers. Their large dielectric constants make them suitable as dielectric layers in microcapacitors in microelectronics. They are also investigated for application in nonvolatile memory using the switchable dielectric polarization of ferroelectric material. To characterize such ferroelectric materials, a high-resolution method is required for observing the microscopic distribution of the remanent (or spontaneous) polarization of ferroelectric materials.
In recent years, we have developed and reported on the use of scanning nonlinear dielectric microscopy (SNDM) for the measurement of the microscopic distribution of dielectric properties on dielectric material surfaces.Reference Cho, Kirihara and Saeki1–Reference Morita and Cho6
Another frequently reported high-resolution method used for observing ferroelectric domains is piezoelectric response imaging using scanning force microscopy.Reference Gruverman, Auciello, Ramesh and Tokumoto7, Reference Eng, Güntherodt, Schneider, Köpke and Saldaña8 Compared with this, SNDM is the first successful purely electrical method for observing ferroelectric polarization distribution without the influence of the screening effect from free charges.
Because this microscopic technique has quite a high sensitivity to variation in capacitance, on the order of 10−22 F, we have also succeeded in visualizing the electron and hole distributions stored in semiconductor flash memory devices using SNDM.Reference Honda and Cho9–Reference Honda, Hashimoto and Cho12 Therefore, this technique is expected to be useful for developing new semiconductor devices.
In addition to above-mentioned SNDM techniques, which detects the polarization components perpendicular to the specimen surface only, a new three-dimensional (3D) type of SNDM (3D-SNDM) for measuring the 3D distribution of ferroelectric polarization has been developed.Reference Odagawa and Cho13–Reference Sugihara and Cho15 Using this 3D-SNDM, it is possible to measure the polarization components both perpendicular (vertical) and parallel (lateral) to the specimen surface by selecting the direction of the applied electric field.
A new technique, noncontact scanning nonlinear dielectric microscopy (NC-SNDM),Reference Ohara and Cho16 has been developed to increase the resolution of SNDM. This technique utilizes the signal from higher-order nonlinear dielectric constant ε(4) to control the noncontact state (tip–sample gap control) and simultaneously detect the lowest-order nonlinear dielectric constant ε(3). Thus, NC-SNDM can be used to observe the topography and dielectric properties of materials.
To date, the highest confirmed resolution of SNDM in contact mode operation has been on the subnanometer order of a ferroelectric domain measurement. However, the characterization of the single dipole moment level of a material is expected.
Most recently, we have developed a NC-SNDM system operating in ultrahigh vacuum (UHV) to prove that NC-SNDM has real atomic resolution. Using this microscopic technique, we have succeeded in observing the Si(111)7 × 7 atomic structure.Reference Hirose, Ohara and Cho17, Reference Cho and Hirose18 We also succeeded to resolve fullerene (C60) molecule.Reference Kobayashi and Cho19 Since the technique is applicable not only to semiconductors but also to both polar and non-polar dielectric materials, SrTiO3 and TiO2 surfaces were observed by NC-SNDM. This is the first successful demonstration of the achievement of atomic resolution in a dielectric microscopic technique.
Moreover, we also have proposed a next generation ultrahigh-density ferroelectric data storage system based on SNDM and have already reported that information comprising data bit array of 64 × 64 were successfully stored at an areal density of 4 Tbits/inch2.Reference Tanaka and Cho20 These results confirm the potential of ferroelectric materials for storing information at high densities.
In this article, we review and summarize SNDM and its related technologies.
II. PRINCIPLE AND THEORY FOR SNDM AND MICROSCOPIC OBSERVATION OF THE AREA DISTRIBUTION OF FERROELECTRIC DOMAINS USING SNDM
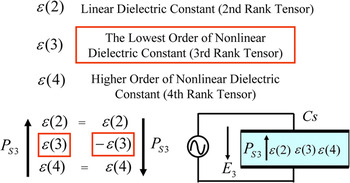
As shown in Fig. 1, we consider the situation where there is a capacitor made of the material to be measured with nonlinearity in D–E relationship and an alternating electric field E 3 along the z-direction (3-direction) is applied to this capacitor. Equation (1) is a polynomial expansion of the electric displacement D 3 as a function of the electric field E 3.

Principle of polarization detection by scanning nonlinear dielectric microscopy (SNDM).

where P s3 is a spontaneous polarization along the same direction and ε(2), ε(3), and ε(4) are linear, lowest-order nonlinear, and one-order-higher dielectric constants, respectively (The number in the bracket denotes the rank of tensor.).
The even rank tensors, including the linear dielectric constant ε(2), are insensitive to the state of spontaneous polarization. On the other hand, the lowest-order nonlinear dielectric constant ε(3) and other higher-order odd-rank tensor nonlinear dielectric constant are very sensitive to spontaneous polarization. For example, there is no ε(3) in a material with a center of symmetry and the sign of ε(3) changes with the inversion of spontaneous polarization. Therefore, by detecting this ε(3) microscopically, we can measure the distribution of ferroelectric domains.
The capacitance C s varies alternately owing to the nonlinear dielectric properties of the specimen caused by the application of alternating electric field E 3 = E pcosω pt. The ratio of the derivative capacitance variation ΔC s to the static value to the capacitance C s0 is given by the following Eq. (2).

This equation shows that the alternating capacitance of different frequencies corresponds to each order of the nonlinear dielectric constant. Signals corresponding to ε(3) and ε(4) are obtained by detecting the components with a frequency equal to ω p and 2ω p of the applied electric field, respectively.
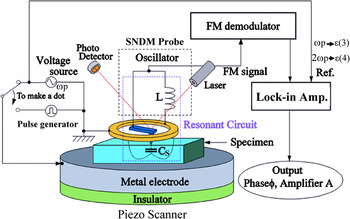
In the microscopy technique, we have to measure the capacitance variation in the very small portion so that we have developed a special probe for SNDM. Figure 2 shows the system setup of SNDM using an LC lumped constant resonator probe. In the figure, C s denotes the capacitance of the specimen under the center conductor (the tip) of the probe. C s is a function of time because of the nonlinear dielectric response under the applied alternating electric field E p3 (=E pcosω pt, f p= 5 kHz–1 MHz).
Schematic diagram of SNDM system.

This LC resonator is inserted into the positive feedback circuit of a free-running (self-excited) oscillator tuned to the resonance frequency of this resonator. Thus, this oscillator oscillates at the resonance frequency of the LC resonator. The above-mentioned electrical parts [i.e., tip (needle or cantilever), ring, inductance, and oscillator] are assembled into a small probe for the SNDM. The oscillating frequency of the probe (or oscillator) (approximately 1–6 GHz) is modulated by the change in capacitance ΔC s(t) due to the nonlinear dielectric response under the applied electric field. As a result, the probe (oscillator) produces a frequency-modulated (FM) signal. By detecting this FM signal using the FM demodulator and lock-in amplifier, we obtain a voltage signal proportional to the capacitance variation. Thus, we can detect the nonlinear dielectric constant just under the tip and obtain fine resolution determined by the diameter of the pointed end of the tip and the linear dielectric constant of specimens. The capacitance variation caused by the nonlinear dielectric response is quite small. Therefore, the sensitivity of the SNDM probe must be very high. The measured sensitivity of the above-mentioned lumped constant resonator probe is in the range of 10−22 F, which is much higher than that of scanning capacitance microscopy (SCM) whose typical sensitivity is 10−18 F.Reference Nakagawa and Morita21
Originally, SNDM system was developed for the purpose of measuring ferroelectric polarization and local anisotropy of dielectrics through the detection of a third-rank nonlinear dielectric constant.
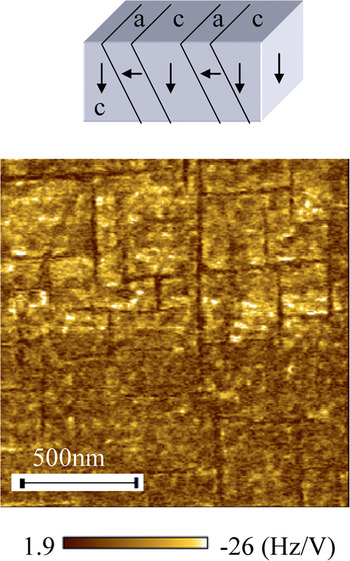
We performed measurement of a lead zirconate titanate (PZT) film sample using SNDM. The result is shown in Fig. 3. From this image, we can confirm that SNDM can resolve in great detail of a domain structure of PZT. The tip used in this measurement was a metal-coated conductive cantilever with a tip radius of 25 nm. This image is of an epitaxial PZT thin film (400 nm)/La-Sr-Co-O/SrTiO3 substrate.Reference Ganpule, Nagarajan, Li, Ogale, Steinhauer, Aggarwal, Williams, Ramesh and De Wolf22 The strip shaped 90° a–c domain pattern is clearly seen in the figure.
SNDM image of an epitaxial lead zirconate titanate thin film on La-Sr-Co-O/SrTiO3.

III. SNDM FOR 3D OBSERVATION OF NANOSCALE FERROELECTRIC DOMAINS (3D-SNDM)
The other advantage of SNDM in investigation of ferroelectric materials is that it is possible to measure the polarization components both perpendicular (vertical) and parallel (lateral) to the specimen surface by selecting the direction of the applied electric field.Reference Odagawa and Cho13–Reference Sugihara and Cho15 The 3D measurement of ferroelectric polarization is quite important because many ferroelectric materials have 3D domain structures.
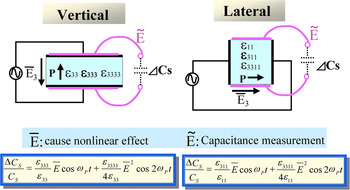
In ferroelectric materials, the sign of the lowest-order component of the nonlinear dielectric constant (third-rank tensor) changes with an inversion of the polarization direction. Hence, by measuring the sign of the nonlinear dielectric constant, we can obtain the polarization direction. As explained the principle in Fig. 4, in vertical measurement, we apply alternating electric field along the polarization direction and measure the capacitance variation along the same direction, thus SNDM detects the component of polarization perpendicular to the specimen surface [ε(3) component]. On the other hand, in lateral measurement, we apply alternating electric field along the polarization direction too; however, we measure the capacitance variation perpendicular to the polarization direction so that it can detect the parallel component polarization (ε 311 component).
SNDM principle in vertical and lateral measurements.

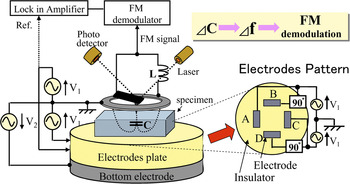
Figure 5 shows a schematic diagram of an SNDM system designed to measure in both the vertical and lateral polarization directions. In vertical measurement, the bottom electrode is used to apply an alternating electric field in the vertical direction. In lateral measurement, an alternating electric field is generated by applying an alternating voltage to four electrodes denoted as A, B, C, and D on the electrode plate. By producing a 90° phase shift between the applied voltages, V A−B (=2V 1cosθ) and VC−D (=2V 1sinθ), a rotating electric field is generated parallel to the specimen surface. By using the rotating electric field, the phase output of the lock-in amplifier directly indicates the lateral azimuth angle of polarization.
Schematic diagram of three-dimensional type of SNDM system.

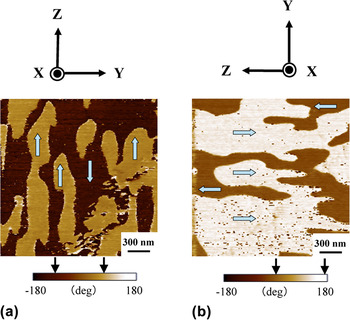
In this experiment, lateral measurement was carried out in the x-cut plane of a multidomain congruent LiTaO3 single crystal with a thickness of 200 μm, which has a lateral polarization component only.
Figure 6(a) shows a phase image obtained for lateral measurement in the x-plane of the LiTaO3 crystal. Antiparallel polarization orientations are clearly distinguished in this image. This image further reveals that the c–c domains do not penetrate along the Z-axis contrary to the usual expectation, i.e., ferroelectric polarization is expected to penetrate through the crystal along the polarization direction. In other words, the multidomain structure of the congruent LiTaO3 crystal generated by the depolarization process was found to be composed of numerous charged domains. Figure 6(b) also shows a phase image in the x-plane of the LiTaO3 crystal, in which the specimen has been physically rotated by 90°. In these images, where the azimuthal polarization angles are indicated by arrows on the color scale, it can be seen that the phase signals shift by around 90° in accordance with the rotation of the specimen.
(a) Phase image in x-cut plane of multidomain LiTaO3 substrate by lateral measurement; (b) phase image by lateral measurement after physical rotation of specimen by 90°.

IV. NONCONTACT SCANNING NONLINEAR DIELECTRIC MICROSCOPY
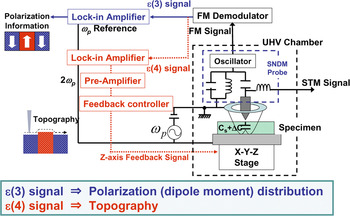
Recently, we have developed NC-SNDM operating under UHV conditions.Reference Ohara and Cho16 As shown in Fig. 7, NC-SNDM utilizes the signal from higher-order nonlinear dielectric constant ε(4) to control the noncontact state (tip–sample gap control) and simultaneously detect the lowest-order nonlinear dielectric constant ε(3). Thus, NC-SNDM can be used to observe the topography and dielectric properties of materials.
Brock diagram of noncontact scanning nonlinear dielectric microscopy (NC-SNDM) operated under the ultrahigh vacuum condition.

Equation (2), using the dielectric constant, is a somewhat macroscopic description. However, even if a very localized situation is considered, for example, atomic resolution in mind, because the localized dipole moment also causes capacitance variation, Eq. (2) is still applicable by replacing the macroscopic dielectric constant ε with the local polarizability factor ε local of a single dipole moment as a matter of form.
In the actual measurements, the ambient condition should be UHV because adsorbed water, which has a relatively high-dielectric constant of the order of 80, on the specimen surface causes the electric field under the tip to broaden under such an atmosphere condition.Reference Ohara and Cho23 Therefore, an UHV-type SNDM was developed. In this study, the specimen and probe were in a vacuum chamber in which the degree of vacuum was below 1.0 × 10⁻¹⁰ Torr.
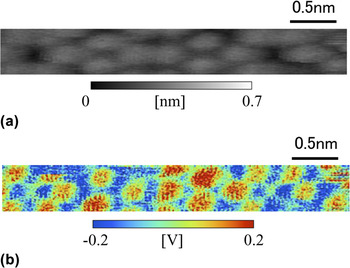
To confirm the atomic resolution, a well-established standard sample is required. Therefore, Si(111) was chosen as a representative specimen. In this experiment, an alternating voltage of 3 Vp-p at 30 kHz was applied. Figure 8 shows a simultaneously measured topographical image {image of the height control signal applied to the Z-axis piezoscanner to maintain a constant ε local (4) signal [Fig. 8(a)]} and the image of the ε local (3) signal distribution [Fig. 8(b)]. In the topography, the Si(111)7 × 7 atomic structure is clearly recognized; therefore, it is confirmed that the atomic resolution was achieved by NC-SNDM. Moreover, it is also confirmed that the distribution of the ε local (3) signal was obtained simultaneously. Because the ε local (3) image has a contrast that corresponds to individual Si adatoms, this image includes information on the dipole moment of single Si adatoms. This is the first successful demonstration of the achievement of atomic resolution in a dielectric microscopic technique.
(a) Topography of Si(111)7 × 7 atomic structure observed by NC-SNDM [ε local(4) feedback]; (b) simultaneously measured dipole moment image by ε local(3) (−0.5 V bias application).

This technique, which is used to detect dielectric properties and topography, is applicable not only to semiconductors but also to both polar and non-polar dielectric materials. Thus, it is expected that NC-SNDM will contribute to the study of electric dipole moment distribution in insulating materials on the atomic level.
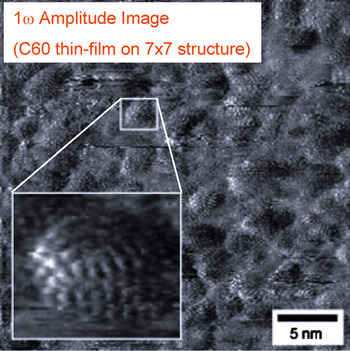
We also succeeded to resolve fullerene (C60) molecule deposited on Si(111)7 × 7 surface by NC-SNDM. In this measurement, at first, we fabricated a C60 thin film with a thickness of one monolayer on Si(111)7 × 7 surface. The measured result is shown in Fig. 9. This image is an ε(3) (1ω p) amplitude image with the inset of the expanded image in which the fine internal structure of C60 molecule is clearly resolved.
Internal structure of C60 molecule observed by NC-SNDM [ε(3) amplitude image].

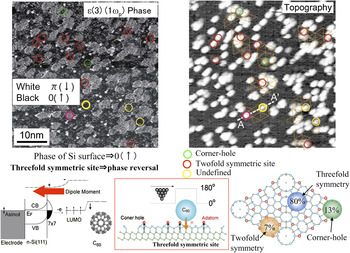
Next the Si(111)7 × 7 surface covered with 0.37 ML of C60 molecules by NC-SNDM is shown in Fig. 10. To obtain the topological image by the NC-SNDM, the ε(4) signal was utilized for the feedback parameter to maintain the gap between the tip of the probe and specimen. The Si(111)7 × 7 surface could be clearly recognized under the C60 molecules. The origin of the SNDM signal for the Si(111)7 × 7 surface has been previously reported.Reference Cho and Hirose18
ε(3) (1ω p) phase image (upper left) and topography (upper right) by NC-SNDM. Dipole moment induced from C60 molecule to threefold symmetric site (lower left and lower middle). Absorption probabilities of C60 molecule on Si(111)7 × 7 surface (lower right).

Adsorption site of C60 molecules on Si(111)7 × 7 surface was well established by STM.Reference Wang, Hashizume, Shinohara, Saito, Nishina and Sakurai24, Reference Hou, Jinlong, Haiqian, Qunxiang, Chanhhan, Hai, Wang, Chen and Qingshi25 For small surface coverage, C60 molecules prefer threefold symmetric sites due to the highly symmetric characteristic of C60 molecular structure.
Simultaneous phase image of ε(3) (upper left of Fig. 10) and the topography by ε(4) (upper right of Fig. 10) are shown. The tendency of phase reversal can be recognized on almost all the C60 molecules, even though phase reversal does not occur on the Si(111)7 × 7 surface.Reference Hirose, Ohara and Cho17, Reference Cho and Hirose18 The site on the Si(111)7 × 7 surface at which phase reversal occurs was investigated to understand the relationship between the position of the C60 molecule and phase reversal. The circles drawn in Fig. 10 correspond to C60 molecules where phase reversal did not occur, judging from the unit cell for the Si(111)7 × 7 surface corresponding to the orange dotted triangles drawn in Fig. 10 (upper right). The green circles correspond to C60 molecules on the corner holes, whereas the red circles correspond to C60 molecules on twofold symmetric sites. The yellow circles correspond to C60 molecules whose position cannot be defined due to poor resolution. Surprisingly, no phase reversal for C60 molecules on twofold symmetric sites and corner holes can be recognized, and phase reversal only occurred for C60 molecules on threefold symmetric sites. This is because the electric dipole moment originating from charge transfer from a Si adatom was only induced on threefold symmetric sites.Reference Kobayashi and Cho19
Therefore, an electric dipole moment cannot be induced on twofold symmetric sites and corner holes because charge transfer does not occur for C60 molecules at these locations.
The ratio of the number of C60 molecules on threefold symmetric sites with phase reversal and the total number of C60 molecules on twofold symmetric sites and corner holes with no phase reversal is similar to that of the number of C60 molecules on the three sites on an Si(111)7 × 7 surface as estimated by STM (as shown in Fig. 10 lower right).Reference Wang, Hashizume, Shinohara, Saito, Nishina and Sakurai24 Therefore, no phase reversal occurs on the twofold symmetric site and corner hole. Thus, it is considered that the phase of ε(3) signal in NC-SNDM reflects whether an electric dipole moment is induced at the interface between the C60 molecule and an individual site.
This means that NC-SNDM can only detect the electric dipole moment induced at the interface between C60 molecule and threefold symmetric site.
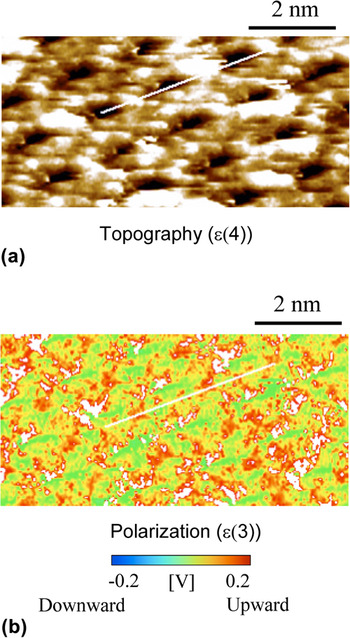
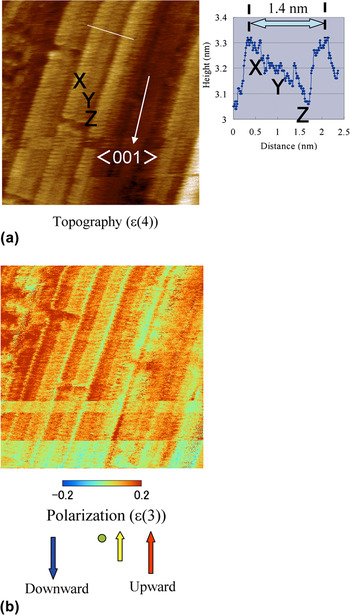
Since the technique is applicable not only to semiconductors but also to both polar and non-polar dielectric materials, SrTiO3 and TiO2 surfaces were observed by NC-SNDM. Figures 11(a) and 11(b) show the topography and polarization on Nb-doped SrTiO3(100) surface, respectively. This sample was annealed at 1150 °C for 10 min in UHV condition. In the topography, periodic atomic structure was clearly observed. In the polarization [ε(3)] image, upward polarization was observed. From this result, the surface of this sample is terminated with TiO2 layer. Next, we also have measured widegap semiconductor TiO2(100) surface as shown in Fig. 12. This sample was fabricated by heat treatment at 1000 °C for 5 min in UHV condition, too. From the topography [Fig. 12(a)], it is confirmed that one surface structure contains three layers denoted using the symbols XYZ. We think that the microfaceted topography of (110) surface was measured.Reference Hardman, Parkash, Muryn, Raikar, Thomas, Prime, Thornton and Blake26 As shown in the polarization image of Fig. 12(b), upward polarization was detected. We think the signal originates from a Ti cation.
Topography (a) [ε(4) feedback] and dipole moment (b) [ε(3) image] on Nb-doped SrTiO3(100) surface by NC-SNDM.

Topography (a) [ε(4) feedback] and dipole moment (b) [ε(3) image] on widegap semiconductor TiO2(100) surface by NC-SNDM.

V. NEXT GENERATION ULTRAHIGH-DENSITY FERROELECTRIC DATA STORAGE BASED ON SNDM
With the advances in information processing technology, the importance of high-density data storage is increasing. Studies on thermal fluctuation predict that magnetic storage, which plays a major role in this field, will reach a theoretical limit in the near future; thus, a novel high-density storage method is required.
Ferroelectrics can hold bit information in the form of the polarization direction of individual domains. Moreover, the domain wall of typical ferroelectric materials is as thin as the order of a few lattices, which is favorable for high-density data storage. Therefore, we have been studying ferroelectric high-density data storage based on SNDM.
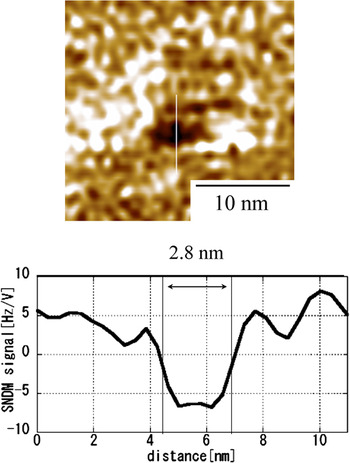
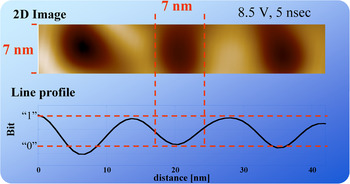
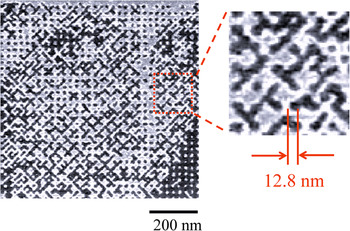
In this section, we describe the fundamental studies of artificially formed ferroelectric nanodomains to obtain the information needed for memory applications. First, we investigated how small nanodomain dots were actually formed. As shown in Fig. 13, at this stage, the smallest artificial nanodomain single dot formed was 2.8 nm in diameter.Reference Tanaka, Kurihashi, Uda, Daimon, Odagawa, Hirose, Hiranaga and Cho27 This single dot was formed by the application of an 8.0 V, 10 ns pulse with a direct current offset of 0.5 V on a congruent lithium tantalate (CLT) thin plate with a thickness of 30 nm. If we can form many bits and maintain this domain dot size, the corresponding memory density will reach 82 Tbit/inch2. However, unfortunately, this goal is somewhat difficult to achieve. When we form bit in the vicinity of another bit, the two bits merge with each other. Therefore, it is very important to evaluate how close domain dots can be formed to each other. We formed a nanodomain dot array composed of bits “1” and “0” varying the bit size and spacing. We then obtained an artificial nanodomain dot array with a bit size of 7 nm as shown in Fig. 14.Reference Tanaka, Kurihashi, Uda, Daimon, Odagawa, Hirose, Hiranaga and Cho27 Because the 7-nm ϕ dots in the array are sufficiently resolvable for practical data storage, it is expected that, with further refinements, the system will be applicable as a storage technology. However, it also should be noted that with the current quality of ferroelectric recording media and the level of technology,these very small domain dots can be formed only in a very small area on the medium. As mentioned above, although we have reported that ferroelectric data storage at a density of above 1 Tbit/inch2 is possible in principle, this does not necessarily mean that actual information storage, requiring an abundance of bits to be packed together at high density, is easy to achieve. To facilitate actual storage, a large medium of sufficient surface quality and homogeneity is needed. Therefore, demonstration of actual data storage at above 1 Tbit/inch2 using ferroelectric materials is important to show whether the technology is really achievable. Figure 15 shows an SNDM image of a 64 × 64 data bit array written on a 30-nm-thick CLT recording medium. The data bits of “1” and “0” were recorded as +z and −z domains, respectively. The bit spacing was 12.8 nm, which is equivalent to an areal data storage density of 4 Tbit/inch2.Reference Tanaka and Cho20 Thus, real information storage at above 1 Tbit/inch2 was definitely demonstrated with ferroelectric medium.
Smallest artificial nanodomain single dot formed was 2.8 nm in diameter.

Artificial nanodomain dot array with a bit spacing of 7 nm formed by 8.5 V, 5 nsec pulses applied with a direct current offset of 0.5 V.

Actual information recorded at a bit spacing of 12.8 nm (areal recording density: 4 Tbit/inch2). 64 × 64 bit data written on a congruent lithium tantalate (CLT) single crystal formed on a 30-nm-thick CLT plate.

VI. CONCLUSIONS
In this article, SNDM with super high resolution was described.
At first, principle and theory for SNDM and microscopic observation of area distribution of ferroelectric domain using SNDM were shown. Then, a new 3D-type of SNDM for measuring the 3D distribution of ferroelectric polarization was developed. Next, NC-SNDM was proposed. Using NC-SNDM, the first achievement of atomic resolution in capacitance measurement was successfully demonstrated. Finally, a very high-density ferroelectric data storage based on SNDM was proposed. Actual visual information data storage at 4 Tbit/inch2 was successfully demonstrated.
Therefore, we have concluded that the SNDM is very useful for observing ferroelectric nanodomains and the local dipole moment of materials with atomic resolution and has a quite high potential as a nanodomain engineering tool.