I. Introduction
For a typical consumer wanting to buy wine, the number of choices is overwhelming. There are many varieties of wine produced in countries around the world, across regions within a country, over time. Even within a particular varietal-region-vintage category, numerous producers market product differentiated wines.
To aid the consumer, wines are often reviewed by professionals. Typically, numerical scores are assigned ranging between zero and one hundred. These reviews are published in magazines and online web sites. Retailers also commonly provide the numerical ratings on the store shelves. An extensive literature has investigated whether the numerical ratings correlate with the price through, presumably, demand. The typical finding is that it does, but the correlation is not very strong. This suggests that there is more to a typical consumer's demand than vertical product differentiation characteristics. Also, though, consumers are frequently given written descriptions in these reviews. These notes are provided by experts. Magazines and online sites publish these descriptions alongside the numerical score and other objective characteristics. Wine retailers not uncommonly provide the short text descriptions on the shelves next to the bottles.Footnote 1 I ask whether the text provides any additional information about the utility the consumer will receive from the wine above and beyond the quality score and the objective, observable characteristics (i.e., vintage, producer, variety, region).
Wine is just one example of an experience good where consumers’ information is limited. Often in such markets, third parties act to provide information. Text descriptions are a common way to do this. Thus, by evaluating wine descriptions, my work contributes to the broader question of the value of text in experience good markets.
There is reason to believe that the text is unrelated to a wine's price. For one, the descriptions may simply provide useful, complementary information such as food pairings or whether the wine needs cellaring. There is no reason to believe this necessarily correlates with price. The words used can reiterate information as well. To a typical consumer, a description saying a wine has a buttery or another has a cherry flavor may be no different than simply telling her that the first one is a Chardonnay, and the second one is a Pinot Noir. The text can be only giving typical characteristics of the wine's variety, which is already provided on the bottle.
Additionally, the descriptions can be viewed as cheap talk. Retailers and wine producers may simply select the descriptions that make the wine sound good. There is not necessarily a credible authority to the descriptions, and the text is unregulated. Most any wine can be thought of as wonderful, impressive, or interesting (Especially if one is willing to stretch the truth!). In other words, there is not necessarily a cost to choosing which words to use in the description, so that Spence-type signaling cannot arise. If the text is treated as babble by consumers, then one would not expect a relationship between price and the description.
I explore the alternative hypothesis—that there is useful information in a wine's textual description that consumers benefit from. The demand shift that is associated with an informative wine description is then reflected in its price. Descriptions that convey greater utility for the consumers lead to higher prices. Descriptions that clarify undesirable properties see price reductions. If the quality rating is a measure of vertical product differentiation (i.e., product quality), then the textual description can be thought of as providing information on the horizontal product differentiation. The empirical frustration is how to numerically analyze words in a rigorous, systematic way.
Early research attempting to do this basically created lists of indicator variables. The text is hand read and coded, sometimes by multiple independent research assistants. These indicator variables are then used in a hedonic price equation. For one example, Lecocq and Visser (Reference Lecocq and Visser2006) use simple indicator variables such as “excessiveness of acidity” (Yes or no?), “supple?” (Yes or no?), and “flat” (Yes or no?), to name just three of their variables. Advances in text analysis now allow researchers to systematically evaluate data sets of text. Using a free online wine review site, I use text analysis to categorize wine descriptions.
Specifically, I employ a topic modeling method known as Latent Dirichlet Allocation (hereafter LDA). Details of LDA are provided in Section III. In short, though, LDA is an untrained, unsupervised algorithm. The set of documents is organized into T topics. Similar texts are grouped together to make up these topics. Each document, then, can be scored on the probability it falls into each of these topics. Using this approach, I can classify wine descriptions into topics and ask if there is a particular type of description and an important set of words used in these descriptions that correlate with price.
Using descriptions of wines produced within the United States, I show that there is an important relationship. I first consider wines produced in New York state. I find that the description correlates with the price charged, even when controlling for the numerical rating. This relationship disappears when observable traits of the wine are added as control variables. Exploring this effect, it turns out that the wine descriptions simply correlate with the wine's variety, basically distinguishing the Rieslings of the Finger Lakes region with the reds (e.g., Merlot) of the Long Island region.
Therefore, in a second data, set I evaluate, within a particular variety, whether the text provides additional information explaining price. To do this, I consider data from reviews of Pinot Noir from Oregon. Here, again, the text is correlated with the price and is robust to the inclusion of vintage, producer, and critic. The description's statistical significance diminishes, though, when the numerical rating is included as an explanatory variable. Thus, the numerical rating captures most of the information provided by the text.
At this point, it is not yet clear whether wine descriptions are useful. To further drill down in search of a potential relationship, I choose not only one varietal from one particular state, but also restrict to one particular quality rating. I consider a data set of 90-rated, California Cabernet Sauvignon. California is the dominant wine producing state in the United States, and Cabernet Sauvignon is its flagship varietal (or at least one of its leaders). Within this category, the median and mode numerical rating is 90. Considering only this subsample, I show that the text description again correlates with the wine's price. This time, though, it cannot be explained away by the other observable characteristics such as vintage, region, or critic. Thus, once the primary determinants of a wine's price are properly controlled for (i.e., region, varietal, and rating), the results are consistent with the hypothesis that the text descriptions do provide valuable information to the consumer affecting their demand and, ultimately, the price charged.
While the empirical investigation focuses on wine, the study of experience goods more broadly is problematic. We know little about how consumers acquire information in these settings. As stated, third-parties typically offer information. Other prominent examples include movies, restaurants, cigars, and music. In each, reviewers provide descriptions. Researchers have used the timing of reviews, such as when the Siskel and Ebert reviews are given (Reinstein and Snyder, Reference Reinstein and Snyder2005), to explore whether there is a demand effect. Unexpected opening weekend movie sales are used to identify social learning (Moretti, Reference Moretti2011). “Cold” releases of movies, unreviewed by critics, has been used to assess consumers’ limited strategic thinking (Brown, Camerer, and Lovallo, Reference Brown, Camerer and Lovallo2012). Of course, numerical ratings or other quantifications, such as the number of “stars,” has a rich history of being studied in numerous experience markets (Jin and Leslie, Reference Jin and Leslie2003; McCannon, Reference McCannon2012). I provide the first rigorous analysis of textual descriptions and its influence on the prices of experience goods.
II. Literature Review
Numerous authors have explored the relationship between wine's price and its quality measured by numerical ratings provided by expert tasters (Oczkowski, Reference Oczkowski1994). For example, Goldstein et al. (Reference Goldstein, Almenberg, Dreber, Emerson, Herschkowitsch and Katz2008) considers data from blind tastings and cannot find a relationship between the price and the ratings that had been given. For those with wine training, though, a positive relationship exists. Dubois and Nauges (Reference Dubois and Nauges2010) employ a structural approach to identifying experts’ grades’ relationship with price. In a field study experiment, Hilger, Rafert, and Villas-Boas (Reference Hilger, Rafert and Villas-Boas2011) document a relationship between expert opinion and demand. Demand increases for high-scoring wine and falls for low-scoring ones. Consumers are poorly informed (Weil, Reference Weil2007)Footnote 2 and demand experts’ opinions (Ashenfelter and Jones, Reference Ashenfelter and Jones2013). In fact, Ali, Lecocq, and Visser (Reference Ali, Lecocq and Visser2008, Reference Ali, Lecocq and Visser2010) exploit an exogenous change in the timing of the release of a highly respected wine reviewer's numerical grading (Robert Parker) to document his influence on wine price. Thus, grading correlates with price.Footnote 3
Regarding the text description, Combris, Lecocq, and Visser (Reference Combris, Lecocq and Visser1997a, Reference Combris, Lecocq and Visser1997b) and Lecocq and Visser (Reference Lecocq and Visser2006) collect not only jury grades of Bordeaux and Burgundy wines, but also have the experts tasting notes. As previously mentioned, indicator variables are created from these notes. They separate the sensory characteristics into olfactory (e.g., aromatic intensity, finesse of aromas, complexity) and gustatory features (firmness, excessive acidity, suppleness, flatness, fat, well concentrated, harmony, fine tannins, and finish). Each of these is either binary variables or ordered on a Likert scale. Combris, Lecocq, and Visser (Reference Combris, Lecocq and Visser1997a) argue that it is the objective characteristics that correlate with price, while the sensory characteristics better correlated with the jury grade. Lecocq and Visser (Reference Lecocq and Visser2006) find evidence that some of the sensory variables have a statistically significant relationship with the wine's price, even controlling for the jury grade. Yang, McCluskey, and Ross (Reference Yang, McCluskey and Ross2009) use a consumer panel of wine tastings. They have consumers complete a Likert scale evaluation ranging from 1 to 9 on eight dimensions, four related to the consumers preferences, and four related to the observed intensity (aroma, flavor, astringency, bitterness). Trained and untrained tasters were considered. Ramirez (Reference Ramirez2010) counts the number of words used in tasting notes and shows that it correlates with price. Separating quality from producer reputation tends to suggest that reputation has a stronger relationship with price (Landon and Smith, Reference Landon and Smith1998a, Reference Landon and Smith1998b; Oczkowski, Reference Oczkowski2001).
Ashenfelter (Reference Ashenfelter2008) provides an important evaluation of the prices of Bordeaux wine. He argues that most of the variation in prices can be explained by producer and vintage. The first-growth Bordeaux wines are famous and expensive. Those in the market for them can be expected to be quite informed. For less-famous wines, observable characteristics such as the producer and the vintage are available. Regional reputation matters for the price (Schamel, Reference Schamel2009), as does producer technological investments (Gergaud and Ginsburgh, Reference Gergaud and Ginsburgh2008). Weather in Napa is considered by Ramirez (Reference Ramirez2008). He finds that while weather correlates with quality ratings, it has a stronger correlation with price. My work complements their findings. I show that some of the unexplained variation in prices can be attributed to information consumers gather from the text describing the wine.
The use of LDA in economics is new and represents an important contribution to the field. The notable exception is the work of Hansen, McMahon, and Prat (Reference Hansen, McMahon and Prat2018), who evaluates Federal Open Market Committee (FOMC) transcripts. They use the variation in topics discussed, assessed using LDA, as the dependent variable to appreciate how experience on the FOMC and transparency interact. This work differs in that I use LDA to gain valuable information to be used as an explanatory variable in the forecasting of a more-standard economic variable. Outside of economics, LDA is popular. As one measure, Blei, Ng, and Jordan's (Reference Blei, Ng and Jordan2003) paper that introduced the algorithm has more than 25,000 citations. It has been used effectively in related fields such as political science. Grimmer (Reference Grimmer2010) uses LDA to analyze press releases from U.S. senators. Quinn et al. (Reference Quinn, Monroe, Colaresi, Crespin and Radev2010) use it to evaluate speeches in the U.S. Senate. It has been used recently in marketing to evaluate online discussions of products (Tirunillai and Tellis, Reference Tirunillai and Tellis2014) and in accounting to identify trends in 10-K disclosures (Dyer, Lang, and Stice-Lawrence, Reference Dyer, Lang and Stice-Lawrence2017).
III. Latent Dirichlet Allocation
LDA is a computational linguistic algorithm (Blei, Ng, and Jordan, Reference Blei, Ng and Jordan2003). It allows for the creation of communication measures based on topic models, which is a class of machine learning algorithms for natural language processing.
LDA allows for automatic clustering of any kind of text documents into a user chosen number of clusters, known as topics. It uses a probabilistic model of text data. The method's logic is that when authors write about a particular topic, they tend to use the same words. Hence, in texts about the same topic, similar words tend to co-occur. LDA describes each topic as a probability distribution over words, and each document as a probability distribution over topics.
I briefly describe the LDA algorithm. An interested reader is encouraged to consult Blei, Ng, and Jordan (Reference Blei, Ng and Jordan2003) or Schwarz (Reference Schwarz2018) for further details. Each document d in a set of documents D is described as a probabilistic mixture of T topics. A document topic vector, θd, describes the document. Rather, a document is determined by a probability distribution over topics. Each topic t in the set of topics T is described by a probability distribution over the vocabulary of V words present in all documents. Rather, within each topic, a probability distribution of words in the dictionary exists. For each document, the topic proportions are drawn from a Dirichlet distribution with parameter α, and for every topic, the word probability distribution is drawn from a Dirichlet distribution with parameter β. Thus, the researcher must only select the number of topics to organize the documents into and the two hyperparameters α and β.
Gibbs sampling is used to estimate the conditional probabilities that best explain the corpus of documents.Footnote 4 I follow the conventional norms in the literature by setting, as my baseline, α = 0.25 and β = 0.1 (Schwarz, Reference Schwarz2018). Furthermore, the baseline specifications in the paper consider organizing the documents into three topics. I choose three because it is a coarse division and, therefore, is the topic differentiation that minimizes consumer's mental efforts. In a supplemental appendix, I provide alternative estimations considering more topics and show that the primary results are not sensitive to the use of three topics. Furthermore, I consider other values of the hyperparameters used and again show in the supplement that the main results are not sensitive to the values chosen.
From this process, LDA calculates for each document the probability it falls within topic t, ρd(t). With three topics (t = 1, 2, 3) it follows that ρd(1) + ρd(2)+ ρd(3) = 1. These three variables, then, classify the topics discussed in the document. They become important explanatory variables in my analysis of wine prices.
LDA is not the only way to quantify text. Previous efforts have relied on dictionary methods. With these, the researcher must first select a set of words that are believed to be important. For each document in the corpus, then, either the existence of the word or the number of words within the dictionary that arise are counted. See Gentzkow and Shapiro (Reference Gentzkow and Shapiro2010) for a prominent example. This approach has a long history in wine reviews, as discussed previously, but has relied on hand coding of words researchers have thought is important. LDA, on the other hand, does not involve the researcher's pre-knowledge or discretion. It provides a way of uncovering hidden themes in text without having to link themes to particular word lists prior to estimation. King, Lam, and Roberts (Reference King, Lam and Roberts2017) point out that the human brain does not excel at recalling all keywords needed to adequately describe a topic. Instead, humans are good at making associations. Formal dictionary building techniques, such as LDA, do not rely on the researcher's ability to fully construct the keyword list. Thus, LDA is valuable when the researcher does not know a priori which words are the important ones to track. This allows me to avoid subjective judgments and to account for context.
As argued by Hansen, McMahon, and Prat (Reference Hansen, McMahon and Prat2018) in their use of LDA, “we believe [our work] illustrates the value of combining traditional economic tools with those from the increasingly important world of Big Data for empirical research in economics” (p. 867). My work furthers this research agenda. To the best of my knowledge, mine is the first to use LDA to capture product differentiation and explain its relationship to price.
IV. New York Wines
To investigate a wine description's relationship with wine prices, I collect reviews from the web site winereviewsonly.com (accessed August 18, 2018). For each wine reviewed, the region of the state in which it is produced is provided. The varietal is listed. Price and the numerical rating are given. The identity of the reviewer, the date of the review, and the wine's vintage are also published. Importantly, a textual description is given.
A. Data
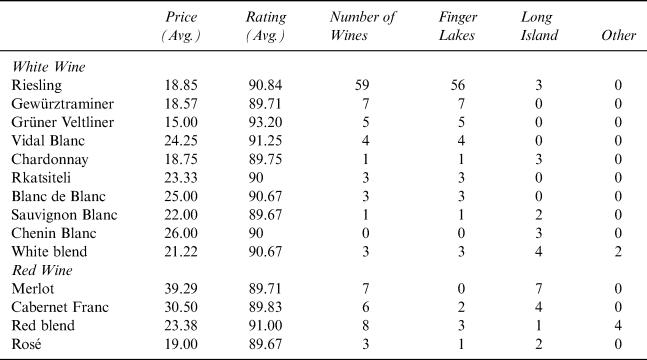
Within this data set, I first consider wine produced in New York state. There are 124 wines. New York has two dominant wine regions. The Finger Lakes region of upstate New York specializes in the growing of Riesling and other central European white wines. Also, Long Island has a niche wine industry as well. Production is divided between reds (48%) and whites (52%). Overall, 72% of the wines reviewed come from the Finger Lakes, and 23% come from Long Island. Table 1 provides a list of wine varieties in the sample.
New York Wine

Note: The blend categories also include other varietals with two or fewer observations.
Thus, there is variation within a region and variation across regions in the wines produced. White wines tend to have higher numerical ratings, led by Grüner Veltliner, but red wines tend to have higher prices, led by Merlot. Riesling is the most popular wine in the data set, making up almost 48% of the observations. This is the wine of choice in the Finger Lakes region. For the full sample, the average price is $21.50 (σ = 9.05 with a minimum, median, and maximum of 8, 18, and 60, respectively). The numerical ratings average 90.63 (σ = 2.14 with a minimum, median, and maximum of 86, 90, and 96, respectively).
First, for each description I remove basic punctuation.Footnote 5 Without doing so, LDA would, for example, differentiate “wine”, “wine,”, and “wine.” as separate words. I do not remove any other words from the descriptions. Since one of the values of this method is that the analysis is untainted by researcher influence, I choose to manipulate the text as little as possible.
As mentioned, my baseline evaluation is to organize the descriptions into three topics. My motivation is that considering only three topics allows for the simplest and coarsest differentiation for consumers. If a particular topic can be shown to be highly correlated with the price when documents are organized into only three topics, then allowing for a finer classification should remove any subtopics unrelated to price and enhance the estimated effect. Later, I check the result's sensitivity to the number of topics selected. Thus, for each observation, three new variables are created: Topic 1, Topic 2, and Topic 3. Each range between 0 and 1, they sum to one, and can be interpreted as the probability the description falls in each topic.
B. Hedonic Price Estimation
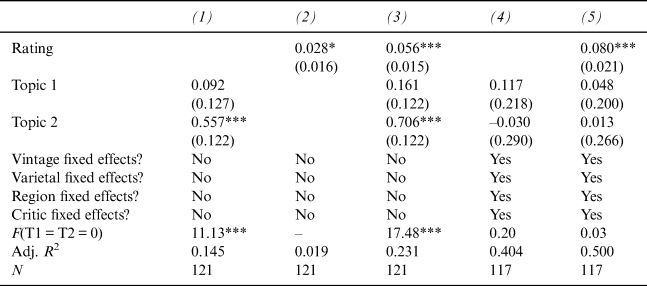
To evaluate the relationship between the description and price, I estimate a hedonic price equation. The dependent variable is the log of the price. Specifications differ in which control variables are included. Table 2 provides the results.
Explaining Prices of New York Wines

Notes: Dependent variable = log(price).
Standard errors presented in parentheses; *, **, and *** denote statistical significance at the 10, 5, and 1% levels, respectively.
There are 16 vintage, 16 varietal, 4 region, and 12 critic fixed effects included.
A constant is included in each specification, but not reported.
The first specification, column (1), suggests that Topic 2 is associated with higher prices, relative to Topic 3, the omitted one. As to be expected, the numerical rating is associated with a higher price, column (2). Combining the specifications, the second topic for the text descriptions maintains its statistical significance, column (3).
These do not control for the wine's characteristics. Columns (4) and (5), then, include other observable characteristics of the wine, namely the vintage, varietal, region, and critic evaluating the wine. Including these controls, the wine's description loses its statistical significance. The difference between the wine descriptions disappears, as well as the collective explanatory value, as indicated in the F-stat for the joint hypothesis that the topics all have a zero effect, F(T1 = T2 = 0). Including these controls dramatically increases the goodness of fit as well. This suggests that the wine's description is not providing any more information than the basic information of who produced the wine and what type of wine it is. The numerical rating, on the other hand, continues to provide additional information explaining the price charged.
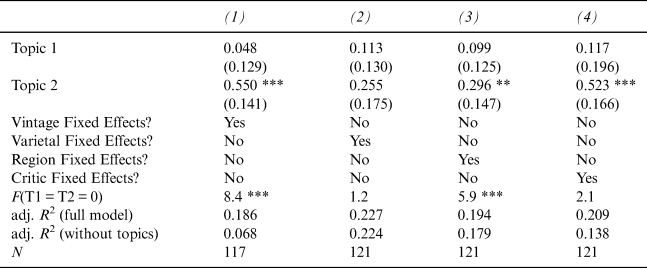
Since the fixed effects as a group take away the explanatory power of the text description, Table 3 adds one set of fixed effects at a time, to explore which are causing this to occur.
Varietal and Descriptions

Notes: Dependent variable = log(price).
Standard errors presented in parentheses; *, **, and *** denote statistical significance at the 10, 5, and 1% levels, respectively.
There are 16 vintage, 16 varietal, 4 region, and 12 critic fixed effects included.
A constant is included in each specification, but not reported.
The goodness of fit calculations provided in the last two rows are from the specification excluding the topic controls.
Topic 2 remains positive and statistically significant in all specifications except the one reported in column (2). Furthermore, the topics are jointly zero there as well. In column (2), only the varietal is controlled for. This suggests that the text description is providing the consumer with the same information as the wine's variety. Once it is controlled for, there is no additional explanatory effect on price.
Also, Table 3 provides the opportunity to evaluate the relative importance of each type of explanatory variable. It gives the adjusted R 2 for each regression to assess its goodness of fit, and also provides the measurement for the same specifications but excluding the topic variables. The model that uses varietal controls provides the most explanatory power (adjusted R 2 = 0.227), and the inclusion of the topic variables improves it by only 0.003. For the other sets of explanatory variables, the topics provide more of an improvement in the model's goodness of fit. Thus, the wine's varietal is important.
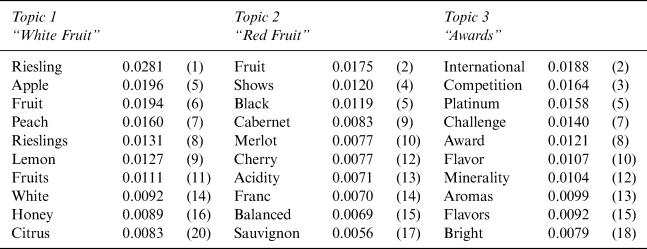
Up to this point, only the generic labels have been used to identify the topics covered in the text. Table 4 provides a breakdown of some of the popular words that comprise each of the three topics. To illustrate, 10 of the top 20 words are provided. Within each of the three columns, the first number is the probability weight put on the word. That is, I present the probability of observing that particular word (from the set of all words in the vocabulary) conditional on that topic being selected. The number in the parentheses is the word's ranking.
Text Analysis: New York Wine

Topic 1, which I label as White Fruit, consists primarily of fruit references that are typically associated with Rieslings and other similar German/Austrian white wines. The second category, labeled Red Fruits, explicitly names Cabernet Franc and Merlot, and uses darker words such as “black,” “cherry,” and “acidity.” The final topic, labeled Awards, consists of words that are associated with wine competitions. Table 1 shows that the German/Austrian whites (Riesling, Gewürztraminer, and Grüner Veltliner) have above average numerical ratings and below average prices. The reds (Merlot and Cabernet Franc) have below average ratings but above average prices. Therefore, it is not surprising that Red Fruit is associated with a higher price in the regression analysis, even controlling for the numerical rating, until the varietal is controlled for.
It is important to note that a word can appear in multiple lists. The numbers provided in the table are the probability that the particular word arises in a document, given that the document is one on that topic. In fact, every word in the vocabulary would have such an estimated probability for each topic. Table 4 simply identifies a subset of words with the greatest weights. It may be more informative to consider the probability that a document is on a particular topic given the existence of that particular word in the document. For example, the probability that the word “peach” is used in a document that is within the White Fruit topic is 1.6% (Table 4). On the other hand, using its weight in the other two topics, the probability of a document that uses the word peach is one on the White Fruit topic is 84.7%.
A few samples should shed light on how LDA classifies texts here. Using the estimated values of ρd(t), those descriptions in the top deciles are those that can be categorized clearly within a particular topic. For example, an observation of a description that falls within the Light Fruit topic is provided below.
The vineyards of New Yorks Finger Lakes are proving to be a great source of high quality Rieslings The 2014 Hermann J Wiemer Dry Riesling makes a striking impression with its fruit intensity and shows the beautiful complexity and racy appeal of the worlds best Rieslings The aromas are full and forward with lovely scents of peach apricot grapefruit and Meyer lemon fruits enhanced by nuances of white flowers and honey The flavors are pure and complex with the citrus and peach fruits followed by honey and spice tones With its ripe style intensity of fruit and electric acidity it is reminiscent of a trocken Riesling from Germanys Pfalz region It is an outstanding example of Finger Lakes quality and well worth seeking out
The bolded words are those that arise in the top 200 words for the topic, and the italicized words are those that show up in the top 25. As stated, punctuation has been removed from the text. As one can see, numerous words just from the ten posted previously show up in the text. This particular wine is priced at $24 and received a 91 rating, which puts it right at the mean price and rating for wines in the sample. This is consistent with the findings in Table 3 that the Light Fruit category is not statistically different.
The Red Fruit topic is shown to have a price premium (Table 2), until the varietal is controlled for (Table 3). As with the White Fruit, samples of descriptions within the top decile of those texts that have the highest value of Topic 2 are presented.
Great Cab Franc from the Finger Lakes who knew Not me before tasting this wine but I found it entirely convincing and actually well worth the hefty price tag Deep and dark it displays blackberry fruit with a black cherry note as well and the wood and tannin are nicely weighted in balance with the fruit A light herbal aroma is true to the grape variety and is quite pleasant without seeming green or under-ripe
This Cabernet Franc is explicitly named as one in the text and uses many descriptive words that show up as important in defining the Red Fruit topic.Footnote 6 Interestingly, while this one is rated a 90, it is priced at $40, which is more than two standard deviations above the mean price in the sample. As another example,
Deeply flavorful with good intensity that is achieved without a lot of body or weight Red and black berry notes are very pleasant and tannin and wood are nicely balanced
This Merlot, from the North Fork region of Long Island, has a short description but is packed with descriptive words indicating it is a red wine. This wine received a numerical rating of only 88 but has a price of $60, which is actually the most expensive wine in the sample. Without controlling for observable characteristics, Red Fruit wines have above average prices. Once the varietal is controlled for, the descriptions simply provide information on this variety so that there is no residual value to the description left.
The Awards topic, on the other hand, is shown to come with statistically lower prices (Table 2). Again, looking at the description from the top decile of those with the highest probability of being within the Awards topic illustrates the description's fit.
The Blue Waters Riesling is yet another superb expression of the grape from Swedish Hills Winery The 2013 offers richness and structure with notes of mandarin orange and tropical fruit Platinum award winner at the 2015 Critics Challenge International Wine Competition
This description consists almost exclusively of words that arise in the Awards topic. In fact, the words ranking 2, 3, 4, 5, 7, 8, and 9 in the Awards topic list are all included.Footnote 7 Overall, for this observation, the probability it falls within the Awards topics is 83.4%. Interestingly, it received a 91 rating as well, but only costs $14. Thus, it is offered at a price discount.
As another example,
Swedish Hills Humphreys Vineyard Riesling offers notes of wet stone and tropical fruit with good minerality all in a beautifully balanced package that is made for raw or steamed shellfish Another example of the ability of the Riesling grape to thrive in upstate New York Platinum award winner at the 2015 Critics Challenge International Wine Competition
Again, a text description full of words used in the Awards topic rises. This entry has a value for Awards of 0.8374. It was given a numerical rating of 95, putting it in the upper echelon of wines in the sample (more than two standard deviations above the mean), but is priced at only $22. Thus, text descriptions that fall within the Awards topic are priced less. Recognizing, though, that both of these examples are Rieslings, which are, on average, lower in price (Table 1), controlling for varietal and the numerical rating, eliminates the informativeness of these reviews.
V. Oregon Pinot Noir
The results from the analysis of New York wines show that the wine descriptions are not providing much more information that what knowledge of the wine's variety provides. To further explore the text's informational value, I isolate one popular varietal and evaluate differences in the wine's description and whether a systematic relationship with the price exists. Furthermore, because a wine variety tends to differ with the region in which it grows, I focus on one specific varietal in one specific state. I choose the Pinot Noirs grown in Oregon.
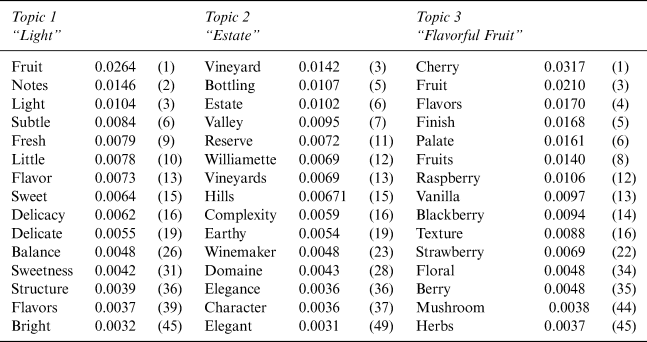
There are 238 Pinot Noir wines produced in Oregon within the sample. As with the New York wines, I first conduct an LDA analysis on the wine descriptions maintaining the baseline of three topics. As before, punctuation is dropped from the text. Also, here, the words “pinot,” “noir,” and “Oregon” are removed (along with plural and possessive forms). They are removed because these three words are true for every wine in the sample and, therefore, is redundant for a critic to include in his/her review. Categorization of the descriptions based on the use of one of these words would be uninformative to the consumer. Table 5 provides a sample of the words associated with each of the three topics, along with the estimated probability the word arises for a description that falls within the topic and the ranking of the word's importance in the topic's classification (provided in the parentheses).
Text Analysis: Oregon Pinot Noir

I provide a descriptive label for each of the three categories. As one can see, the first topic, Light, consists of words such as “light,” “subtle,” “fresh,” and “delicate.” These descriptions relate to the soft tastes and smells of the wine.Footnote 8 The second topic, Estate, are descriptions for the terroir and winemaker's status. The third topic, Flavorful Fruit, consists primarily of references to berries, flowers, and herbs that describe the wine's taste and smell. These simple descriptive names will be used for the three topics.
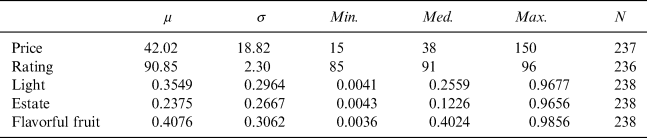
Notice that the word fruit shows up as important in two topics. This illustrates the importance of LDA. If keywords are selected beforehand by the researcher, it would be reasonable for him/her to classify fruit flavors together. Here, LDA reveals that such a division is not optimal. Berry-related fruit should be separated from light, delicate fruit flavors and smells. Thus, it is the co-occurrence of words that matters, not the existence of a single word. Observing the word fruit in a document means that the probability that the document is on the first topic is only 53.7%, even though it is the word with the greatest probability of being used, given that the document is on the first topic. Table 6 provides descriptive information about their price and quality rating for this data set.
Descriptive Statistics: Pinot Noir

Oregon Pinot Noirs have substantially higher prices than New York wine with more variation in price. Ironically, the numerical rating is not much greater. The Flavorful Fruit topic is the most prevalent in the text descriptions in that the mean value placed on the probability of being within this topic across all documents is greatest.
Investigating one specific varietal in one specific region of the world, does the wine's description have a relationship with its price? Table 7 provides results from a hedonic price equation with log price as the dependent variable.
Explaining Prices of Oregon's Pinot Noir Wine

Notes: Dependent variable = log(price).
Standard errors presented in parentheses; *, **, and *** denote statistical significance at the 10, 5, and 1% levels, respectively.
There are 16 vintage, 22 producer, and 14 critic fixed effects included.
A constant is included in each specification, but not reported.
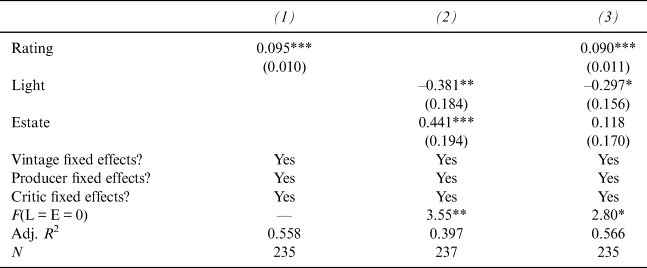
As before, the numerical rating is highly correlated with price, column (1). An increase in rating by one standard deviation increases the price at the mean by approximately 22%.
The text descriptions also exhibit a statistically significant relationship with the price (column (2)). Even controlling for the vintage, producer, and the wine critic, column (3), the Light category sees lower prices and the Estate has higher prices than the Flavorful Fruit omitted category. Additionally, the F-statistic for the joint hypothesis that the topics are all zero is large, F(L = E = 0) = 3.55. This suggests that the text description provides information to consumers.
The final column calls this finding into question. Here, both the text description and the quality rating are included (along with all controls). The descriptive variable's magnitude reduces substantially. Also, the statistical significance is dampened. Thus, the numerical rating captures the important differences that drive wine prices. This finding can be explained by the text descriptions correlating with the numerical rating. The rating and vintage, producer, and critic controls explain 65% of the variation in price. Adding the text description increases this to only 66%.
VI. California Cabernet Sauvignon
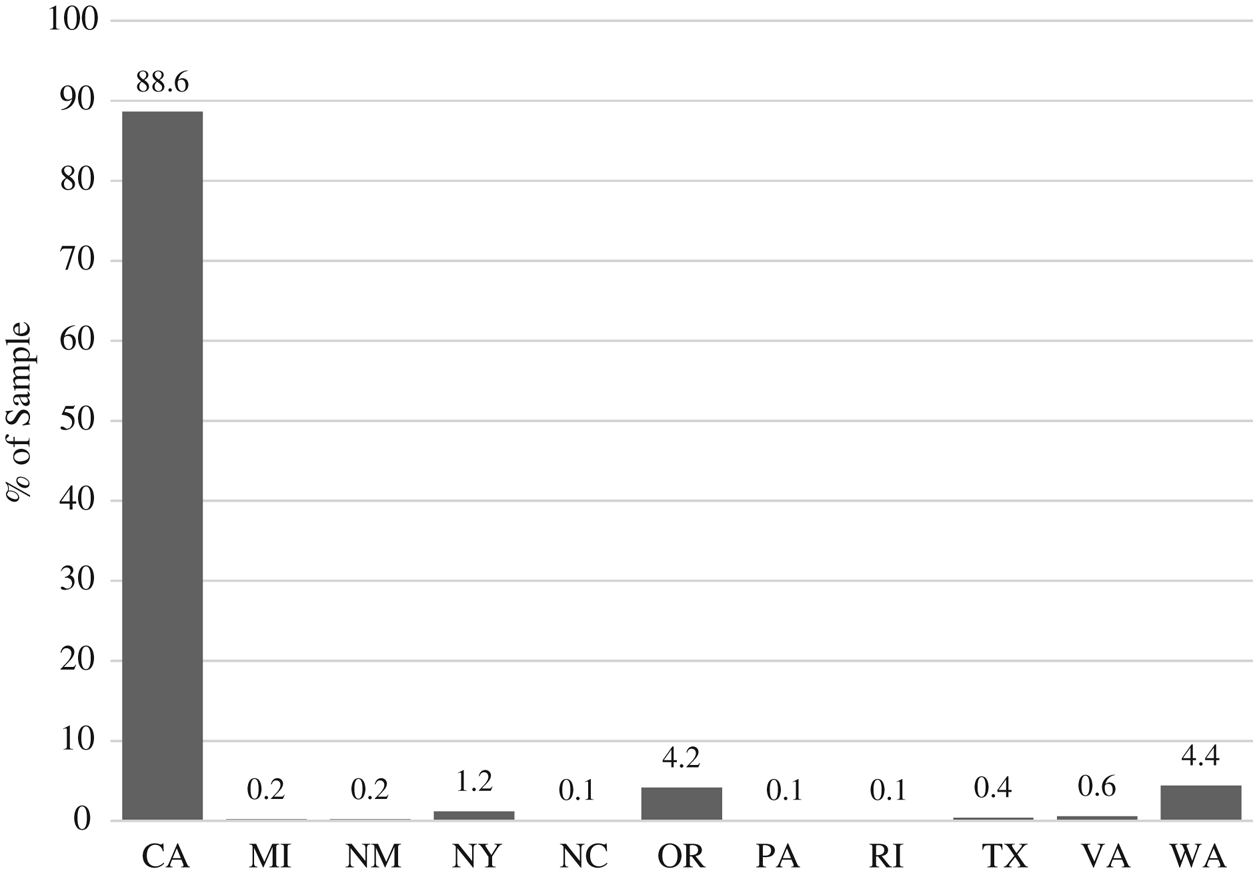
To further drill down into the relationship between a wine's textual description and its price, I now isolate not only one particular varietal in one particular state, but also, zone in on one particular numerical rating. In the United States, California dominates the wine industry. The data set obtained, for example, contains far more California wines than any other state. Figure 1 illustrates.
Wines Reviewed by State

Within California, Cabernet Sauvignon is popular. It makes up 17.8% of the reviews.Footnote 9 Within the California Cabs, the mean, median, and mode numerical rating is a 90. This occurs for 259 wines. Therefore, I isolate 90-rated, California Cabernet Sauvignon reviewed.
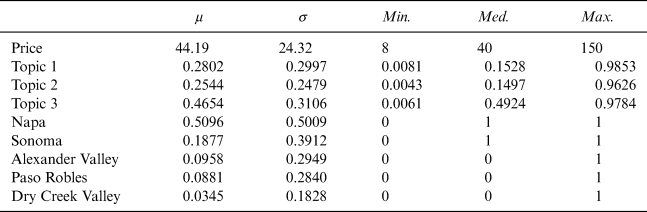
First, the descriptive statistics of the subsample are described in Table 8.
Descriptive Statistics: 90-rated, California Cabernet Sauvignon

Note: The omitted region is all other areas of California.
Of this specific cohort, more than one-half of the wines are from the Napa region, which is to be expected given its prominence in the production of Cabernet Sauvignon. Regarding price, the substantial variation is noteworthy. Each of these 259 wines is rated by wine critics at exactly the same numerical score. Prices, though, range from only $8 (Oak Grove Family Reserve) to $150 (Chateau St. Jean).
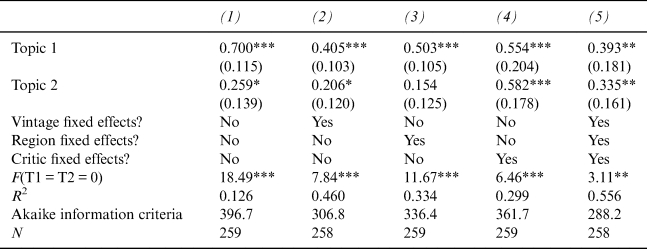
As before, I organize the documents into three topics. Table 9 explores the relationship between these topics and the wine's price.
Explaining Prices of 90-Rated, California Cabernet Sauvignon Wine

Notes: Dependent variable = log(price).
Standard errors presented in parentheses; *, **, and *** denote statistical significance at the 10, 5, and 1% levels, respectively.
There are 19 vintage, 6 region, and 12 critic fixed effects included.
A constant is included in each specification, but not reported.
Again, the topics created via LDA are highly correlated with the wine's price. This time, though, the statistical significance remains when all control variables are included. For the sample of 90-rated, California Cabernet Sauvignons, the vintage, the region of the state, and critic fixed effects are included.
Thus, wine descriptions do provide additional information that consumers value, explaining over 12% of the variation in the wine prices.
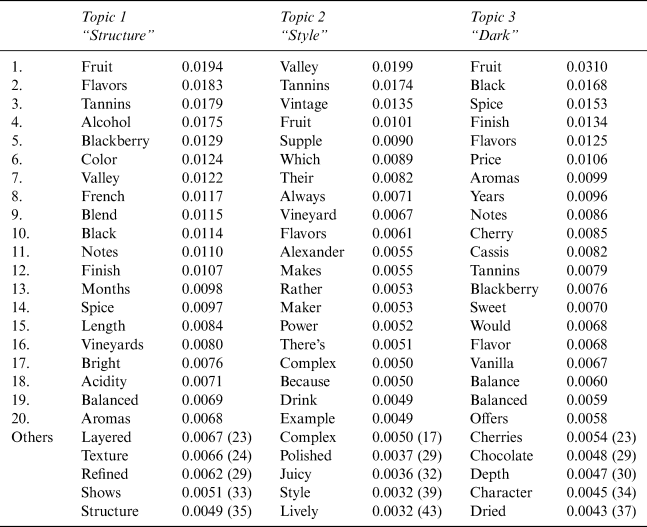
Topics 1 and 2 experience a price premium relative to Topic 3, the omitted one. In Table 10, I provide information on the words used that make up each topic.
Text Analysis: 90-rated, California Cabernet Sauvignon

The top panel provides the top 20 words. The bottom panel highlights five additional words that help label each category. I label the first topic Structure as it consists of words related to specific dimensions that the critic is writing about: flavors, alcohol, color, notes, finish, length, etc. The sensory characteristics of the wine, then, coincide with a price premium paid by consumers. I label the second topic, Style. Descriptive words such as “supple,” “power,” “complex,” and “polished” are summary words used to convey the wine's properties. The final topic, which I label as Dark, consists of words like “spice,” “cherry,” “blackberry,” and “chocolate.” Wines that have descriptions that fall into the Dark topic tend to be sold at a price discount, even conditioning on the quality rating, varietal, state, region within the state, and vintage.
In a supplemental appendix, I redo the analysis on California Cabernet Sauvignon wines but consider other popular numerical ratings. The results extend to these complementary analyses. Some topics pop as being sold at a price premium, relative to another topic that is sold at a relative price discount. Across these other numerical ratings, the significance of the text descriptions remains when vintage, region, and critic fixed effects are included.
VII. Oregon Reconsidered
The observation in Section V is, that, using Oregon's Pinot Noirs, the textual descriptions lose their statistical significance when the numerical rating is included. The punchline from Section VI, using California's Cabernet Sauvignons, is that indeed, there is a relationship once the numerical score is properly controlled for. I argue that by isolating a quality rating level for one particular varietal, these two dimensions are fully controlled for, allowing the identification of the impact of textual description on price. One should be concerned whether this is an artifact of California Cabernet Sauvignon or true for all wines. Presumably, these two findings complement one another because only three topics were allowed. Limiting the number of topics forces potentially highly differentiated products into the same category. If more topics are created, then the separation should allow for the text descriptions to maintain their importance.
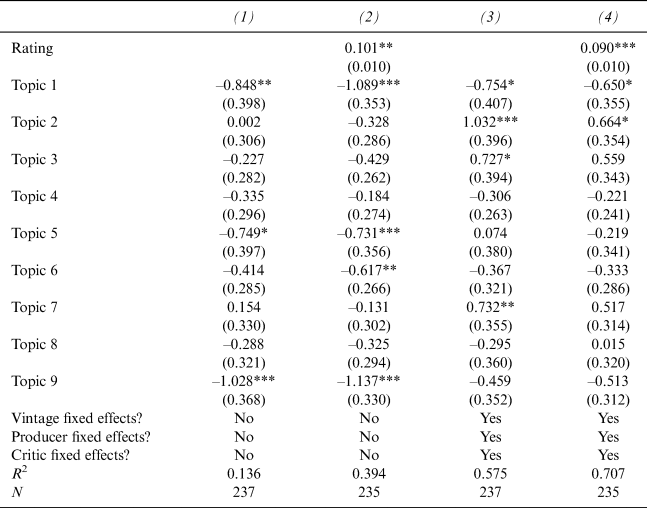
To explore this, I return to the Oregon subsample. Rather than bucket the wine descriptions into three topics, I instead allow there to be ten different topics covered in the descriptions. With these finer categorizations, I explore whether the price of Pinot Noir wines made in Oregon is related to the wine's description, as was shown in the California Cabernet Sauvignon sample. If it is the case that some descriptions are informative, but organizing the wines into three topics does not allow for the valuable information to be differentiated, then some topics should remain correlated with the price when the numerical rating is included. Table 11 extends Table 7 previously presented.
10-Dimension Text Descriptions of Oregon Pinot Noir

Notes: Dependent variable = log(price).
Standard errors presented in parentheses; *, **, and *** denote statistical significance at the 10, 5, and 1% levels, respectively.
There are 16 vintage, 22 producer, and 14 critic fixed effects included.
A constant is included in each specification, but not reported.
Compared to Topic 10, the omitted one, Topic 1 and Topic 2 maintain a statistical difference with the former associated with lower prices and the latter coming with a price premium. Topic 1 uses words related to the freshness of the wine (e.g., “style,” “fresh,” “herbs,” and “purity”), Topic 2 continues with the Estate words such as “reserve,” “delivers,” “domaine,” “savory,” and “quality.” Thus, even within this sample, there is a relationship between the text descriptions and the price.
Also, while not presented here, the New York sample can be reconsidered, allowing for more topics. As is the case with Oregon wines, some topics become statistically significant once the documents are more finely subdivided. Thus, evidence exists in all samples that price correlates with the textual descriptions.
VIII. Conclusion
In markets for experience goods, consumers presumably are in need of information. Text descriptions can provide this. Using wine as a prominent example of an experience good that many consumers are poorly informed about, my investigation's objective is to assess whether the text descriptions that accompany wines convey information to consumers that affect their demand and, ultimately, influence the price charged. A journey through wines produced in the United States is undertaken to achieve this. First, I consider wines produced in New York. While the text correlates with price, once the varietal is controlled for, the statistical significance disappears. This suggests that the text is basically conveying the varietal being sold. To eliminate this effect, only one varietal is chosen in one state—Pinot Noir produced in Oregon. Again, within this sample, the text is correlated with price. Here, the statistical significance dampens when the numerical rating is controlled for. This suggests that some words and phrases convey high quality to consumers, while other descriptions do not. Thus, the textual description is not conveying anything more than the numerical score does. The final sample I consider zones in on not just only one varietal produced in one state, but also restricts to one particular numerical rating. Here, I consider the most common rating of a wine produced in substantial volume in the United States: 90-rated, Cabernet Sauvignon wines produced in California. Focusing on this one subsample, I find that the text correlates with the prices charged. The effect cannot be explained away by the other information consumers may know at the time of sale. Thus, wine descriptions do indeed convey some information to consumers that affect their demand and, ultimately, price.
An important point made by Combris, Lecocq, and Visser (Reference Combris, Lecocq and Visser1997a) in their hedonic price analysis of wine is that while sensory characteristics affect the utility received from an experience good such as wine, which is reflected in its numerical rating, only observable characteristics are reflected in its price. This is due to the inability of a consumer of an experience good to correctly anticipate the sensory characteristics at the time of purchase. Text descriptions provide an avenue for consumers to collect some of this information. Therefore, it is not surprising that consumers value this information. Furthermore, Ashenfelter (Reference Ashenfelter2008) illustrates that knowledge of the producer and the vintage explain a high percentage of the variation in the prices of wine. His data focuses, though, on the most elite, high-priced wines in the world. For my sample of wines, drunk more commonly by the typical consumer, the explanatory value of producer/region and vintage is more modest. Thus, there are other important variables that must be explaining the variation in prices observed. I show that the information provided in the wine's descriptions is closing this gap.
The primary contribution here is to identify the value of text to consumers in their purchasing of experience goods. Numerous future investigations that are not addressed here exist. For example, I use the text provided by professional wine reviewers. Producers can write their own descriptions. This can open up credence goods-related problems where the seller's diagnosis can be misrepresented (Bester and Dahm, Reference Bester and Dahm2018). It is unclear, which is more informative to consumers. Relatedly, producers can choose which words to use in their descriptions. Presumably, the methods outlined here could guide such an effort. Furthermore, a retailer can select whether to post a description and which to post. A prominent example of this is movie reviews included in an advertisement or critic comments printed on a book jacket. The choice to not post can be informative (Bederson et al., Reference Bederson, Jin, Leslie, Quinn and Zou2018), and this tradeoff is not considered here. I view the work presented as an important first step into using topic modeling approaches developed in computer science to extend our understanding of how markets function.