INTRODUCTION
Cotton (Gossypium hirsutum L.) yield is determined by the number of mature bolls and by boll size (Boquet et al., Reference Boquet, Moser and Breitenbeck1993). Boll number per unit area was considered to be the largest contributor to lint yield, followed by seed number per boll and lint mass per seed (Worley et al., Reference Worley, Culp and Harrell1974). Cotton cultivars with greater boll weight are desired by cotton producers harvesting lint manually because larger bolls need less labour than smaller bolls. The development of cotton bolls depended primarily on adjacent leaves (Kerby et al., Reference Kerby, Buxton and Matsuda1980). Benedict and Kohel (Reference Benedict and Kohel1975) used 14C labeling to demonstrate that the primary source of photosynthates for a boll was its subtending leaf. Peoples and Matthews (Reference Peoples and Matthews1981) stated that the main stem leaf subtending a sympodium provided carbohydrates primarily to the first fruiting site and then to the second fruiting site if the fruiting structure at the first fruiting site is shed. So increasing photosynthetic capacity and physiological activity of the source leaves could enhance boll biomass.
Zhang et al. (Reference Zhang, Hu, Chen, Wang, Li and Zhou2007) reported that the leaves subtending bolls with more active nitrogen metabolism and higher soluble protein content after anthesis led to longer time for increase in boll weight, higher fibre weight in single boll and resulted in final boll weight. In addition, the movement of assimilate from source leaf to boll sink is controlled not only by leaf source but also by boll sink strength (Hendrix, Reference Hendrix1990). Boll sink can further be divided into three different sub-sinks, viz. the bur, the seed and the fibre. These express different sink strengths mainly related to genetic background. Competition for dry matter accumulation among fractions of cotton bolls may affect lint mass per boll to a certain extent and ultimately lint yield. Among these, boll bur assumes either source or sink function with varying development phases of cotton boll. It can primarily serve as a sink to receive carbon assimilates from the leaf subtending boll during early boll development, and work as a source supplying assimilates for developing seeds and fibres during late boll development.
Increased partitioning of dry matter to the fibres would account for much of the progress in breeding high yielding cotton cultivars. A greater partitioning of dry matter to the boll walls can delay maturity and increase problems with insects and boll rot. Similarly, excessive dry matter partitioning to the seed may lead to reduced lint mass per boll, because the high oil content of the seed means there is a higher energy requirement for seed production than fibre growth (Wall et al., Reference Wall, Amthor and Kimball1994). Xu et al. (Reference Xu, Li, He and Yang2003) reported that the lower lint mass per boll of ‘Kemian 2’ relative to ‘Simian 3’ was apparently attributed to more efficient partitioning of dry matter into the bur and lower seed-set efficiency. Cotton genotypes with high-strength fibre were usually characterized by lower lint percentage, thicker boll bur and boll cracking less easily in comparison with conventional varieties (Cui and Liao, Reference Cui and Liao2001).
Presently, a large amount of information describing the chronology of cotton boll development, and the effects of environmental factors and cultural practices on boll weight, has been accumulated (Leffler, Reference Leffler1976; Zhang et al., Reference Zhang, Hu, Chen, Wang, Li and Zhou2007; Zhou et al., Reference Zhou, Pei and Jiang1996), such as temperature (Gipson and Joham, Reference Gipson and Joham1968), fertilizer application (Boquet et al., Reference Boquet, Moser and Breitenbeck1993; Zhao et al., Reference Zhao, Qu, Chen and Zhou2010; Zhou et al., Reference Zhou, Chen and Wu2001), plant density (Bednarz et al., Reference Bednarz, Nichols and Brown2006) and planting date (Pettigrew and Adamczyk, Reference Pettigrew and Adamczyk2006). However, little is known on the physiological mechanism affecting dry matter accumulation and partitioning among boll components. A better understanding of the relationship between lint productivity in single boll and boll components development is important to produce lint yield more efficiently. In this research, we selected three cotton genotypes differing in boll weight and lint percentage to investigate differences in dry matter accumulation and distribution among these boll fractions, and their relationship with single boll lint and seed productivity.
MATERIALS AND METHODS
Experimental design
Field experiments were conducted at Agricultural Experiment Station, Jiangxi Agricultural University, Nanchang, China in 2009 and 2010. Genotypes used in this study were ‘2870’ (small boll and high lint percentage), ‘AX’ (small boll and high lint percentage) and ‘MM-2’ (large boll and low lint percentage). 2870 and Ax were bred by Jiangxi Agricultural University, with an average fibre strength of 33.9 cN/tex and 31.9 cN/tex in 2009, respectively (HVICC level). MM-2 was obtained from Institute of Cotton Research, Chinese Academy of Agricultural Science, with an average fibre strength of 31.0 cN/tex in 2009. The three genotypes were planted in a nursery on 18 April 2009 and 24 April 2010, and transplanted to the field on 18 May 2009 and 23 May 2010. Field experiment was arranged in random design with three replicates in each treatment. Each plot consisted of six rows, which were 10 m in length and 1 m apart from each other. The density of the field trial was approximately 22,500 plants ha−1. Because of scarce rainfall that usually occurred during a period of mid-July to mid-August in Yangtse Valley region China, each plot was irrigated once in late July in 2009, but delayed in mid-August in 2010. Other cultural practices, including application of fertilizers and insecticides etc., were conducted according to local agronomic practices unless otherwise indicated.
Sampling
On the day of anthesis, white flowers from the first or the second position on 7–9 sympodial branches were tagged. Only labeled fruits and their subtending leaves from different sympodias were harvested at 7 d intervals from 10 d post-anthesis (DPA) to 52 DPA. The sampling method was designed to minimize the influence of the removal of tagged leaves and tagged fruit on the development of subsequent bolls on the same plant. At each harvest, eight to 10 tagged fruits and corresponding subtending leaves were collected per plot and brought to the laboratory on ice, where bur, fibre and seed fractions were immediately separated from the fruit samples and dried at 110 °C for 30 min and at 50 °C to constant weight. At 10 DPA, it was difficult to excise fibre from the corresponding ovules. Boll weight is the total weight of seed and fibre dry matter per boll. Boll bur ratio, seed ratio and fibre ratio are the proportions of the corresponding dry weights of the total boll dry matter. At the end of the season, a 20-boll sample, including their burs, was hand-harvested from the remaining tagged bolls in each plot. Each sample was processed to determine boll traits, including boll weight, lint percentage, lint mass per boll, seed mass per boll, seed number per boll and bur weight per boll.
Data analysis
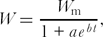
Analysis of variance (ANOVA), curve regression and correlation analyses were performed using SPSS 10.0 statistical package. When statistically important interactions were not detected, genotype means were averaged across years. Means were separated using Duncan's multiple range test at a probability of 0.05. Cotton boll grows with successive lag, exponential growth and asymptotic phases according to previous reports (Hu et al., Reference Hu, Zhang, Chen, Wang, Shu and Zhou2008; Zhou et al., Reference Zhou, Pei and Jiang1996). So we used the following logistic regression model to describe dry matter accumulation for cotton boll development:
 \begin{equation*}
W = \frac{{W_{\rm m} }}{{1 + ae^{bt}}},\end{equation*}
 \begin{equation*}
t_1 = \frac{1}{b}\ln \frac{{2 + \sqrt 3 }}{a},\quad t_2 = \frac{1}{b}\ln \frac{{2 - \sqrt 3 }}{a},\quad V_{\rm m} = - \frac{{b \times W_m }}{4},\end{equation*}
RESULTS
Mean performance of three genotypes in boll characters across two years
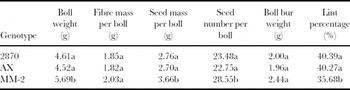
Since there was no interaction between genotypes and years, the genotype means were averaged across years. The three genotypes differed for boll weight, seed mass per boll, seed number per boll and lint percentage but not fibre mass per boll and boll bur weight (Table 1). The two small boll genotypes AX and 2870 shared similar boll characters investigated in this study. Averaged across both years, large boll genotype MM-2 had higher boll weight, seed mass per boll and seed number per boll along with lower lint percentage. It exhibited little difference in lint mass per boll from the other two smaller boll genotypes owing to its low lint percentage. Higher boll weight of MM-2 could be attributable to more seeds per boll in comparison with 2870 and AX.
Mean performance of three upland cotton lines for boll characters across two years in 2009 and 2010.

Within columns, values followed by the same letter are not significantly different at p < 0.05.
Dry matter accumulation
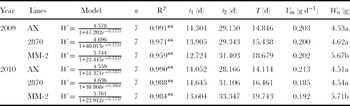
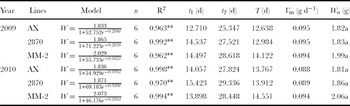
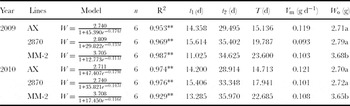
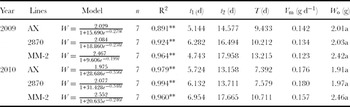
The pattern of dry matter accumulation over time followed a typical sigmoid curve with a lag phase just after t = 0 followed by an exponential phase and then by a stationary phase for the three boll fractions: the seed, the fibre, and the bur. So we simulated the dry matter accumulation curve with the logistic equation. The equations and the parameters that describe the boll dry matter accumulation properties are listed in Tables 2 to 5.
Eigenvalues of total fibre and seed dry matter accumulation in three upland cotton lines with different boll sizes in 2009 and 2010.

**Determination of coefficient significant at the 0.01 probability level.
W is the theoretical maximum of boll weight; t is DPA; n is the number of sampling times; t 1 is the start date of the exponential accumulation period of within-boll dry matter; t 2 is the termination day of the exponential accumulation period of within-boll dry matter; T is the duration for within-boll dry matter exponential accumulation, T = t 2– t 1; V m is the maximal rate of within-boll dry matter accumulation during the exponential accumulation period; W o is the observed value of boll weight.
Eigenvalues of dry matter accumulation in single boll fibre in three upland cotton lines with different boll sizes in 2009 and 2010.

**Determination coefficient significant at the 0.01 probability level.
W is the theoretical maximum of lint mass per boll; t is DPA; n is the number of sampling times; t 1 is the start date of the exponential accumulation period of single boll fibre dry matter; t 2 is the termination day of the exponential accumulation period of single boll fibre dry matter; T is the duration for single boll fibre dry matter exponential accumulation, T = t 2– t 1; V m is the maximal rate of single boll fibre dry matter accumulation during the exponential accumulation period; W o is the observed value of lint mass per boll.
Eigenvalues of dry matter accumulation in single boll seed in three upland cotton lines with different boll sizes in 2009 and 2010.

**Determination coefficient significant at the 0.01 probability level.
W is the theoretical maximum of seed mass per boll; t is DPA; n is the number of sampling times; t 1 is the start date of the exponential accumulation period of single boll seed dry matter; t 2 is the termination day of the exponential accumulation period of single boll seed dry matter; T is the duration for single boll seed dry matter exponential accumulation, T = t 2– t 1; V m is the maximal rate of single boll seed dry matter accumulation during the exponential accumulation period; W o is the observed value of seed mass per boll.
Eigenvalues of dry matter accumulation in boll bur in three upland cotton lines with different boll sizes in 2009 and 2010.

**Determination coefficient significant at the 0.01 probability level.
W is the theoretical maximum of boll bur weight; t is DPA; n is the number of sampling times; t 1 is the start date of the exponential accumulation period of boll bur dry matter; t 2 is the termination day of the exponential accumulation period of boll bur dry matter; T is the duration for boll bur dry matter exponential accumulation, T = t 2– t 1; V m is the maximal rate of boll bur dry matter accumulation during the exponential accumulation period; W o is the observed value of boll bur weight.
Within-boll dry matter (the total of fibre and seed dry matter) accumulation differed significantly among genotypes and the difference was due to the duration of within-boll dry matter exponential accumulation (Table 2). MM-2 tended to have a longer duration of exponential accumulation than AX and 2870. However, there was no significant genotypic difference in the maximal rate of exponential accumulation. These genotypes also did not give prominent difference in the fibre mass per boll because of the least differences in the rate and the duration of exponential accumulation (Table 3). Similar to the behavior of the within-boll dry matter accumulation, the duration of exponential accumulation for the seed dry matter was prolonged to 8.5 d, 3.8 d in MM-2 than in AX and 2870 in 2009, respectively (Table 4). In 2010, the increased duration for MM-2 was 8.0 d and 4.8 d compared with AX and 2870, respectively. Although it had longer duration of seed exponential growth than AX in both years, 2870 did not present significant difference from AX in final seed mass per boll due to a lower rate of seed growth in 2870 than in AX. When averaged across years, the duration of exponential accumulation for the bur was 3.6 d, 3.1 d longer in MM-2 than in AX and 2870, respectively (Table 5). Unfortunately, lower rate of exponential accumulation in MM-2 relative to AX and 2870 could have a damping effect and lead to no significant genotypic difference in final single boll bur weight.
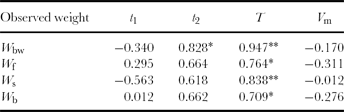
As shown in Table 6, correlation analysis showed significant positive correlations between the final dry weight of all fractions and the duration of dry matter exponential accumulation period (T), but weakly and negatively associated with the maximal rate of dry matter accumulation (V m). The final dry matter mass in all fractions had positive correlations with the termination day of the exponential accumulation period (t 2), which moreover reached a significant level for the within-boll dry weight (r = 0.828, p < 0.05). There were no association between the final fibre and bur dry weight and the start date of the exponential accumulation period (t 1), while the correlations between the final within-boll dry weight, seed dry weight and t 1 were negative but not significant.
Correlation coefficients between Eigenvalue of dry matter accumulation and final observed mass in the bur, fibre and seed of cotton boll.
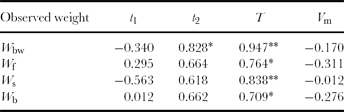
t 1 is the start date of the exponential accumulation period of dry matter; t 2 is the termination day of the exponential accumulation period of dry matter; T is the duration for dry matter exponential accumulation, T = t 2– t 1; V m is the maximal rate of dry matter accumulation during the exponential accumulation period; W bw is the boll weight (final observed value); W f is the single boll fibre mass (final observed value); W s is the single boll seed mass (final observed value); W b is the single boll bur mass (final observed value).
*, **Significant differences at 0.05 and 0.01 probability levels respectively.
Dry matter partitioning
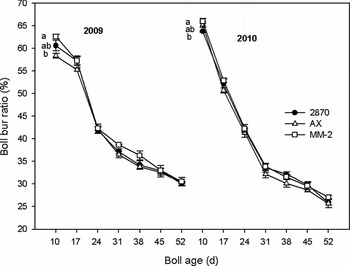
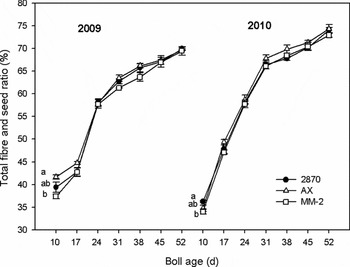
The ratio for partitioning to the bur relative to total boll dry matter was characterized by a declining trend throughout the boll development period (Figure 1). It decreased more quickly during the former half period (from 10 DPA to 31 DPA) than during the latter half period (from 31 DPA to 52 DPA). The boll bur ratio differed significantly among these genotypes at 10 DPA in 2009 and 2010. No significant difference was found among these genotypes for the duration from 17 DPA to 52 DPA in 2009 and 2010. The change of the ratio of the total fibre and seed to total boll dry matter was contrary to that of the boll bur ratio, with a more rapid increase during the former half period than during the latter half period (Figure 2). Genotypic differences in the total fibre and seed ratio only occurred at 10 DPA in 2009 and 2010.
Rates of dry matter partitioning to the boll bur against boll age in 2009 and 2010. Vertical bars represent standard deviation. Points followed by different letters differ significantly at the 5% level, Duncan's new multiple range test.

Rates of dry matter partitioning to the fibre and seed against boll age in 2009 and 2010. Vertical bars represent standard deviation. Points followed by different letters differ significantly at the 5% level, Duncan's new multiple range test.

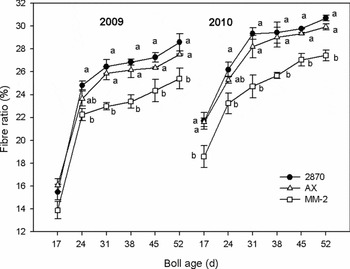
The ratio for partitioning to the fibre relative to total boll dry matter was characterized by an increasing trend at various stages of boll development (Figure 3). It increased rapidly from 17 DPA to 24 DPA and slowly from 24 DPA onwards. Significant differences for the fibre ratio among these genotypes occurred from 17 DPA to 52 DPA in 2009 and 2010. MM-2 exhibited consistently the lower fibre ratio than the other small boll genotypes during the boll development.
Rates of dry matter partitioning to the fibre against boll age in 2009 and 2010. Vertical bars represent standard deviation. Points followed by different letters differ significantly at the 5% level, Duncan's new multiple range test.

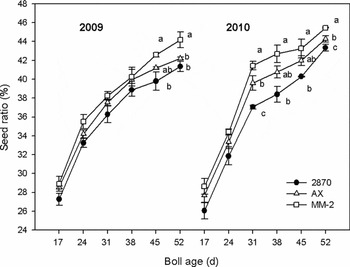
The change of the seed ratio during boll development followed the same pattern as the fibre ratio (Figure 4). The rate of increase in the proportion of seed biomass was also the greatest from 17 DPA to 24 DPA, followed by the duration from 24 DPA to 31 DPA in 2009 and 2010. The seed ratio differed significantly among these genotypes at 45 DPA and 52 DPA in 2009 and from 31 DPA to 52 DPA in 2010. Compared to 2870 and Ax, MM-2 had greater magnitudes of the seed ratio during the boll development phase.
Rates of dry matter partitioning to the seed against boll age in 2009 and 2010. Vertical bars represent standard deviation. Points followed by different letters differ significantly at the 5% level, Duncan's new multiple range test.

DISCUSSION
Photosynthetic assimilates required for boll development are mainly from the subtending leaf (Ashley, Reference Ashley1972) or the leaf subtending an adjacent position on the same sympodial branch (Horrocks et al., Reference Horrocks, Kerby and Buxton1978). Sucrose is the primary form of carbon translocated from cotton leaf and transported to the developing cotton boll through phloem tissue and the funicules (Van iersel et al., Reference Van Iersel, Harris and Oosterhuis1995), where the sucrose is further metabolized into other compounds for many other biochemical reactions affecting the development of the fibre and the seed. The characterization of how cotton boll allocates available photosynthates among its components is critical to better understanding cotton lint yield potential.
The final dry weight in all fractions of cotton boll was mainly controlled by the duration of exponential accumulation of dry matter whereas little association with the maximal rate of exponential accumulation was observed. This is consistent with the conclusions of Hu et al. (Reference Hu, Zhang, Chen, Wang, Shu and Zhou2008), who demonstrated that the longest time period and the lowest accumulating rate led to the highest boll weight. Wang et al. (Reference Wang, Shu, Chen, McGiffen, Zhang, Xu and Zhou2009) reported that the final fibre strength was negatively related to the maximal cellulose-increasing rate, and positively related to the duration of the cellulose exponential accumulation stage in various cultivars.
Significant difference in the proportion of bur biomass among the genotypes only occurred at 10 DAP in this study. The exponential accumulation period of the bur ranged from 5 DPA to 18 DPA for these three genotypes investigated. Benedict et al. (Reference Benedict, Smith and Kohel1973) reported that carbohydrate export into the bur was the greatest between 8 and 10 d post-flowering. Leffler (Reference Leffler1976) reported that dry weight of the bur increased rapidly and reached final weight in approximately 21 DPA, when dry weights of seed and fibre were only about 40% of their final values. These results suggested that cotton bolls gave a preferential partitioning of biomass to the bur during early development. The transitional phase in which boll volume enlargement transferred to boll dry matter filling appeared to be three weeks after anthesis (Xu et al., Reference Xu, Li, He and Yang2003). From then on, all dry matter accumulation by the bolls mainly occurred in the seed and the fibre. MM-2 had greater proportion of bur biomass relative to total boll biomass than AX and 2870 but not statistically significant at maturity in any year. MM-2 partitioned less dry matter to the fibre and more to the seed than AX and 2870 during boll filling period, indicating strong competition for available photosynthate between the seed and the fibre produced on the seed surface. Cottonseed contains significant amounts of oil and protein, which means a higher energy requirement for seed production than fibre growth. MM-2 contained significantly more cottonseed and seed mass in single boll than AX and 2870 (Table 1). This is the reason why MM-2 expressed relatively lower lint percentage than AX and 2870 at maturity.
Environmental conditions may have significant effects on dry matter accumulation and partitioning among boll fractions. The duration for boll bur dry matter exponential accumulation was 9.4 d, 10.2 d and 13.2 d for AX, 2870 and MM-2, respectively, in 2009 (Table 5), but it declined to a low duration of 7.4 d, 7.6 d and 10.7 d, respectively, in 2010 (Table 5). The duration of the seed exponential growth period was 0.6 d, 1.9 d, 0.9 d longer in 2009 than in 2010 for AX, 2870 and MM-2, respectively (Table 4). However, the duration of the fibre exponential accumulation remained fairly stable over two years (Table 3). These results implied that the fur growth might be more responsive to environmental conditions than the seed growth and the fibre growth. The ratio of within-boll biomass to total boll biomass at every boll harvesting date for three genotypes was greater in 2010 than 2009, except for 10 DPA (data not shown). This is presumably due to comparatively less rainfall in the boll development phase, thereby shortening boll maturation period in 2010, whereas the rainfall was at an optimum level suitable for boll development in 2009, implying adverse conditions might increase the dry matter partition to the fibre and seed of developing bolls rather than the bur. Hay (Reference Hay1995) demonstrated that major environmental factors have influence on harvest index in the presence of severe stress. Sadras et al. (Reference Sadras, Bange and Milroy1997) reported that cotton reproductive allocation showed relative stability in response to a wide range of growing conditions generated by manipulation of sowing date, nitrogen fertilizer and plant density. If burs were regarded as vegetative tissues and fibres and seeds as reproductive tissues in the present study, the ratio of within-boll biomass to total boll biomass can be expressed as the harvest index in terms of reproductive allocation, so our findings are in agreement with the conclusions of Hay (Reference Hay1995) and contrasts to those by Sadras et al. (Reference Sadras, Bange and Milroy1997).
CONCLUSION
In summary, the final dry weight in all components of cotton boll is largely due to the duration of dry matter exponential accumulation, and less associated with the maximal rate of exponential accumulation. Difference among these genotypes differing in boll size and lint percentage in partitioning biomass to the bur first occurred at 10 DPA in both years (Figure 1). The genotypic difference occurred so early due to the earlier onset and termination of the bur exponential growth ranging from 5 DPA to 18 DPA (Table 5). The genotypic difference in partitioning biomass to the fibre was originally observed at 24 DPA in 2009, while in 2010 this was observed at 17 DPA (Figure 3). This is coincident with the finding that the fibre exponential growth ended prior to 30 DPA for these three genotypes investigated (Table 3). The genotypic difference emerged rather late for the seed ratio compared with the fibre ratio and the bur ratio, which was initially observed at 45 DPA in 2009 and at 31 DPA in 2010 (Figure 4). The reason is mainly that the seed exponential growth was not completed until 35 DPA in both years in the present study (Table 4). The original date of the genotypic difference observed in allocation dry matter to various fractions of the boll may be correlated with the termination date of their exponential growth. These results indicate that management practices may need to be applied to cotton plants prior to 31 DPA to ensure optimal boll size and partitioning. Large boll genotype MM-2 consistently partitioned a greater proportion of dry matter into the seed relative to two other small boll genotypes due to more developing ovules in its bolls. Because of the strong coupling that exists between the seed and the fibre growth of bolls, increased partitioning of dry matter to the seed led to a lower fibre ratio in MM-2 than in 2870 and AX.
Acknowledgements
This work was funded by the National Natural Science Foundation of China (grant no. 31060177). We would also like to acknowledge anonymous reviewers for their critical review and improvement of the manuscript.