


Introduction
Glacier surface mass balance clearly reflects climatic fluctuations and is important for the assessment of water resources and sea- level rise (Reference Huss, Bauder, Funk and HockKaser and others, 2006; Reference OhmuraOhmura and others, 2007). Mass balance has been determined within numerous glacier-monitoring programmes for several decades (Haeberli and others, 2005). Comparison of mass-balance time series originating from the direct glaciological method and the indirect geodetic method often reveals inhomogeneities (e.g. Reference Cox and MarchCox and March, 2004). Different dates of field surveys hamper the comparability of annual mass-balance quantities (Anonymous, 1969), and changing methods for data evaluation affect the consistency of the results (Reference HockHolmlund and others, 2005). Long-term mass-balance time series therefore require homogenization in order to be a valuable contribution to the understanding of ongoing climate change.
The determination of glacier surface mass balance is often performed using the direct glaciological method. A network of measurement sites is used to evaluate point balances which are extrapolated over the entire glacier area, enabling the calculation of the glacier-wide average mass balance (Reference DyurgerovDyurgerov, 2002). Only a small number of glaciers exist for which seasonal mass balances are reported, aiming at a separation of accumulation and ablation (Reference OhmuraOhmura and others, 2007). Comprehensive monitoring programmes additionally include periodical geodetic surveys of the change in glacier surface elevation based on topographic maps, photogrammetrical analysis or laser scanning, providing ice-volume changes.
The time periods used for the evaluation of annual and seasonal mass-balance quantities have a significant impact on the results – an issue rarely addressed in recent literature. Mass balance can be determined within a fixed date system or a stratigraphic system (Anonymous, 1969; Reference KrimmelMayo and others, 1972). Often a correction of inhomogeneous results caused by varying evaluation periods is difficult as, for example, the amount of melt after the late-summer field survey is not documented. A projection of annual and seasonal mass-balance quantities to the same periods is required to ensure comparability of both individual years and different glaciers.
Several studies have previously approached the re-analysis of long-term mass-balance time series. Systematic errors in point mass-balance data were detected and corrected by Reference McGlone, Mikhail and BethelMüller and Kappenberger (1991). Reference Funk, Morelli and StahelFunk and others (1997) compared different methods to calculate glacier-wide mass balance from stake data. Reference HockHolmlund and others (2005) performed a re-analysis of the seasonal time series of Storglaciären, Sweden, highlighting the importance of homogenizing mass-balance records.
In this study, we present a method for homogenizing long-term time series of comprehensive mass-balance monitoring programmes and apply it to two glaciers in Switzerland. While point mass-balance data provide a high temporal resolution and the distribution pattern of mass balance, geodetic surveys yield a wide spatial coverage of elevation change. A combination of both data sources is therefore beneficial. A daily mass-balance model calibrated annually, using all available field data, is applied to correct the time series for varying observation dates and to calculate the spatial mass-balance distribution. The time series are corrected for deviations from independent geodetic mass changes derived from high-accuracy digital elevation models (DEMs). The geodetic mass change provides a more accurate baseline for the homogenization process on decadal timescales. This central assumption is discussed in detail in the ‘Error analysis’ section.
Study Sites and Field Data
This study focuses on two glaciers in the Swiss Alps (Griesgletscher and Silvrettagletscher; Fig. 1), for which mass balance has been determined for nearly 50 years using the glaciological method. For both glaciers, exceptional datasets of point-based seasonal mass-balance measurements and geodetic ice-volume changes are available (Table 1).
Location of Griesgletscher and Silvrettagletscher in Switzerland. Triangles represent weather stations. (b, c) Mass-balance distribution of (b) Griesgletscher in 1978 and (c) Silvrettagletscher in 1972. Crosses indicate net balance stakes. (d) Percentage of ice volume (dV) and area change (dA) according to DEMs relative to 1961 (Gries) and 1959 (Silvretta). The total ice volume of the glaciers is known from radio-echo soundings (unpublished data, VAW-ETHZ).

Glacier characteristics and field data basis. Area and elevation range are based on the DEM of 2007. nb n and nb w are the total number of point net and winter balance measurements

Griesgletscher is a small alpine valley glacier situated south of the main Alpine crest. The glacier has a north-eastern exposure and has experienced dramatic retreat during the past two decades (Glaciological reports, 1960–2008). Since 1961, Griesgletscher has lost almost 40% of its ice volume (Fig. 1d). Silvrettagletscher is a small glacier in the northeastern Swiss Alps with exposure to the west. Silvrettagletscher exhibits lower rates of mass loss than other Alpine glaciers (Reference Huss and BauderHuss and others, 2008). The mass-balance distribution on the investigated glaciers is considerably influenced by local effects of exposure and snowdrift (Fig. 1b and c). Mass-balance monitoring programmes were set up on Griesgletscher in 1961 and on Silvrettagletscher in 1959, and are still operating.
In the 1970s, a network of up to 80 mass-balance stakes was maintained on Griesgletscher. A network of almost 40 stakes on Silvrettagletscher was monitored for 25 years (Fig. 2). The maximum stake density was 12 km − 2 on both glaciers. Additionally, measurements of winter accumulation exist, covering more than half of the study period in the case of Silvretta and the last 14 years for Gries (Fig. 2). Our study is based on a complete digital set of original data.
Number of point net and winter balance measurements per year.

High-accuracy DEMs are available for Gries (8 DEMs during the study period) and Silvretta (6 DEMs) in a spatial resolution of 25m (Reference Bauder, Funk and HussBauder and others, 2007). The DEMs are based on photogrammetrical evaluation of aerial photographs and provide ice-volume changes in decadal to sub-decadal periods. Volume changes are converted to mass changes assuming a density of 850 ± 50 kgm − 3 (Reference Ohmura, Bauder, Müller and KappenbergerSapiano and others, 1998).
We use time series of daily mean temperature recorded at Jungfraujoch (3580ma.s.l.; 30 km from Gries) and Davos (1590ma.s.l.; 18 km from Silvretta). Lapse rates for monthly mean air temperature were determined by considering 11 nearby weather stations (Fig. 1a) and are used to shift the temperature time series of Jungfraujoch and Davos to the mean glacier elevation. Mean monthly precipitation sums for the period 1971–90 are provided by a gridded dataset (PRISM) with a spatial resolution of 2 km (Reference Sapiano, Harrison and EchelmeyerSchwarb and others, 2001). The daily precipitation recorded at Airolo (1150ma.s.l.; 21 km from Gries) and Klosters (1200ma.s.l.; 13 km from Silvretta) is used for the downscaling of PRISM at the glacier site, providing the temporal variability in precipitation.
Methods
Determination of mass balance
For practical reasons, glacier surface mass balance is often evaluated between the dates of two successive field surveys. This evaluation period is termed ‘measurement period’ throughout this paper. In order to directly compare mass-balance quantities of individual years and different glaciers, an evaluation between fixed dates (e.g. the hydrological year) is better suited and is termed here the ‘fixed date system’. The length of the natural mass-balance year is, however, best described by the ‘stratigraphic system’ (Anonymous, 1969; Reference KrimmelMayo and others, 1972) based on annual minima and maxima of mass balance.
The mean specific surface net balance  is expressed in metres water equivalent (mw.e.) and corresponds to the annual sum of accumulation and ablation on the entire glacier divided by that year’s glacier surface area.
 is the mean specific winter balance. For each year we evaluate net and winter balance according to the three mass-balance systems with different evaluation periods.
 and
 refer to the exact dates of the field surveys, which vary between the years.
 is the net balance in the hydrological year (1 October–30 September), and the fixed date winter balance
 is determined in the period 1 October–30 April. We define the mean specific stratigraphic net balance
 as the sum of accumulation and ablation between the minima of glacier mass in two successive years.
 is the absolute maximum of snow cover in the course of 1 year.
We calculate ‘conventional’ mass balances (Reference Elsberg, Harrison, Echelmeyer and KrimmelElsberg and others, 2001), i.e. glacier extent and elevation are updated annually. An annual time series of glacier area is obtained by linearly interpolating the glacier surface geometry between successive DEMs. Using this technique, both the annual change in glacier surface elevation and the change in glacier extent are estimated and step changes in the glacier geometry are avoided (Reference Huss and BauderHuss and others, 2008).
Mass-balance model
The homogenization procedure is performed using a distributed accumulation and temperature-index melt model (Reference Haeberli, Zemp, Frauenfelder, Hoelzle and KääbHock, 1999; Reference Huss and BauderHuss and others, 2008). This mass-balance model is not regarded as a physical model, but as a tool to resolve annual and seasonal mass-balance measurements on a daily timescale and to perform the spatial inter- and extrapolation of sparse data points based on a consistent algorithm, taking into account the principal factors of mass-balance distribution.
Temperature-index models are based on a linear relation between positive air temperature and melt rate (Reference Müller and KappenbergerOhmura, 2001). In the applied model, degree-day factors are varied as a function of potential direct radiation in order to account for the effects of slope, aspect and shading. Daily surface melt rates M are computed for each cell of the DEM:

where f M denotes a melt factor, r ice / snow are radiation factors for ice and snow surfaces and I is the potential solar radiation. Air temperature T at every gridcell is determined by a constant lapse rate dT/dz. Parameter values and units are given in Table 2.
Mean values of model parameters and units
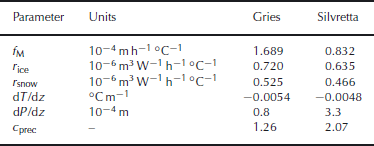
Precipitation is assumed to increase linearly with elevation (dP/dz). A correction factor c prec allows the adjustment of precipitation sums, and a threshold temperature T thr = 1.5 ˚ C distinguishes snow from rainfall (Reference Haeberli, Zemp, Frauenfelder, Hoelzle and KääbHock, 1999). The spatial variation of accumulation on the glacier surface is substantially influenced by snowdrift. The measurements of net balance carried out in high spatial resolution until 1984 (Fig. 2) provide detailed information on distribution patterns (Fig. 1b and c).
In order to parameterize snow redistribution by wind drift, we determine a spatial accumulation anomaly A acc which is calculated for all years with a dense coverage of stakes (>6km − 2) as follows. (1) Point net balance is interpolated spatially using an inverse distance technique. (2) A linear mass-balance gradient and an equilibrium-line altitude are determined from the result: the most simple mass-balance distribution. (3) By subtracting the mass balance given by this linear trend with elevation from the interpolated value of mass balance at every gridcell, an offset is obtained. We consider these offsets to be measures of anomalous snow deposition and convert them into dimensionless quantities by normalizing the grid.
This accumulation anomaly grid A acc provides percental solid precipitation deviations from the expected value and is applied to all snowfall events. A factor f anom is used to scale the amplitude of A acc. In years with low spatial coverage of stakes (<6km − 2), we use the average anomaly pattern of all years for which mass-balance distribution is well constrained with field data. The anomaly maps show significant year-to-year variability, but also reveal constant features, which can be explained by preferential wind erosion of snow in convex topography and redeposition in lee-side depressions. The model precipitation P mod xy at the location (x, y) is calculated as

where Pxy is the measured precipitation extrapolated to the gridcell using dP/dz, c prec the precipitation correction factor, A acc the accumulation anomaly and f anom the scaling factor.
Ablation due to geothermal heat flux, internal deformation and basal friction are insignificant components of glacier mass balance in the Alps and are accounted for in the model. Based on simple considerations, we estimate the contribution of these processes to mass balance as –0.01mw.e. a − 1. Griesgletscher exhibited non-negligible mass loss due to calving into a proglacial lake until the mid-1980s. Annual calving rates are well documented (Glaciological reports, 1960–2008) and were subtracted from the calculated surface mass balance.
Time-series homogenization
The homogenization procedure is divided into two steps (Fig. 3): (1) tuning the model to the point mass-balance data and (2) correcting the results obtained in (1) using independent geodetic mass changes. Basically, step (1) represents the direct glaciological method with a model used for temporal downscaling and for determining the spatial distribution of mass balance. In step (2), the mean specific mass balance is fitted to the geodetic mass change, which is assumed to have a higher accuracy. The measurements of point mass balance are the best indicator of the local meteorological conditions on the glacier (Reference Holmlund, Jansson and PetterssonHuss and Bauder, 2008). Daily temperature and precipitation from a nearby weather station serve to resolve the seasonal data at a daily scale. As the model is tuned to the field data for every individual year, the fluctuations in seasonal mass balance are given by the in situ measurements and not by the meteorological conditions at weather stations.
Homogenization procedure. The daily model is tuned annually to match the seasonal point mass balances optimally (step (1)). If necessary, the misfit with geodetic volume changes is corrected by adjusting the parameter c prec (step (2)).

First, the accumulation parameters of the mass-balance model are calibrated using the measurements of winter balance. c prec and dP/dz are tuned so that the calculated snow water equivalent at the winter survey date matches the measured value (Fig. 3). If no winter balance data are available, c prec has the average value of all years with winter measurements and dP/dz is set to values found for the investigated glaciers by Reference Huss and BauderHuss and others (2008).
The calibration of the melt parameters f M and r ice,snow (Equation (1)) is performed annually using the measurements of point net balance. Mass balance calculated between the exact dates of the late-summer field surveys in two successive years is tuned to the field data. The parameters are varied systematically in order to obtain (i) an average difference of field data and calculation equal to zero and (ii) a minimization of the root-mean-square error (rmsed) of measurement and model (Fig. 3). Using f anom, the accumulation anomaly is scaled such that rmsed is minimized. The use of the anomaly significantly improves the performance of the model to capture the spatial variation in net balance; rmsed is reduced by 20% compared to model runs excluding this component.
The aerial photographs used for DEM production were acquired between mid-August and the end of September; the exact dates are known. All geodetic mass changes were corrected for melt or accumulation occurring between the acquisition date and the end of the hydrological year using the mass-balance model. The mean specific corrections applied are smaller than ±0.5mw.e. They are therefore important over short intervals between successive DEMs and almost negligible over longer periods.
In the second homogenization step, the resulting time series are compared to the density- and date-corrected ice-volume changes. In the ideal case, the cumulative direct mass balance coincides with the geodetic mass change. If not, the mass balances calculated in step (1) are corrected (Fig. 3). The difference between the cumulative mass balance and the geodetic mass change in a period given by two successive DEMs is distributed evenly over the years. When doing so, a misfit with the point mass-balance data in each year of the period has to be accepted. The parameters obtained in step (1) are updated in order to yield the corrected cumulative mass balance matching the geodetic mass changes. This is achieved by adjusting the correction factor for precipitation c prec and keeping all other parameters constant. c prec was chosen for this purpose, because a relatively high uncertainty is attributed to the measurement and the modelling of high-mountain precipitation. A change in the total precipitation also affects the ablation area and distributes the increased misfit with the stakes across the glacier without significantly changing the previously determined mass-balance distribution.
Results
The differences between measured and calculated point net balances cluster in a Gaussian-shaped distribution (Fig. 4). In the case of Silvrettagletscher, there is a systematic negative misfit of –0.07mw.e. because in step (2) of the homogenization process, a significant correction was required. Seventy per cent of the stake measurements can be reproduced within ±0.36mw.e. (Gries) and ±0.32mw.e. (Silvretta).
Distribution of differences Δb n of measured and calculated point net balance for (a) Griesgletscher and (b) Silvrettagletscher. The shaded bar corresponds to ±1 standard deviation (containing 70% of the data points).

The homogenization procedure provides daily time series of mean specific mass balance (Fig. 5). These allow us to visualize the characteristics of the mass-balance year (e.g. the occurrence of summer snowfall events (Fig. 5b) or melt after the late-summer field survey (Fig. 5c)). In individual years, the mass-balance quantities can differ considerably due to the choice of the evaluation period.
Cumulative daily area-averaged mass balances of Silvrettagletscher for selected years: (a) 1967, (b) 2006 and (c) 2007. Bars and vertical lines visualize the length of the different evaluation periods.

Since 1982, mean specific net balances have been predominantly negative, in particular during 2002/03 (Fig. 6a). Net balance values corresponding to different evaluation periods mostly have the same sign, but often differ significantly. The homogenized time series refer to the same periods and therefore allow comparison of both individual years and different glaciers. When considering cumulative net balances, the differences due to the choice of the evaluation period cancel out.
Homogenized mass-balance time series of Silvrettagletscher during 1959–2007. Mean specific (a) net balances and (b) winter balances in the fixed date system (solid line), the measurement period and the stratigraphic system (shaded bars).

The homogenized mass-balance time series are compared to the previously reported values (Glaciological reports, 1960–2008; Haeberli and others, 2005), which have been determined based on the traditional glaciological method. In the case of Griesgletscher, the homogenized mass balances agree well with the published data (Fig. 7b). The mass loss according to this study is slightly larger. However, a significant bias is found for Silvrettagletscher from 1994 until 2007 (Fig. 7a). Whereas the cumulative mass loss was –3.1mw.e. according to the previous evaluation, the homogenized time series yields –8.0mw.e. in the same period, resulting in a net balance bias of +0.37mw.e. a − 1.
Cumulative mass-balance time series of (a) Silvrettagletscher and (b) Griesgletscher. Note that the scales are the same. Error bars indicate the uncertainty of each DEM (triangles). The averaged annual course of mass-balance quantities for Griesgletscher in 1961–2007 is displayed in the inset in (b).

In order to find additional evidence for the bias in the Silvretta time series, we compared it to that of Jamtalferner (3.7 km2), Austria, located at a distance of 7 km away (Haeberli and others, 2005). From 1994, the non-homogenized net balance of Silvrettagletscher is on average +0.54mw.e. a − 1 more positive compared to Jamtalferner. This indicates that the correction towards higher mass losses performed within the homogenization is also supported by a nearby mass-balance record.
The method presented allows us to separate accumulation and ablation (inset in Fig. 7b). It is often assumed that winter and summer balance are a good approximation of the total annual accumulation  and the total annual ablation
 (Reference Dyurgerov and MeierDyurgerov and Meier, 1999). The values contained in Table 3 show that this assumption is hampered by non-negligible amounts of accumulation during summer and ablation during winter. The evaluation of mass balance according to the stratigraphic system leads to closer agreement of and with winter and summer balance (Table 3). For Silvrettagletscher, summer accumulation is a more important term than for Griesgletscher. On average, 13 summer snowfall events per year (during June–September) with >0.01mw.e. accumulation occurred on Silvretta, compared to only 6 events per year on Gries. This may have contributed to the more moderate retreat of Silvrettagletscher during the study period (Fig. 7) due to an albedo feedback effect. The winter maximum of glacier mass is reached 10 days later on Silvretta than on Gries, indicating a shorter ablation period (Table 3).
Comparison of fixed date and stratigraphic winter and summer balances averaged over the entire study period to mean annual totals of accumulation and ablation in the hydrological year. Numbers in parentheses give the percentage of the analysed variable compared to  and
 respectively

We investigate the differences in net and winter balances evaluated according to the fixed date system, the measurement period and the stratigraphic system for all years analysed and both glaciers. For 50% of the years the difference is within ±0.1mw.e. (Fig. 8a) and, therefore, almost negligible, but this range is exceeded in the other years. Net balance determined in the measurement period may deviate by more than ±0.5mw.e. from that in the hydrological year. Note that over decadal periods the differences in net balance cancel out. Fixed date winter balance systematically underestimates the winter maximum of glacier mass (Fig. 8b); the stratigraphic winter balance is 0.26mw.e. higher on average. Nevertheless, 30 April is proposed as the termination of the fixed date winter balance, as melt starts to be important around this date (inset in Fig. 7b).
Comparison of mean specific (a) net balance and (b) winter balance according to different evaluation periods using box plots. All years analysed for both glaciers are included. The box ranges from the 25%-quantile to the 75%-quantile; the thick horizontal line represents the median. Vertical bars include 95% of the data points, and outliers are marked with crosses. For each box plot, the standard deviation σ is given in mw.e.

Error Analysis
Several studies have estimated the uncertainty in the determination of mass balance using the direct glaciological method as ±0.2mw.e. a − 1 (Reference DyurgerovDyurgerov, 2002). We identify five sources of errors contributing to the uncertainty in mean specific net balance.
1. Uncertainty in the net balance determination at individual stakes arises due to reading and reporting errors, uncertain snow or firn density, melt-in of the stake, compaction of the firn layer or refreezing of meltwater (Reference McGlone, Mikhail and BethelMüller and Kappenberger, 1991). It is estimated as σ stake = ±0.1mw.e. in the ablation area and σ stake =±0.3mw.e. in the accumulation area.
2. Mass-balance often varies significantly on small spatial scales (a few metres) due to ice surface roughness or differential accumulation due to snowdrift. A point measurement may therefore poorly represent its closest vicinity. In order to quantify this effect, we scanned the datasets of both glaciers for measurements in the same year with distances of <50m from each other and elevation differences of <5m. We found standard deviations σ local=±0.30mw.e. (Silvretta, n=44) and σ local =±0.54mw.e. (Gries, n=67) of net balance at neighbouring stakes.
3. Determining glacier-wide mass balance from point data induces considerable uncertainty, which is difficult to estimate. Errors are due to: (i) a non-representative distribution of stakes over the glacier surface; (ii) insufficient spatial density; and (iii) inter- and extrapolation to unmeasured areas. We assessed the uncertainty due to these factors by computing and comparing mean specific net balance obtained with randomly reduced annual stake datasets and found σ int =±0.12mw.e.
4. The effect of inaccurate glacier surface areas used for the mass-balance calculation (Reference Elsberg, Harrison, Echelmeyer and KrimmelElsberg and others, 2001) was evaluated by comparing net balances referring to annually updated glacier areas or to the last DEM available. The uncertainty is small for both glaciers due to a high temporal coverage of the geodetic surveys (σ area =±0.03mw.e.).
5. The evaluation of net balance in a measurement period system leads to variations of σ period =±0.2mw.e. relative to a fixed date system (Fig. 8a).
Only some of these significant uncertainties in the determination of mass balance based on the direct glaciological method can be addressed in the homogenization process. Errors in individual stake measurements are difficult to detect and remain in the dataset used for the re-analysis. Some obviously implausible data points were discarded (about 1%). Snow density is missing in some years and is assumed to correspond to the mean of all years with available data. The re-analysis cannot account for error source (2) as no information on the small-scale variability in mass balance is available. We address (3) by applying a mass-balance model that accounts for the effects of aspect and wind drift and is assumed to reproduce the spatial pattern of mass balance more accurately than common interpolation algorithms. By annually updating the glacier surface area, the errors due to (4) are corrected and the daily model accounts for varying evaluation periods (5).
We conservatively assume that σ local includes the uncertainty in the stake measurements σ stake and compute the annual uncertainty in the calculated mean specific net balance based on direct observations as

As annual mass-balance data are independent of each other (Reference Cogley and AdamsCogley and Adams, 1998), the uncertainty in an n year record is  and ranges from 0.09 to 0.28 mw.e. a
−
1 (Table 4).
Error analysis for direct and geodetic mass balances in all DEM sub-periods of Griesgletscher (G) and Silvrettagletscher (S).  is the mean geodetic elevation change and σz
the related uncertainty due to DEM evaluation. σ
geod is the total annual uncertainty due to errors in the geodetic mass change. σ
sample is the uncertainty in the direct glaciological method.
 is the mean annual misfit of dir measured point net balances required to match geodetic mass change

The uncertainty in the geodetic method is given by four principal error sources.
1. The orientation and the geolocation of the individual aerial photographs is the most important. An error of ±0.2–0.5m is estimated by comparing photogrammetric measurements with 10–20 georeferenced ground-control points.
2. The elevation information for single points can be retrieved with an accuracy of ±0.1m in the ablation zone and ±0.3m in the area of low contrast (Reference Mayo, Meier and TangbornMcGlone and others, 2004). As this error is randomly distributed, its contribution to the total uncertainty is reduced to ±0.01m (Reference Schwarb, Daly, Frei and SchärThibert and others, 2008).
3. The interpolation to unmeasured gridpoints induces an uncertainty of ±0.05–0.5m depending on the spatial coverage of the photogrammetrical analysis and the complexity of the terrain (Reference Bauder, Funk and HussBauder and others, 2007).
4. A considerable uncertainty of ±6% (Reference Ohmura, Bauder, Müller and KappenbergerSapiano and others, 1998) arises due to the unknown density for the conversion of the change in ice or firn volume to a mass change (Reference Kaser, Cogley, Dyurgerov, Meier and OhmuraKrimmel, 1999). Sorge’s law (Reference BaderBader, 1954), which assumes a constant density profile in the accumulation area, may not be valid during periods of growing or decreasing firn thickness. The density used for the conversion would therefore have to be adapted according to the changes in the depth–density profiles, which are unavailable during the study period.
Error sources (1)–(3) depend on the quality of the DEM production and (4) is proportional to the magnitude of the volume change. Our homogenization procedure distributes the misfit of glaciological cumulative mass balance and geodetic mass change in each sub-period evenly over the years in the time interval Δt between two successive DEMs. It is therefore possible to calculate the uncertainty σ geod in the homogenized annual mass-balance results due to errors in the geodetic mass change with is the related uncertainty depending on the accuracy of both DEMs (Table 4).

where ρ = 850 kgm
−
3 is the density used to convert ice volume to mass change and σρ
= 50 kgm
−
3 is the related uncertainty. is the mean geodetic elevation change and

The error analysis shows that the uncertainty σ geod due to errors in the geodetic mass change is significantly lower in all sub-periods than the uncertainty in the direct glaciological method σ sample dir (Table 4). Furthermore, there is a potential for additional systematic errors which are difficult to detect in the direct glaciological method. Examples include substantial melt-in of stakes in the accumulation area (resulting in too positive mass balance) or locally high accumulation rates due to avalanche deposits. The geodetic method, in contrast, allows a thorough analysis of all its uncertainties, which is a major advantage. For these reasons, the use of geodetic mass changes is considered to be the best data source for detecting biases and homogenizing long-term mass-balance time series.
In most DEM sub-periods, cumulative mass balances obtained using the direct glaciological method correspond reasonably well to the geodetic mass changes (Fig. 7).

is the mean annual misfit of net balances b stake n measured at m stakes required to match the homogenized point net balances b hom n that agree with the geodetic mass change. In general, is in the range of both σ sample dir and σ geod; there is no bias and the methods agree well (Table 4). From 1994 until 2007, however, the mass balance of Silvrettagletscher determined by the glaciological method is significantly too positive and needs to be corrected. We can only speculate about the reasons for this bias and attribute it to errors in accumulation measurements and a non-representative distribution of the stakes. The uncertainty in the final homogenized mean specific mass-balance time series is equivalent to σ geod (Table 4).
Conclusion
We presented a method for homogenizing time series of long-term mass-balance monitoring programmes. A distributed mass-balance model is used to resolve annual and seasonal mass-balance measurements at a daily scale and to calculate spatial mass-balance variations based on point measurements. The time series are corrected in order to match the independently determined density- and date-corrected ice-volume changes. Mass-balance data with different characteristics are combined. Stake measurements provide high temporal resolution and altitudinal mass-balance distribution, but have incomplete spatial coverage. The geodetic data cover the entire glacier, but do not yield information on interannual variability.
Our method allows us to address the problem of varying evaluation periods, which have a significant impact on annual results and tend to blur the natural variability in mass balance. We derive homogenized and complete time series of seasonal mass balance of two alpine glaciers for fixed time periods and provide a comparable data basis for climate-impact studies.
Geodetic mass changes are assumed to be most appropriate for detecting biases in the direct glaciological method and are an indispensable prerequisite for a thorough homogenization of long-term mass-balance time series. Re-analysis requires a variety of meta-information (dates of the field surveys, location of the measured stakes, etc.), which was often not systematically reported in the past. We strongly suggest gathering all information available and documenting not only final mass-balance results, but also raw data. The homogenization procedure presented is recommended in comprehensive mass-balance monitoring programmes of alpine glaciers for re-analysis of the previous data series, and as a tool for current evaluation of the glacier-wide mass balance.
Acknowledgements
This work is supported by ETH Research Grant TH-17 06-1. The weather data were recorded by MeteoSwiss. The effort of previous researchers measuring mass balance is gratefully acknowledged. Swisstopo was responsible for the aerial photograph surveys. H. Bösch established DEMs from aerial photographs. R. Hock provided an important contribution to the development of the mass-balance model. We thank the scientific editor A.G. Fountain, an anonymous reviewer and J.G. Cogley for helpful comments that improved the clarity of the paper.



