Implications
Fumaric acid (FA) is a potential methane (CH4) reducer. Supplementation of the diet of fattening bulls with a strong acid such as FA could have consequences for the animal, especially for the rumen. To preserve animal health, possible side effects, like an influence and interaction with the roughage fed to the bulls, should be investigated in a long-term study. The organ weights, and mainly the rumen mucosa may give information about the long-term effects of FA.
Introduction
For cattle the loss of energy as a result of erupted CH4 is estimated to be between 6% and 8% of gross energy (Flachowsky and Brade, Reference Flachowsky and Brade2007). Possible nutritional strategies for mitigation of enteric CH4 production are the increase of concentrate proportion in the diet, the supplementation of dietary lipids or different feed additives to the ration (Flachowsky et al., Reference Flachowsky, von Soosten and Meyer2015). Propionic acid precursors have often been discussed as reducers of CH4 from ruminal fermentation. In vitro studies show that FA is one of the most effective acids to reduce CH4 emissions (Callaway and Martin, Reference Callaway and Martin1996; Martin, Reference Martin1998). Fumaric acid is a key intermediate in the succinate-propionate pathway, an alternative electron sink reaction for CH4 production (Martin, Reference Martin1998). However, studies with growing Holstein steers or Angus heifers by McGinn et al. (Reference McGinn, Beauchemin, Coates and Colombatto2004) and Beauchemin and McGinn (Reference Beauchemin and McGinn2006) showed no effect of FA on CH4 losses. Few studies have investigated the influence of organic acid supplementation on animal productivity (Kolver and Aspin, Reference Kolver and Aspin2006), and not much is known about the consequences for animal health (Castillo et al., Reference Castillo, Benedito, Pereira, Vazquez, Alonso, Mendez and Hernandez2007). Especially the effects of supplementing a strong acid to the acid–base ratio of the animals (FA: pka=3.03; Engel et al., Reference Engel, Straathof, Zijlmans, van Gulik and van der Wielen2008) are not yet well understood. Strong acidity has been discussed (Wood et al., Reference Wood, Wallace, Rowe, Price, Yanez-Ruiz, Murray and Newbold2009) as one reason for ruminal acidosis in cattle. The rumen is a complex ecosystem which developed over a long period of time (Hungate, Reference Hungate1966). Manipulations, like feeding FA, might destabilize this ecosystem. In a review, Gäbel and Sehested (Reference Gäbel and Sehested1997) pointed out that 66% to 95% of short-chain fatty acids (SCFA) are absorbed by the rumen papillae. Supplementation with FA might lead to a change in the SCFA profile. It is known that propionic and butyric acid stimulate the growth of rumen villi, enlarging the absorption surface for ruminants (Mach et al., Reference Mach, Devant and Bach2005). Histological lesions in the rumen wall are, among other indications, one sign of acidosis (Owens et al., Reference Owens, Secrist, Hill and Gill1998). The amount of non-fibre carbohydrates (NFC) in the ration also influences the growth of the rumen villi (Mach et al., Reference Mach, Devant and Bach2006). Furthermore, it is known that CH4 production is higher after feeding fibre-rich roughage (Flachowsky and Brade, Reference Flachowsky and Brade2007), with a consequently larger reduction potential. Therefore, the present study was conducted with low-fibre roughage (maize silage) as well as with high-fibre (grass silage) carbohydrate roughage. Very little literature is available on investigations with FA supplementation to ruminants over a long period of time.
A growth experiment with fattening bulls was carried out to address the interactions between silage type and FA supplementation. Although performance data were recently reported in Remling et al. (Reference Remling, Hachenberg, Meyer, Höltershinken, Flachowsky and Dänicke2011), the present study aimed to evaluate the effect of FA and forage type on rumen microbial community and fermentation parameters, histopathological and histomorphometrical features of the rumen wall, and organ and tissue weights.
Material and methods
Experimental design
In all, 20 out of a total of 62 fattening bulls of a growth experiment examining the interactions between silage type and FA addition (Remling et al., Reference Remling, Hachenberg, Meyer, Höltershinken, Flachowsky and Dänicke2011) were used for the present study. These 20 growing bulls (German Holstein breed) represented the average (live weight basis) of four different feeding groups with five animals per treatment: maize silage without (M0) or with 300 g FA per day (M300) and grass silage without (G0) or with 300 g FA per day (G300). The average initial BW was 279±38 kg (age: 232±24 days).
Experimental details were recently presented by Remling et al. (Reference Remling, Hachenberg, Meyer, Höltershinken, Flachowsky and Dänicke2011). In brief, 62 animals were housed in groups of seven or eight animals in a barn located at the Experimental Station of the Institute of Animal Nutrition, Friedrich-Loeffler-Institute, Federal Research Institute of Animal Health in Braunschweig, Germany. The barn was equipped with slatted floors with concrete and rubber surfaces (5.25 m2/animal).
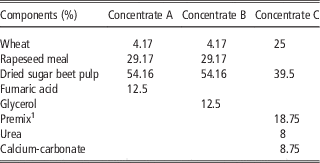
The animals were marked with ear transponders (Insentec, Marknesse, The Netherlands) to determine daily feed and water intake. The bulls had access to 2.8 kg of concentrate containing 300 g FA (feed grade 99%; Novus Deutschland GmbH, Gudensberg, Germany) per day or 300 g glycerol (GLY: Concerine CD 80 Feed Grade; ADM Silo Rothensee GmbH & Co. KG, Magdeburg, Germany) per day as isocaloric compensation. In addition, all animals received 0.4 kg of a concentrate containing a mineral supplement (see Table 1). Roughage and water were available for ad libitum consumption. The animals were supplied with energy and minerals according to the recommendations of the Society of Nutrition Physiology (GfE, 1995). The composition of the different concentrates is shown in Table 2. Water, roughage and concentrates were provided separately via feeding stations (Type RIC and Type AWS HF 2ST; Insentec). The animals were slaughtered in the slaughterhouse of the institute at a mean BW of about 580 kg.
Experimental design with the eight different feeding groups and their allowance of daily concentrate intake

M=maize silage; G=grass silage.
1 Concentrate A=contained the supplemented fumaric acid.
2 Concentrate B=contained the supplemented glycerol.
3 Concentrate C=contained a vitamin/mineral premix.
Composition of the three different concentrates

1 per kg premix: Ca, 250 g; P, 40 g; Na, 85 g; Mg, 35 g; vitamin A, 560 000 IU; vitamin D3, 70 000 IU vitamin E, 1050 mg; Mn, 3000 mg; Zn, 5000 mg; Cu, 700 mg; I, 50 mg; Co, 25 mg; Se, 25 mg.
Slaughtering and sampling
The animals had access to feed until slaughtering when five animals of each group were slaughtered in the institute’s slaughterhouse. The carcasses, the viscera (full and empty; except liver and spleen), the different fat regions and the organs were weighed separately. Blood samples were collected during the slaughter process from a vena jugularis by using serum tubes. After centrifugation (3.0R, 200×g, 15°C, 15 min, Heraeus Varifuge, Heraeus GmbH, Osterode, Germany), serum was stored at −80°C until analysis of β-hydroxybutyric acid (BHB), non-esterified fatty acid (NEFA) and glucose. Rumen fluid was collected directly after opening the rumen to analyse SCFA and ammonia-N (NH3-N). Samples were centrifuged (2400×g, 5 min, Beckman J2-HS; Beckman Coulter Inc., Brea, CA, USA) and 1 ml of sulfuric acid (25) was added to 10 ml of the supernatant. This supernatant was centrifuged again (2700×g, 20 min, Eppendorf Centrifuge 5417 R; Eppendorf AG, Hamburg, Germany). One drop of mercuric chloride was added and the samples were stored at −20°C until SCFA analysis. A total of 100 ml of rumen fluid was immediately frozen at −18°C for single strand conformation polymorphism (SSCP) analysis of the microbial community. For the morphological and histological examinations, two pieces of about 5×8 cm of the rumen mucosa wall were excised from the caudal ventral ruminal sac as according to Zitnan et al. (Reference Zitnan, Kuhla, Nurnberg, Schonhusen, Ceresnakova, Sommer, Baran, Greserova and Voigt2003) and one part from the pilae ruminis. The mucosa was washed with 0.9% NaCl solution and then clamped in a plastic frame and fixed in a 4% formaldehyde solution.
Analyses
Glucose, BHB and NEFA in blood serum were analysed photometrically (Eurolyser CCA 180 VET; Greiner Diagnostik GmbH, Bahlingen, Germany). A gas chromatograph equipped with a flame ionization detector was used to analyse the SCFA of the ruminal fluid (Geissler et al., Reference Geissler, Hoffmann and Hickel1976). Ammonia-N in rumen fluid was analysed according to DIN38406-E5-2 (1998).
The samples of rumen fluid were prepared as described recently by Remling et al. (Reference Remling, Riede, Lebzien, Meyer, Höltershinken, Kersten, Breves, Flachowsky and Dänicke2013) and Riede et al. (Reference Riede, Boguhn and Breves2013) to analyse the microbial community by means of SSCP analysis. In brief, genomic DNA was extracted and the 16S rDNA was amplified with PCR. Polyacrylamide gel electrophoresis was conducted after single strand digestion. The results of the SSCP were visualized via silver staining (Riede et al., Reference Riede, Boguhn and Breves2013).
The rumen mucosa was histopathologically examined for inflammation. We observed infiltrates with neutrophilic granulocytes with fewer macrophages, plasma cells and lymphocytes. Results were graded as follows: 0=‘no visible lesions’, 1=‘few inflammatory infiltrates’, 2=‘some inflammatory infiltrates’, 3=‘several inflammatory infiltrates’. The number of centres of inflammation (COI) per 10 fields (10× magnification) was enumerated on both the villous area at the caudal ventral ruminal sac and the villi-free area on the pilae ruminis. From the villous area of the ruminal sac, three parts of 1 cm2 each were cut out. Each villus was dissected directly from the mucosa and then transferred with a scale to white paper and photographed. The photographs were analysed with the program ImageJ (Version 1.45s; National Institutes of Health, Bethesda, MD, USA). The length, width and surface (two dimensional) of the villi were measured and the number of villi per cm2 was counted.
Calculations and statistics
The size of the rumen villi was calculated by measuring the pixel density on the photographs which had been converted to values in mm with the help of the scale. The surface of the whole rumen villi was measured with the tracing tool of ImageJ. The measured cm2 of the surface were doubled due to the fact that the photographs present only one dimension of the villi as described by Hofmann and Schnorr (Reference Hofmann and Schnorr1982). To calculate the villous surface per cm2 rumen mucosa wall, the surfaces of the individual villi were multiplied with their number.
All statistics (except for SSCP analysis) were performed with Statistica 8.0 for Windows operating system (1984–2007; StatSoft Inc., Tulsa, OK, USA). A two-way factorial design of the ANOVA was used with the different silages and the FA supplementation as factors (except rumen papillae histopathological examination). A Tukey test was conducted as post hoc test. The histology was evaluated with a contingence table which is based on the comparison between absolute frequencies for the particular classes with the expected frequencies and Pearson’s χ 2 test. For the statistical analysis of the SSCP, air-dried gels were scanned (ScanMaker i800; Mikrotek, Willich, Germany) and SSCP band patterns of digitalized images were compared using the software GelCompar II (Applied Maths, Sint-Martens-Latem, Belgium). Cluster analyses were performed with dendrograms based on similarity matrices calculated using the Pearson product–moment correlation coefficient. The clustering algorithm was an unweighted pair group method using arithmetic mean (UPGMA). Statistical analysis was carried out using dissimilarity matrices following the method of Anderson (Reference Anderson2001). All statistical significances were designated when P<0.05 and trends with P<0.1.
Results
The dry matter intake (DMI) during the trial was 9.10±0.3 kg for the M0 group, 8.86±0.2 for the M300 group, 8.68±0.2 kg for the G0 group and 8.58±0.1 for the G300 group. Differences were not observed between the groups.
Weights of the carcasses
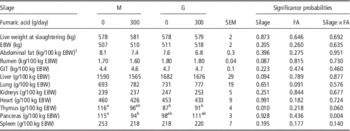
The weights of the different empty organs are given in Table 3. The 20 animals were slaughtered with a mean final BW of 579±2 kg (mean±SEM), as described by Remling et al. (Reference Remling, Hachenberg, Meyer, Höltershinken, Flachowsky and Dänicke2011). The FA did not affect the carcass composition and organ weights. Neither the silage type nor the FA supplementation influenced the empty BWs or the abdominal fat (Table 3). Effects were only found on the thymus and pancreas weights. Thymus weights increased (P=0.01) with maize silage. An interaction of FA and silage was found for the pancreas weight (P=0.004). Fumaric acid supplementation fed with maize silage decreased pancreas weight and increased it with grass silage.
Effects of fumaric acid (FA) supplementation (0 or 300 g/animal per day) and roughage type (maize silage (M), grass silage (G)) on carcass composition and organ weights (means; n=5)

EBW=empty BW (difference between live weight and the weights of the contents of the GIT and the urinary bladder); GIT=gastrointestinal tract.
a,bValues within a row with different superscripts differ significantly at P<0.05.
1 Sum of the fat of the kidney cavity and the fat covering the GIT.
Blood
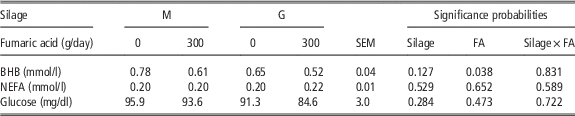
BHB, NEFA and glucose concentrations in blood serum are shown in Table 4. The BHB values decreased significantly in response to FA supplementation (P<0.05). Fumaric acid supplementation and type of silage did not influence serum glucose concentrations.
Effects of fumaric acid (FA) supplementation (0 or 300 g/animal per day) and roughage type (maize silage (M), grass silage (G)) on β-hydroxybutyric acid (BHB), non-esterified fatty acid (NEFA) and glucose in serum (means; n=5)

Rumen fluid
Short-chain fatty acids and Ammonia-N
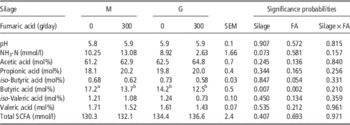
The concentrations of ruminal SCFA and NH3-N are shown in Table 5. A trend (P=0.073) was found for lower NH3-N concentration in the grass silage groups. The percentage of butyric acid decreased in the FA supplementation group (P<0.01) and was higher for the animals-fed maize silage (P=0.007). The highest percentage of butyric acid was found in group M0 compared with all other groups. There were no interactions between silage and FA for all determined SCFA concentrations and NH3-N concentrations in rumen fluid.
Effects of fumaric acid (FA) supplementation (0 or 300 g/animal per day) and roughage type (maize silage (M), grass silage (G)) on ammonia-N (NH3-N) and short-chain fatty acids (SCFA) concentrations and percentage of rumen fluid of the slaughtered animals (means; n=5)

a,bValues within a row with different superscripts differ significantly at P<0.05.
Single strand conformation polymorphism
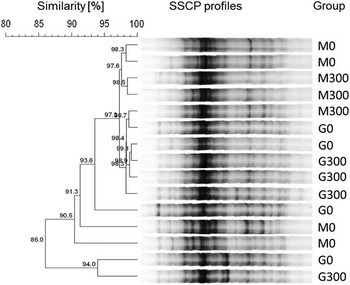
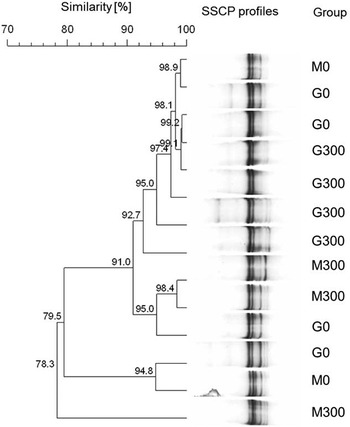
Bacteria profiles were not affected by FA supplementation (P=0.239; Figure 1). However, an effect of the silage type was detected on the microbial community (P=0.011). No interaction was observed between FA and silage type (P=0.802). Regarding archaea, neither the FA supplementation (P=0.645) nor the silage type (P=0.410) had a significant influence on the microbial community (Figure 2). No interaction between FA and silage type was observed for archaea (P=0.533).
Effects of fumaric acid supplementation (0 or 300 g/animal per day) and roughage type (maize silage (M), grass silage (G)) on the community of bacteria (dendrogram for the results of single strand conformation polymorphism (SSCP) analysis). Given are the similarities between the individual animals.

Effects of fumaric acid supplementation (0 or 300 g/animal per d) and roughage type (maize silage (M), grass silage (G)) on the community of archaea (dendrogram for the results of single strand conformation polymorphism (SSCP) analysis). Given are the similarities between the individual animals.

Rumen papillae
Histopathology
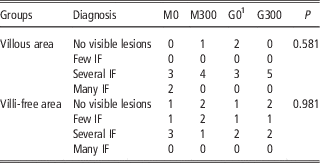
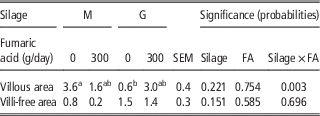
The results of the histopathological examination of the rumen mucosa are shown in Table 6. Different feeds did not influence the integrity of the rumen mucosa. Nor was the count of COI in the samples of villi-free area influenced by FA or by silage supplementation. An interaction between FA and silage type was found in the villous area of the rumen mucosa (Table 7). The maize-fed animals showed a higher villous area without FA, whereas the grass-fed animals showed the opposite result.
Effects of fumaric acid (FA) supplementation (0 or 300 g/animal per day) and roughage type (maize silage (M), grass silage (G)) on pathohistology from rumen papillae (frequency; n=5)

IF=inflammatory infiltrates.
1 G0 villi-free area with n=4.
P=probability of Pearson’s χ 2
Effects of fumaric acid (FA) supplementation (0 or 300 g/animal per day) and roughage type (maize silage (M), grass silage (G)) on the count of centres of inflammation (per 10 counted fields) of rumen papillae (means; n=5)

a,bValues within a row with different superscripts differ significantly at P<0.05.
Villi number and size
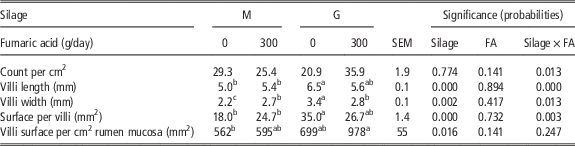
An interaction of silage type and FA was found for all measured parameters except the villi surface per cm2 mucosa (P<0.05, Table 8). The maize-fed animals had bigger villi due to FA supplementation, in contrast to the grass silage-fed animals where villi were smaller.
Effects of fumaric acid (FA) supplementation (0 or 300 g/animal per day) and roughage type (maize silage (M), grass silage (G)) on rumen villi count, growth and surface (means; n=5)

a,b,cValues within a row with different superscripts differ significantly at P<0.05.
Discussion
The objective of the current study was to investigate the influence of a long-term supplementation of FA on the organ weights of bulls with special attention to the rumen, its mucosa and the composition of rumen fluid. Data on fattening performance and the acid–base balance of the animals were reported elsewhere (Remling et al., Reference Remling, Hachenberg, Meyer, Höltershinken, Flachowsky and Dänicke2011). Altogether, feeding 35 g FA per kg DMI for about 222 days did not result in a rumen or metabolic acidosis (Remling et al., Reference Remling, Hachenberg, Meyer, Höltershinken, Flachowsky and Dänicke2011). The absence of differences between pH values in rumen fluid and the occurrence of chronic claw inflammation in only the G0 groups support this observation. The individual organ weights can provide information on animal metabolism and energy balance (Fitzsimons et al., Reference Fitzsimons, Kenny and McGee2014). For instance, here, the weight of the empty rumen tended to be higher for the grass-fed animals (Table 3). In the present study, the bulls were fed according to feeding recommendations by the GfE (1995) and the difference in daily crude protein intake of the complete ration between grass- and maize-fed animals was significant, but not prominent (M0: 980 g/day; M300: 980 g/day; G0: 983 g/day; G300: 987 g/day per animal CP intake; P<0.001). Therefore, observations made by Stewart and Walsh (Reference Stewart and Walsh1967) regarding heavier rumen for calves fed a ration rich in protein can be applied to our study with growing bulls, too. The significantly heavier thymus of maize-fed animals and the trend of heavier lungs for animals fed with FA cannot be explained.
The results for serum concentrations of glucose as well as NEFA and BHB are indicators for energy metabolism and give some evidence of the net energy balance as well as the fat depots. Supplementation with FA had no significant effect on plasma glucose and NEFA, which is an indicator for lipolysis (Cincovic et al., Reference Cincovic, Branislava, Biljana, Hristov and Dokovic2012). This lack of effects on glucose and NEFA agree with Carrasco et al. (Reference Carrasco, Medel, Fuentetaja and Carro2012) who did not find any influence of malic acid (MA), a propionate precursor like FA, on the serum glucose concentration of heifers. However, this contradicts the results by Bayaru et al. (Reference Bayaru, Kanda, Kamada, Itabashi, Andoh, Nishida, Ishida, Itoh, Nagara and Isobe2001) who found increased plasma glucose levels for steers fed with FA. The results of NEFA suggest that lipolysis was influenced by neither FA nor silage type. The values of BHB decreased with FA supplementation. It can be assumed that this is a result of less butyrate in the rumen fluid of animals supplemented with FA (Huhtanen et al., Reference Huhtanen, Miettinen and Ylinen1993; Nielsen et al., Reference Nielsen, Ingvartsen and Larsen2003; Kraft and Dürr, Reference Kraft and Dürr2005). The decreased butyric acid concentrations in the present study are in line with Sirohi et al. (Reference Sirohi, Poonam and Navneet2012).
Lower butyric acid concentrations for the grass-fed animals are in accordance with Owens et al. (Reference Owens, McGee, Boland and O’Kiely2009). They found the highest butyric acid concentrations in cattle fed with maize silage. These values of the rumen fluid have to be considered with caution, because they present only spot samples. In order to get more representative results for the SCFA in rumen fluid, multiple samples should be taken over several hours. However, in the present study, all samples were taken in the same way, and therefore the differences and significations between the feeding groups can be taken into account. The time between animal death and sampling of rumen fluid was as short as possible. This was necessary as the active absorption of SCFA across the rumen wall (Gäbel and Sehested, Reference Gäbel and Sehested1997) stops at time of death. The production of SCFA from bacteria continues as long the bacteria survive and could shift the proportion of the SCFA. The SCFA results are in line with Remling et al. (Reference Remling, Riede, Lebzien, Meyer, Höltershinken, Kersten, Breves, Flachowsky and Dänicke2013) and Aschemann et al. (Reference Aschemann, Lebzien, Hüther, Südekum and Dänicke2012), who collected the samples at seven different time points after feeding. Nevertheless, the missing effects of FA on SCFA are in line with Carrasco et al. (Reference Carrasco, Medel, Fuentetaja and Carro2012) and Chethan et al. (Reference Chethan, Verma and Singh2013). Carrasco et al. (Reference Carrasco, Medel, Fuentetaja and Carro2012) observed that MA has no influence on the SCFA profile and Chethan et al. (Reference Chethan, Verma and Singh2013) reported the same result by feeding goats with FA. However, these observations contradict this in that Zhou et al. (Reference Zhou, McSweeney, Wang and Liu2012) observed increased levels of SCFA with fumarate supplementation in sheep and that Remling et al. (Reference Remling, Riede, Lebzien, Meyer, Höltershinken, Kersten, Breves, Flachowsky and Dänicke2013) could also detect effects of FA on the SCFA profile in dairy cows. In addition, Yang et al. (Reference Yang, Mao, Long and Zhu2012) observed higher concentrations of propionic acid and acetic acid in rumen fluid of goats after feeding fumarate. Mach et al. (Reference Mach, Devant and Bach2006) found lower SCFA concentrations for bulls fed more non-fibrous carbohydrates like maize and more NFC when increasing fat content or linseed supplementation. This observation could not be confirmed in the present study. The glycerol content in the ration of groups not supplemented with FA could have modified SCFA concentrations in rumen fluid. The greatest proportion (75%) of glycerol passes the rumen unmetabolised into the intestine. The remaining 25% are fermented by rumen microbes according to Omazic et al. (Reference Omazic, Kronqvist, Zhongyan, Martens and Holtenius2015). In an in vitro study Danielsson et al. (Reference Danielsson, Werner-Omazic, Ramin, Schnurer, Griinari, Dicksved and Bertilsson2014) observed greater concentrations of propionic acid and butyric acid in rumen fluid after glycerol treatment. Therefore, in the present study an influence of glycerol, particularly on butyric acid in rumen fluid, should not be excluded.
The missing effects of FA on the microbial community are in line with Remling et al. (Reference Remling, Riede, Lebzien, Meyer, Höltershinken, Kersten, Breves, Flachowsky and Dänicke2013). The microbial community was not influenced by feeding an acid over a long term. The significant effect of the silage type on the bacteria community could be a result of the different roughage types. It is known that the microbial community depends on the chemical composition of the roughage (Carberry et al., Reference Carberry, Kenny, Han, McCabe and Waters2012) and as shown by Remling et al. (Reference Remling, Hachenberg, Meyer, Höltershinken, Flachowsky and Dänicke2011), the roughages contained different ether extracts and fibre contents. The results of SSCP of the present study and the analyses of the roughage fed (Remling et al., Reference Remling, Hachenberg, Meyer, Höltershinken, Flachowsky and Dänicke2011) are comparable with the results in Remling et al. (Reference Remling, Riede, Lebzien, Meyer, Höltershinken, Kersten, Breves, Flachowsky and Dänicke2013).
The histological diagnoses of the rumen mucosa did not differ between dietary treatments. According to Rezac et al. (Reference Rezac, Thomson, Bartle, Osterstock, Prouty and Reinhardt2014), neither the FA supplementation nor the silage type had an influence on rumenitis when differentiated into mild or severe rumenitis lesions. In addition, there was no difference between the different sample locations (villous area or villi-free area in the rumen). These results are in line with the lacking effects of FA and silage type on the SCFA of rumen fluid. Effects on the integrity of the rumen wall were not expected without changes in rumen pH (Penner et al. Reference Penner, Steele, Aschenbach and McBride2011). An interaction of FA and silage type was found for the COI on the rumen mucosa. In the villous area, significantly more COI were found in animals of groups M0 and G300. Although it contradicts the histological diagnosis, this interaction underscores that the effects of FA depend on the diet (Kolver and Aspin, Reference Kolver and Aspin2006).
No interaction was found for the samples of the villi-free area. Nevertheless, the higher count of COI did not lead to worsening of rumenitis as shown by histology, where no effects of the different feeding groups could be demonstrated. These results are in line with pH values from the rumen fluid of slaughtered animals which are also not influenced by the different feeding groups (Remling et al., Reference Remling, Hachenberg, Meyer, Höltershinken, Flachowsky and Dänicke2011). Therefore, the results of the present study do not support the hypothesis by Wood et al. (Reference Wood, Wallace, Rowe, Price, Yanez-Ruiz, Murray and Newbold2009) that feeding of FA triggers acidosis.
Short-chain fatty acids are known to increase the perfusion of the rumen (Dobson and Phillipson, 1965) which results in increased rumen villi growth (Warner et al., 1956). Tamate et al. (1962) observed that propionic and butyric acid stimulated the growth of rumen papillae. The results of the present study are not in agreement with these observations; the villi of the grass-fed animals had larger surfaces, although the maize-fed animals had higher butyric acid concentrations. However, the results of Mach et al. (Reference Mach, Devant and Bach2005) suggest larger surface areas for animals fed with more non-fibrous carbohydrates. This is the opposite of the results of the present study. The interaction between FA and silage type on villi count, growth and surface per villi underline the hypothesis by Castillo et al. (Reference Castillo, Benedito, Mendez, Pereira, Lopez-Alonso, Miranda and Hernandez2004). They found that dietary factors like forage and grain type have an effect on the response of feed additives like FA. In the present study, the growth of rumen villi increased in the maize-fed animals and decreased in the animals-fed grass with FA supplementation. The rumen villi morphology reflects the long-term effects of FA. In conclusion, the long-term supplementation effects of FA to bulls are mainly observed in rumen wall villi (morphology and COI) and are both forage-source dependent.
Acknowledgements
The assistance of the co-workers of the Institute of Animal Nutrition and the Experimental Station (Friedrich-Loeffler-Institute) in Braunschweig (Germany) in performing the experiment and analyses, as well as the support of this study by the H. Wilhelm Schaumann Foundation in Hamburg (Germany) is gratefully acknowledged.