





Food is at the heart of the world’s greatest challenges: health, climate change and food insecurity. Encouraging consumers to eat in line with the UK’s food-based dietary guidelines-the Eatwell Guide-will deliver benefits for human health as well as our planet(Reference Scheelbeek, Green and Papier1). It is critical to find a way to better understand population food behaviours in a scalable and timely manner to tackle these complex problems.
Traditionally, research and national surveys have used self-reported dietary consumption records for public health research and policy making. Insights have been used by stakeholders widely, including by industry. However, there are well-documented limitations to this approach, including, but not limited to: different biases, participant and researcher burden, scale and timeliness(Reference Kipnis, Midthune and Freedman2). Research and national surveys have additionally used till receipts as an indicator of dietary purchasing patterns, and while this provides a different view of food brought into the home it too has limitations shared with self-reporting(3).
Smart data generated by activities of daily living, such as electronically captured food purchases in supermarket transaction records and by loyalty cards offer an arguably more objective, and at scale, near real-time solution(Reference Jenneson, Pontin and Greenwood4). Whilst these data require substantial computation power alongside data science and AI expertise to analyse, in addition to nutrition expertise to interpret meaningfully(Reference Clark, Shute and Jenneson5), they allow evaluation of natural experiments in real world settings, helping to translate the effectiveness of different food environment interventions beyond hypothetical and virtual settings(Reference Fildes, Lally and Morris6,Reference Skeggs and McHugh7) . These consumer purchase data are different to self-reported sales data in research databases like Euromonitor, Kantar and Neilsen that require participants to scan all their purchases for inclusion in large panel studies of purchase records(Reference Bandy, Adhikari and Jebb8). Such databases are not generated by an activity of daily living and still require participant cooperation which can introduce bias. Consumer purchase data from supermarket sales are also subject to bias, but in a different way, with different approaches required to handle these(Reference Skatova9).
Following a systematic review in 2022, it is known that consumer purchase data have been used in observational studies, policy evaluations and experimental designs across 14 different high-income countries across the globe(Reference Jenneson, Pontin and Greenwood4). The majority of these studies (68%) have been published since 2013, indicating their increasing popularity over recent years. Studies use consumer purchase data at different levels of aggregation, from the customer, who may be an individual or a household, through to country level scale. Despite this rising interest, validation of consumer purchase data as a measure of dietary assessment is still limited with only two studies in the 2022 review(Reference Jenneson, Pontin and Greenwood4) comparing sales to intake records(Reference Eyles, Jiang and Ni Mhurchu10,Reference Hamilton, Mhurchu and Priest11) . Since 2022, there have been more validation studies published, including ‘Supermarket Transaction Records In Dietary Evaluation: the STRIDE study’ which used sales data from Sainsbury’s linked, with consent, to FFQ and survey data(Reference Jenneson, Greenwood and Clarke12), results of which will be discussed later in this review paper. A similar study in Finland looked at the association between consumer purchase data for food groups with self-reported intake, assessed using an FFQ. The study found that agreement was moderate at best(Reference Vepsalainen, Nevalainen and Kinnunen13). These results are not unexpected, as agreement between more traditional measures of dietary assessment are also moderate given the limitations with each measurement approach(Reference Greenwood, Hardie and Frost14). For example, in a research study comparing the same three days of consumption records recorded by 23 different diet apps with a weighed food record, a difference of up to 1701 KJ (407 Kcal) in energy intake was observed(Reference Chen, Cade and Allman-Farinelli15). Therefore, these studies are a welcome addition to the literature understanding the utility of consumer purchase data as a potential dietary assessment method.
With food purchases a critical factor for environmental sustainability and achieving net zero, in an environmental sustainability context, the total food purchased is perhaps more important that total food consumed. Household food waste still contributes towards a range of environmental sustainability metrics, even though it does not contribute to diet from a nutrient and health perspective.
There is now emerging work linking consumer purchase data to health outcomes, via cohort studies and disease registry data. This individual linkage, with consent, has the potential to be a powerful tool to better understand the impact of food purchasing behaviour and health outcomes. In a Danish cohort with linked electronic receipts to registry data, households containing an individual with diabetes had significantly different spend on some ‘less healthy’ products than participants without diabetes, specifically, they were likely to spend a greater proportion of their food purse on butter, oil and dressings; non-sugary drinks; processed red meat and ready meals, and a lower proportion on accessory compounds (such as herbs and spices); alcoholic beverages; eggs; grains; rice and pasta, and raw vegetables(Reference Sorensen, Nielsen and Moller16).
The commercially sensitive nature of consumer purchase data presents data security challenges for their use in research that differ from personally sensitive data that health researchers in academia are more accustomed to. Trust, secure data infrastructure and collaborative ways of working are essential to unlock the power of such data. A champion – an individual passionately advocating for the cause – on both sides of the industry-academic collaboration is needed as sharing commercial data for research is not straightforward or commonplace. The champion within the industry partner organisation, not only considers the commercial sensitivity, but critically the customer sensitivities and ensure that all data sharing is aligned with ethical and legal use of data. With everything aligned, food behavioural insights can be generated to use alongside more traditional research to drive food system transformation.
This review paper will discuss the context in which transaction records have greatest utility, using results from the STRIDE validation study comparing consumer purchase data with FFQ. It will go on to describe cross-sectional and longitudinal dietary purchase patterns within a cohort of regular shoppers, before sharing insight derived from consumer purchase data on the impact of a variety of instore and online interventions that incentivise fruit and vegetable purchasing. Innovatively, examples of how businesses utilise similar data to help drive healthier sales are shared. Both the retailer and academic motivation for using these novel data in research are presented, including knotty challenges around nutrition, health and sustainability metrics. To address biases in sales data, working with multiple retailers is important, but raises challenges with competition law, which are discussed, alongside an example where this has been overcome. In conclusion a set of recommendations for consideration for future research using consumer purchase data in research in its broadest sense are presented.
What is known about using consumer purchase data to support food systems transformation?
This section is structured as a series of questions, for which both academic and industry insights are presented, before presenting broader evidence.
What do the data look like?
Academic insights
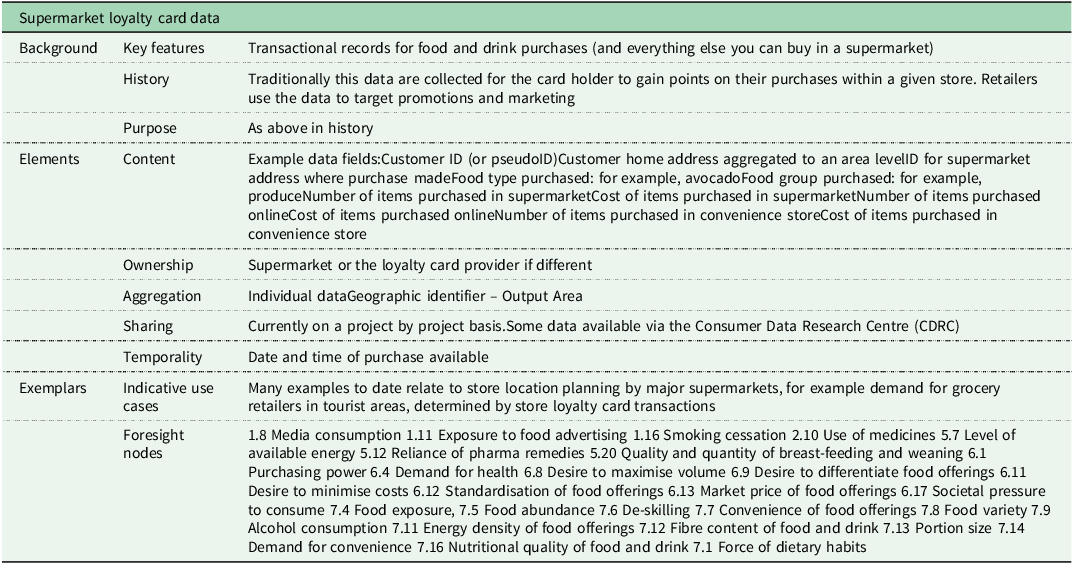
For academic research, the data requested from a retailer depend upon the specific question being addressed, this is one reason why both nutrition and data science expertise are essential. An example of consumer purchase meta data is reported in Morris, Wilkins(Reference Morris, Wilkins and Timmins17), and reproduced here in Table 1.
Supermarket Loyalty card data reported using the BEE-COAST framework. Reproduced from Morris, Wilkins(Reference Morris, Wilkins and Timmins17)

Table 1. Long description
The table is structured into several sections: Background, Elements, Exemplars. The Background section includes key features and history. Key features describe transactional records for food and drink purchases. The history notes that this data is traditionally collected for the cardholder to gain points on their purchases within a given store. Retailers use the data to target promotions and marketing. The Purpose is stated as the same as in history. The Elements section includes Content, Ownership, Aggregation, and Sharing. Content lists example data fields such as Customer ID, Customer home address, supermarket address where purchase made, Food type purchased, Number of items purchased in the supermarket, Cost of items purchased in the supermarket, Number of items purchased online, Cost of items purchased online, Number of items purchased in convenience store, and Cost of items purchased in convenience store. Ownership is noted as the supermarket or the loyalty card provider if different. Aggregation is described as individual data and Geographic identifier Output Area. Sharing is currently on a project basis, with some data available via the Consumer Data Research Centre. Temporality includes date and time of purchase available. The Exemplars section includes Indicative use cases and Foresight nodes. Indicative use cases include many examples to date relate to store location planning by major supermarkets, for example demand for grocery retailers in tourist areas, determined by store loyalty card transactions. Foresight nodes include 1.8 Media consumption 1.11 Exposure to food advertising 1.16 Smoking cessation 2.10 Use of medicines 5.7 Level of available energy 5.12 Reliance of pharma remedies 5.20 Quality and quantity of breast-feeding and weaning 6.1 Purchasing power 6.4 Demand for health 6.8 Desire to maximise volume 6.9 Desire to differentiate food offerings 6.11 Desire to minimise costs 6.12 Standardisation of food offerings 6.13 Market price of food offerings 6.17 Societal pressure to consume 7.4 Food exposure, 7.5 Food abundance 7.6 De-skilling 7.7 Convenience of food offerings 7.8 Food variety 7.9 Alcohol consumption 7.11 Energy density of food offerings 7.12 Fibre content of food and drink 7.13 Portion size 7.14 Demand for convenience 7.16 Nutritional quality of food and drink 7.1 Force of dietary habits.
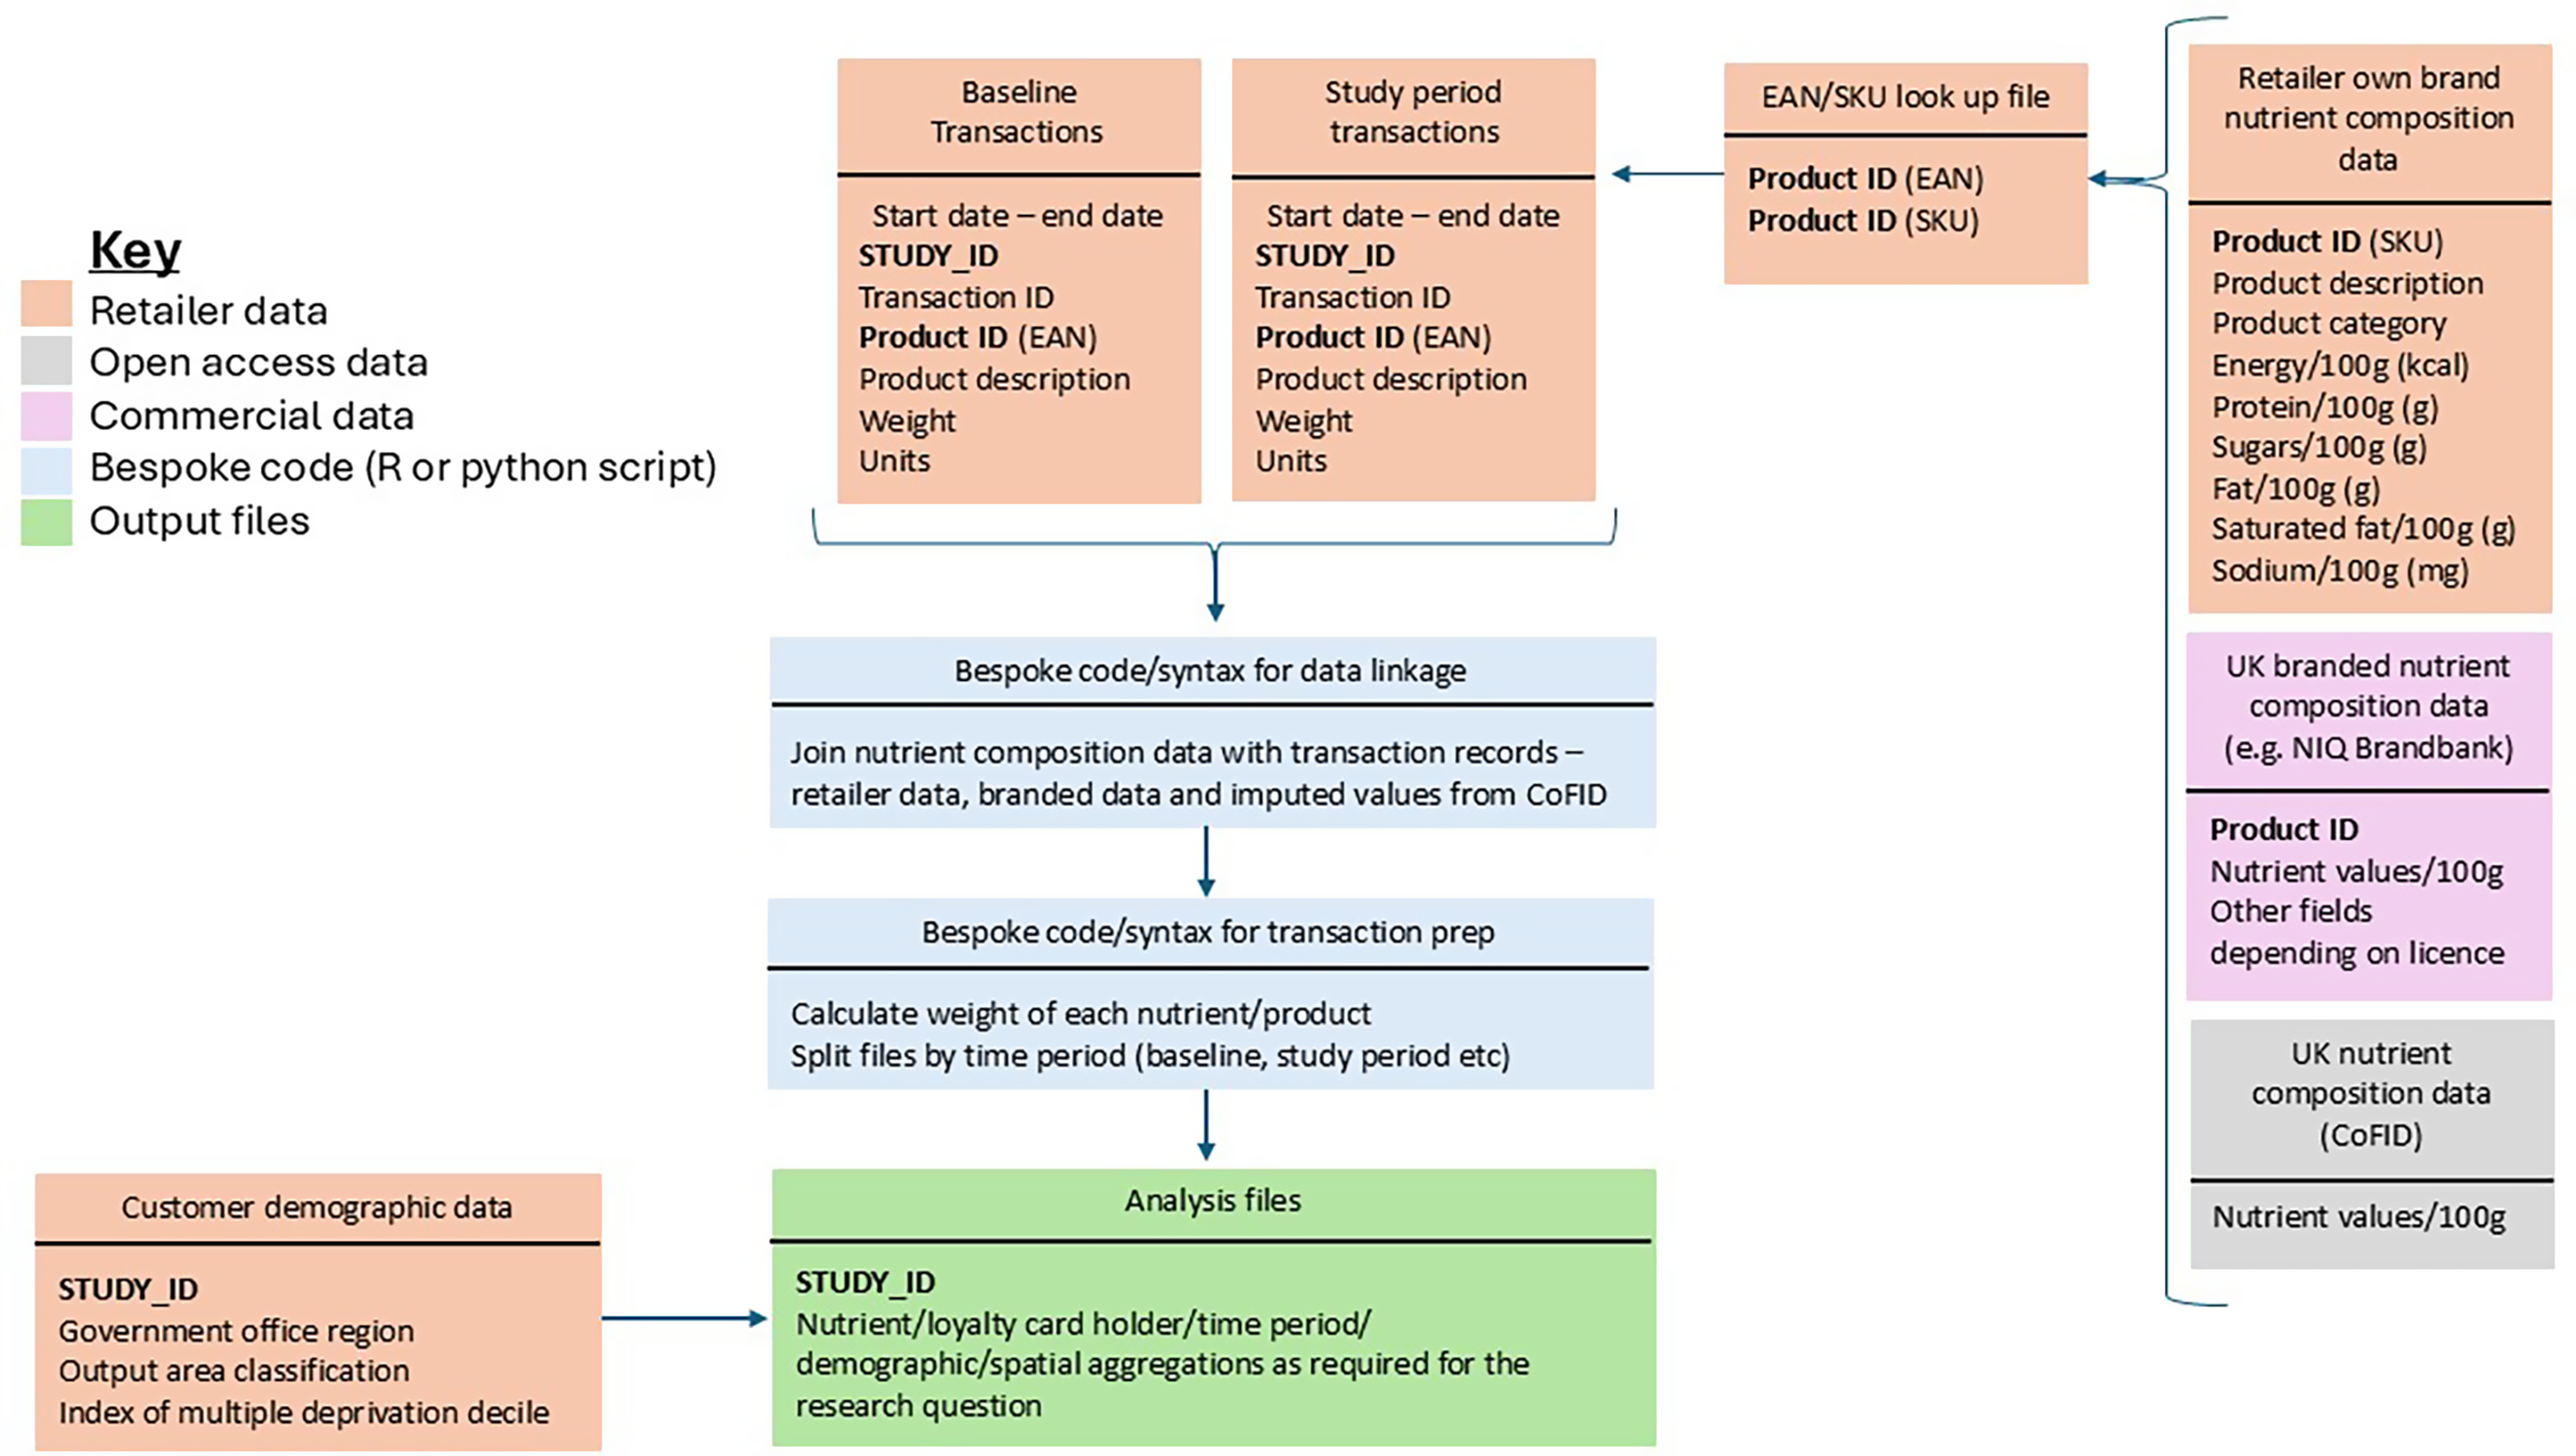
These data are indicative of the sort of variables that may be available from a retailer. An example of how consumer purchase data are combined with nutrient data for research is reported in Jenneson(2022)(Reference Jenneson18) and adapted here in Fig. 1.
Example data relationship diagram for working with transaction data in a nutrition context(Reference Jenneson18)

University of Leeds research investigating dietary patterns derived from UK supermarket transaction data, with nutrient and socioeconomic profiles, sampled loyalty card shoppers who shopped on a frequent basis from a wide range of food categories, for one region in the UK(Reference Clark, Shute and Jenneson5). This meant that data were only shared for shoppers who could feasibly have been doing most of their shopping at Sainsbury’s and excludes those who only ever buy a meal deal, for example. Product-level transactions data were acquired and linked these to nutrient information, which allowed generation of detailed nutrition profiles for purchases over a 12-month period. Using the geographic identifier (output area) for where the loyalty card holder resides, it was possible to append socio-demographic information from the area the customer lived. This resulted in ∼300 000 customers with hundreds of millions of individual products purchased. Results revealed a social gradient in the dietary quality of purchase patterns.
In a different study with another retailer, where the impact of moving salad items alongside Italian ready meals was investigated, data were requested on total product sales, at the individual product level, aggregated to a store level, for both intervention (n = 23) and control stores (n = 44)(Reference Jenneson, Pontin, Fildes, Young and Morris19). Daily sales were shared for 2 years prior to the intervention, for 3 months during the intervention and 9 months post intervention. These data allowed development of interrupted time series models that revealed no impact of the intervention compared with the counterfactual for the promoted salads. There was unsurprisingly no impact on the share of sales by UK Eatwell guide categories either. However, profiling the retailer sales by the Eatwell guide revealed that shoppers at this retailer already purchased fruit and vegetables in line with the Eatwell guide recommendations, suggesting there was little motivation to increase purchases of these items further. Ongoing research evaluating the impact of the UK legislation to prohibit promotion of food and drink high in fat sugar and salt (HFSS) in certain locations in store and online on product sales for four retailers will use similar store-level sales data(Reference Jenneson, Pontin and Ennis20–22).
Retailer product portfolios – a list of all the products they sell, accompanied by product nutrition information – is important for understanding the offering to consumers, how this could be impacted by reformulation, and to allow the development and testing of the potential impact of nutrition policy legislation before its implementation(Reference Jenneson, Greenwood and Clarke23). There are a number of proprietary services that offer this information at a branded level, for example NIQ Brandbank and myfood24. Open data exist for a selection of about 3000 generic food items, for which much of the academic research is based(24). When combining the nutrition information with sales data, the product weight is important, but not typically present in generic databases, or for unpackaged products. For example: a retailer sold 10 million bananas last month. There are 51 Kcal per 100 g of bananas (Bananas, raw, flesh only, weighed with skin). To calculate the total Kcal from the sales of 10 million bananas, the weight of the bananas is required, but not readily available.
Retailer insights
Retailers hold large volumes of data relating to different types of customer baskets, longitudinal consumer purchasing patterns, geographical variations in purchasing habits, purchasing by store type (e.g. convenience store, large supermarket), category-level nutrition insights, for example, the performance of some products over others within a particular aisle, as well as product-specific nutrition, availability and sales information. However, bringing these data together in a meaningful way to deliver insights presents both a challenge and an opportunity.
Over 80% of the UK adult population shopped with Sainsbury’s on at least one occasion over the last year. These shopping occasions may take place in any of the 1435 store network, consisting of both large store format and convenience stores in many types of setting, for example, urban, rural, deprived, affluent and all four nations of the United Kingdom(25). In addition to product nutrition information and sales data for these stores, Sainsbury’s have access to anonymised loyalty card data (indicative of household purchasing patterns) via the Nectar card programme. With more than 20 million Nectar card holders, there are 31 Nectar cards swiped every second(25). Moreover, Sainsbury’s hold product nutrition information for >30 000 stock keeping units (SKUs)(Reference Clark, Shute and Jenneson5,Reference Jenneson, Kininmonth and Wilkins26) representing a mix of both own brand and branded products (Branded product nutrition information is proprietary and is licensed from NIQ Brandbank.). These change regularly over the course of a year based on seasons, sales performance and supply. This means supermarkets like Sainsbury’s hold a wealth of information about population food and drink purchase patterns, not available in another setting at the same scale and temporality.
Not only do Sainsbury’s have in-store sales information, but sales are also recorded for purchases via in-house online platforms and online aggregators, such as: Deliveroo and UberEats. During 2023, there were over 18 million customers buying groceries at Sainsbury’s and 2.6 million of these shopped online(25).
While much of these data are commercially sensitive, increasingly retailers are making data publicly available, on a voluntary basis, in particular, data relating to health of purchases. Examples include the Access to Nutrition Initiative(27) and the World Wildlife Foundation shopping basket(28). In addition, many retailers disclose healthiness of sales within their annual sustainability reporting. Mandating this kind of reporting would level the playing field from a commercial perspective and provide a more complete picture of the UK’s purchasing patterns from a research perspective. This would align with the UK government ambition for the Food Data Transparency Partnership, although that is not yet mandatory either(29).
Investor pressure and Environmental, Social and Governance (ESG) benchmarks driving better nutrition data within the private sector
Up until the last few years, much of a company’s product nutrition data, especially in relation to relevant nutrient profiling models (such as the Food Standards Agency 2004/5 Nutrient Profile Model (NPM) to determine if a product is HFSS), would be held in manual excel files, making it challenging to combine it with other relevant internal sales data(Reference Jenneson and Morris30). But, with pressure from investors for businesses to publicly disclose the healthiness of their sales, and with emerging regulations requiring real-time data on a product’s nutrition status (HFSS or not) for compliance purposes, much of this nutrition data is being housed in automated data infrastructures, making access and insight more readily available. Additional data to calculate the nutrient profile model score and whether a product is classified as HFSS or not has required a step change from manufacturers (for branded products) to share information as this is not typically included on the back of pack.
Automated private sector health disclosures
Automated health data unlocks multiple solutions – for business, investors and for customers but the work involved in getting to this outcome should not be underestimated, especially for multinational businesses, those who have acquired multiple business using different operating systems or for companies like retailers managing very significant product portfolios. It usually requires an investment of 2–5 years and even then, requires ongoing work to improve data errors. But once achieved, this automated nutrition data can deliver significant benefits to help drive healthier sales, as described in Box 1.
Examples of retailer benefits from automating health data
-
1. Resource efficiencies – nutrition information can be combined with other commercial insights at scale and in real time, informing business leaders at the point of decision. This has been especially helpful when implementing the high fat, salt and sugar (HFSS) placement regulations, by being able to link product information (including those sourced directly from branded manufacturers) to legally compliant ranging decisions in store. Reporting on product level nutrition reformulations for a single nutrient used to take 2 full-time staff at least 3–6 months to complete 5 years ago – showing the scale of the efficiencies in such a short time.
-
2. Insight – we’re able to capture a better sense of what’s driving changes in healthy sales, helping to inform materiality and evaluate campaigns in real world settings. Automated data can also help identify recipe renovations using filters or screening algorithms to spot precise changes but also where these might be <10% shift (i.e. easier to achieve) and material, that is, for products with substantial volume sales. This is especially key for companies with huge product portfolios.
-
3. Transparency – disclosure of our healthy sales performance has been shown to influence investor decisions and can be useful in attracting further investment.
-
4. Innovation – for example, in the Nectar Fruit and Veg challenge, better data has allowed for more personalised incentives and tasks, encouraging the purchase of less familiar fruits and vegetables and integrating nutrition data with a customer’s annual basket to show them how much of their spend is on fruit and vegetables.
What can (or can’t) sales data tell us?
Academic insights
Consumer purchase data reflect food and drink that have been bought. They do not necessarily represent food and drink that have been consumed, or who consumed them. However, purchase data are arguably objective as they are generated as activity of daily living, rather than the act of participation in research, which is well known to alter behaviour.
Existing research suggests that purchase records are a reasonable measure of relative nutrient consumption, or dietary composition, but that caution should be taken when using as an absolute measure of nutrient intake, given the inability to account for foods purchased elsewhere, food waste and for how purchased foods are apportioned between household members(Reference Jenneson, Greenwood and Clarke12,Reference Vepsalainen, Nevalainen and Kinnunen13) . There is more to be done to support development of weightings for consumer purchase records to transform data to be more representative of consumption.
Consumer purchase data enable profiling of dietary patterns, at scale, for consumers from a variety of demographic groups. While Sainsbury’s data under-represent customers living in areas classified as the most deprived decile in Yorkshire and the Humber, that most deprived group contained more than 20 000 loyalty card holders(Reference Clark, Shute and Jenneson5). These groups are typically hard to reach in research, but though use of purchase records it is possible to reach many, adding substantial value to the literature and understanding of dietary purchase patterns, and assumed consumption in these communities, and how they differ from other groups. With a known cohort of shoppers, as described in(Reference Clark, Shute and Jenneson5), it is then possible to understand the impact of interventions that target these low-income groups. For example, when Sainsbury’s provided £2 top-up coupons for each redemption government Healthy start vouchers (available to low-income families with a pregnant woman and/or young children), loyalty card transaction data enables a closer inspection of how using the voucher impacted the composition of the customer basket. Results showed that during the intervention customers purchased on average one portion per day per household more of fruit and vegetables, compared with baseline. In addition, 98% of customers spent the whole £2 on fruit or vegetables(Reference Thomas, Moore and Onuselogu31).
In the UK, working with just one retailer limits the generalisability of research findings, with five retailers sharing a 75% share of the grocery market as of March 2025(32). For other countries where there is less competition, one retailer will likely be more representative of the population. With this in mind, the team at the University of Leeds have developed wider collaboration with a consortium of retailers convened by the Institute of Grocery Distribution (IGD)(33). With stringent governance frameworks and co-produced outcome metrics, a series of unilateral data sharing agreements (between an individual retailer and the University of Leeds) have been established, a suite of instore and online interventions scoped and run. Taking lessons learned from the partnership with Sainsbury’s the Leeds team have been able to scale out to include other retailers, often representing a different type of customer in the UK.
As already mentioned, consumer purchase data are an important tool for evaluating policy interventions such as the HFSS product placement restrictions(Reference Crabtree, Hunter and Jenneson21,22) and also the Soft Drinks Industry Levy(34). In 2022, Sainsbury’s made customer level sales data available for purchases of soft drinks over a 3.5 year period from January 2016 through to June 2019, for a two-week data study group challenge (which is the Alan Turing Institute’s term for what others might call an ‘online hackathon’)(Reference Jenneson and Morris35). These data spanned a period before the levy was announced through to one year post implementation. The data enabled the data study group to:
-
1. Categorise customers based on their pre-levy purchase behaviours and understand whether these determined response to the levy.
-
2. Characterise types of response to the levy
-
3. Understand whether response to the levy was determined by demographic characteristics of the customer or the area in which they live.
In this example, not only are these data used to understand the impact of a national fiscal policy, but it contributed significantly to training, capacity building and inspiring early career researchers.
Retailer insights
In addition to identifying hot spot categories to drive healthier sales and material opportunities for reformulation, Sainsbury’s data can be used to evaluate health interventions more effectively. This can be done swiftly internally, but it can also be independently evaluated and published by an academic third party, ensuring these trials are robustly reviewed. Sainsbury’s are increasingly using this insight to deliver more customised health experiences for customers. Take for example, the opt in Nectar Fruit and Veg Challenge where customers are sent weekly challenges, badges and targets(Reference Stewart, Jenneson, Tempest, Walker and Evans36). Personalised shopper data is used to help set more realistic challenges and purchasing targets for the shopper, including incentivising a broader repertoire of fruit and veg purchases.
With consent, loyalty card data can be used to compare attitudes and beliefs to actual purchasing patterns, providing useful insights around customer awareness of the healthiness of their shop. During a trial in January 2023, among 2991 primary shoppers, customers were asked how they thought they were purchasing across Eatwell Guide food groups. Attitudes versus purchases showed that customers were broadly very good at estimating their fruit and vegetable purchases but that there appeared to be a disconnect between assumed compared with actual purchases of discretionary and carbohydrate-rich purchases.
But, given that retailer data is household purchase data, and even for a primary shopper (retailer own terminology for customers going their main shop at Sainsbury’s), represents on average just 64% of their ‘food wallet’, it is not advisable make assumptions about the food intake of an individual based on the purchasing data. For example, whilst primary shopper data shows that typical baskets in the Brigg and Immingham area contain, on average, as little as 15% fruit and vegetables, it should not be assumed that this is reflective of a typical diet or even of shoppers in that region. It’s quite plausible that these shoppers simply buy these items elsewhere.
Similarly, disclosures on the healthiness of sales, which Sainsbury’s publishes annually on its corporate site, only reflects a point in time. It doesn’t explain the reasons why consumers make the choices they do. And, as observed during the cost of living crisis, disclosures don’t allow you to see the data in context – for example, that despite disclosing flat healthy sales year on year, Sainsbury’s were growing fruit and vegetable sales above the market (+3% in 2023/4), demonstrating investment to grow these, counter to the market average of 0% change in fruit and veg purchases at that time(37). Equally, customers were increasingly shifting out of the out of home sector and therefore treating themselves to more indulgent purchases ‘in home’ – a trend that sales data for one retailer alone cannot help to frame(38,39) . So, context is just as important as the insights from one data source in framing the narrative.
How does academic-industry partnership work? And who benefits?
The University of Leeds is proud of its partnership with Sainsbury’s, and more recently with other retailers. Best practice ways of working, for both parties, are openly shared whenever relevant. In order to articulate this better the team conducted a qualitative study, employing semi-structured interviews and analysed data using reflective thematic analysis to develop a partnership framework(Reference Jenneson, Stone and Ennis40). A good partnership requires much up-front time investment, in addition to ongoing commitment, review and iteration for it to continue to perform well for all involved.
The food system is complex, and in many cases differs from other academic-industry collaborations due to the breadth and depth of the system; from farming through to public health where conflicts or interests may differ. With that in mind, a workshop was convened at the University of Leeds with a variety of food system actors to unpack the following two questions:
-
1. What is unique about the food system and the way we build partnerships?
-
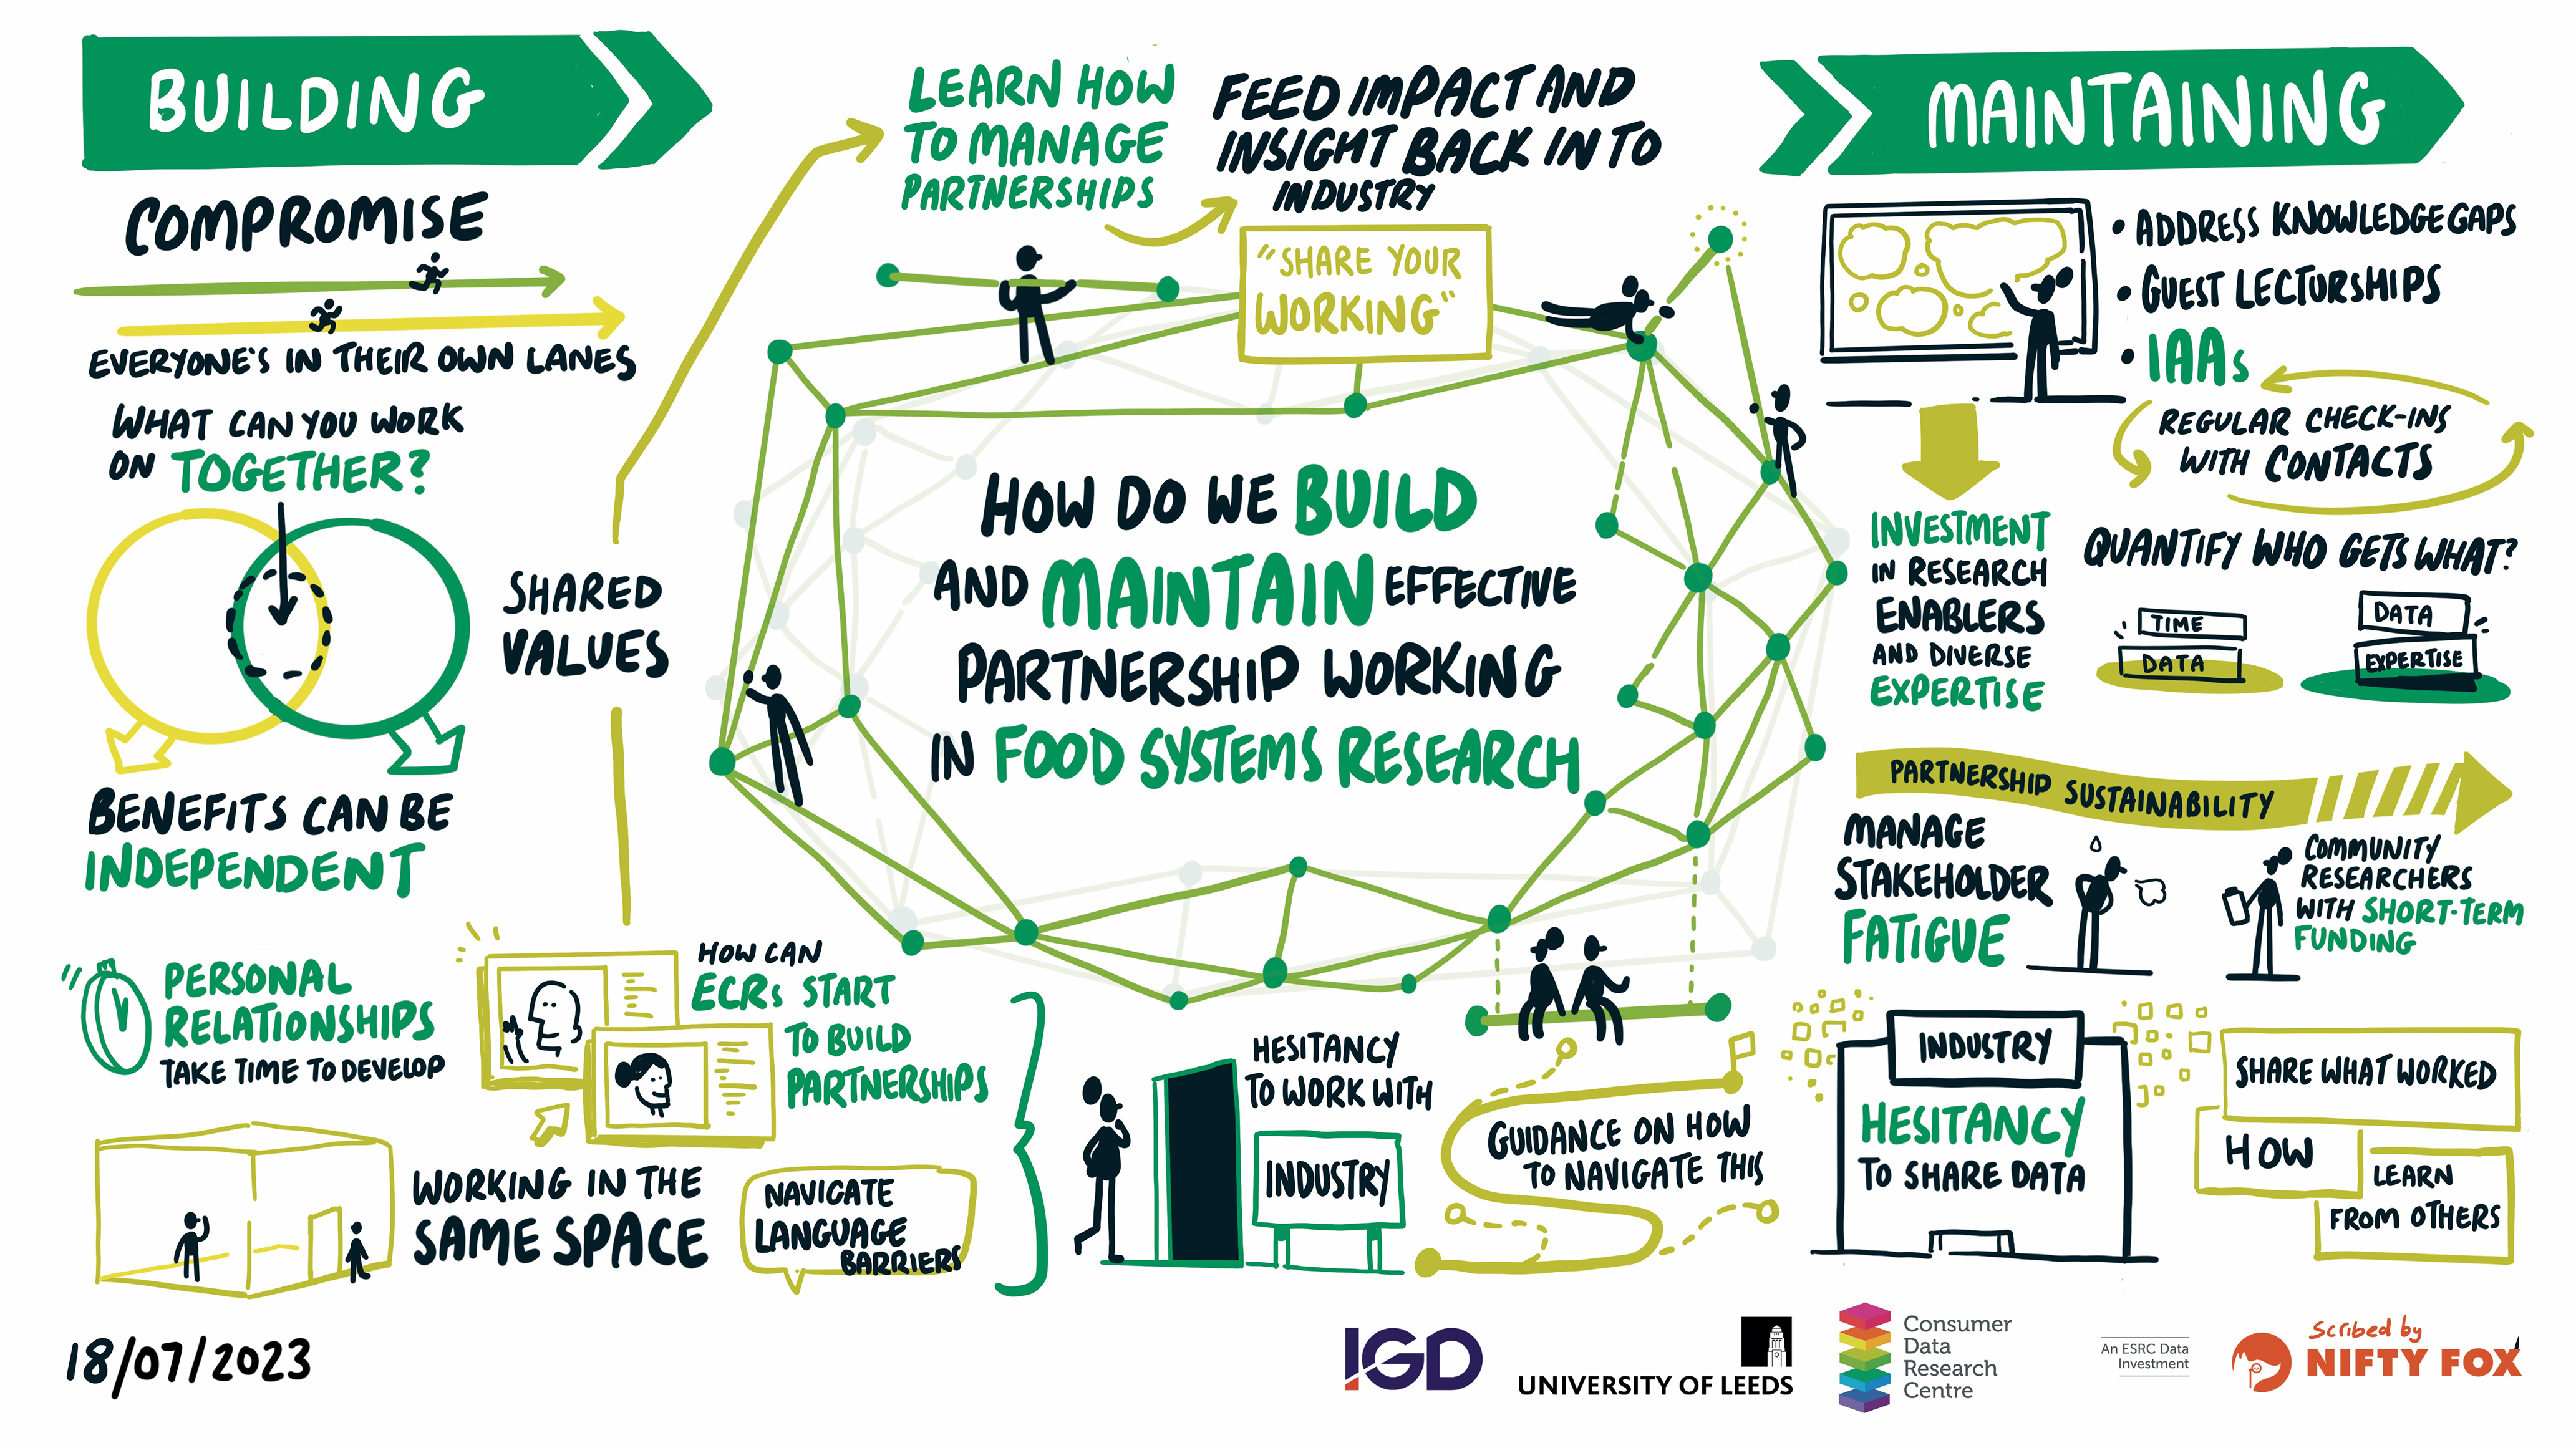
2. How to build and maintain effective partnership working in food systems research?
The response to question 2, is visualised in Fig. 2. Key themes emerged, such as: finding the sweet spot where both parties can work together, even if benefits to each party are independent, recognising shared values and managing stakeholder fatigue(Reference Morris41).
How to build and maintain effective partnership working in food systems research.

Further examples of when partnership ways of working are successful are highlighted in ‘Healthier Food Choices’ in supermarkets, citing programmes run by organisations like the Consumer Good Forum (evaluated by the University of Oxford) and IGD (evaluated by the University of Leeds) as examples of best practice(Reference Thomas and Sritharan42).
How can others get involved with consumer purchase data?
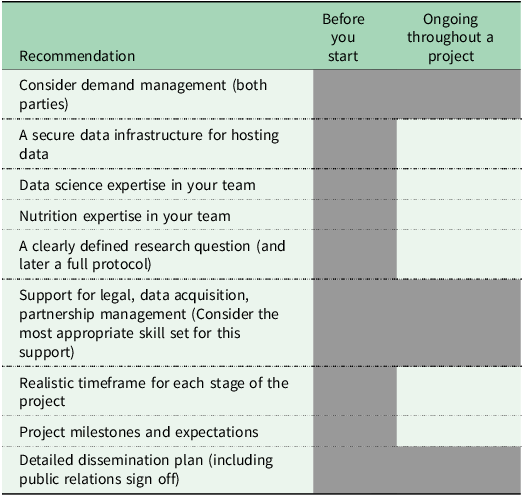
A checklist of recommendations for academics to consider ahead of starting a collaboration a retailer is summarised in Table 2. These recommendations aim to increase the success of any partnership, benefiting both parties and generating wider impact.
Recommendations checklist for working with retailer data

Table 2. Long description
A table listing recommendations for academics to consider before and during a collaboration with a retailer. The table has two columns: Before you start and Ongoing throughout a project. All cells in the Before you start column are shaded. In the Ongoing throughout a project column, the cells containing “Consider demand management (both parties)” and “Support for legal, data acquisition, partnership management (Consider the most appropriate skill set for this support)” are shaded. The table has nine rows with the following content: Row 1: Consider demand management (both parties). Row 2: A secure data infrastructure for hosting data. Row 3: Data science expertise in your team. Row 4: Nutrition expertise in your team. Row 5: A clearly defined research question (and later a full protocol). Row 6: Support for legal, data acquisition, partnership management (Consider the most appropriate skill set for this support). Row 7: Realistic timeframe for each stage of the project. Row 8: Project milestones and expectations. Row 9: Detailed dissemination plan (including public relations sign off).
Consider demand management (both parties): There is an ongoing time commitment throughout collaborative research using consumer data from both the retailer and the academic institution. Careful thought is needed about how this will be provided and maintained to ensure success of the project. Consideration should be specifically given to communication methods between academic and retailer teams to ensure efficacy and efficiency from the outset.
A secure data infrastructure for hosting data: This is essential to ensure that customer data is stored securely to protect both the data subjects and the commercial sensitivities.
Data science expertise in your team: These data are huge, complex and often messy. It is essential that your team includes colleagues with sufficient data science expertise to handle them. Technical expertise needs to be matched with computing power of the secure environment.
Nutrition expertise in your team: When using these data for nutrition research, nutrition expertise is essential. Pure data or computer scientists risk missing the important contextual information which means that data are used incorrectly leading to outcomes that are meaningless for nutrition or create important findings that are then interpreted in the wrong way.
Clearly defined research question (and later a full protocol): Before engaging with a retailer, you need to be clear about the research question you would like to answer, and why this is important. This is how a retailer will decide whether or not to engage with you to collaborate and share data. Once the research questions and analysis plan and data request are confirmed, a full research protocol development is recommended to support open science and best practice.
Support for legal, data acquisition, partnership management (Consider the most appropriate skill set for this support): The time, patience, energy and expertise required from both the academic institution and retailer should not be underestimated. Establish key contacts on both sides early and maintain open channels of communication throughout. It is unlikely that a post-doctoral research fellow will have the complete skill set to handle this aspect of the partnership, but the expertise does typically exist within all organisations.
Realistic timeframe for each stage of the project: Data sharing and data preparation always takes longer than expected so it is important to build in enough time. Conversely a timeline that is too long to generate findings that are meaningful to the business goals of the retail partners or feed into the rapidly moving food policy landscape, are unlikely to be supported at the project conception/co-production stage. Therefore, there is an important but challenging balance to strike.
Where multiple retailers are involved in a project, this can take longer still, as typically no ‘one size fits all’. The time taken to establish a data sharing agreement can vary considerably from months to years. Likewise, a standardised format for sharing of retailer sales data is yet to be established, so data cleaning and preparation requirements will differ by retailer.
Where there are multiple colleagues in a team working on the partnership or project, establish a way of keeping records and tracking decisions made or steps taken throughout and the rationale for these.
Project milestones and expectations: these are important for maintaining partnership engagement and to hold all parties accountable. It is therefore important to co-produce these accounting for the realities of resource availability and reliance on and communication between members within the team, and functions outside of the immediate team – for example data ingress and egres from a secure data environment.
Dissemination plan (including public relations sign off): Project and data sharing agreements need to be established such that results will be shared widely. That said, a likely criterion is that all outputs require sign off by retailer public relations teams, for which time should be built into timelines. This step is important and beneficial for maximising the reach and impact of the research beyond the business team you are working with.
Conclusion: So, is it a conflict or interest?
In order to change the food system, collaboration across the system is essential. It is important to manage conflicts of interests but to find ways to collaborate effectively to drive change is in everyone’s best interest. Data sharing by industry for independent analysis by academics is one way to work towards a shared goal, within a clearly defined governance framework. Research funded by public and charity funds, for a shared purpose offers great potential to add important insight while minimising conflicts.
Acknowledgements
Thanks to all participants at the Healthy and Sustainable Diets Partnership Workshop at the University of Leeds on Tuesday 18th July 2023, whose contributions are represented in Fig. 2.
Thank you to the Leeds Institute for Data Analytics Data Analytics Team and the Sainsbury’s data teams for all their contributions to the work presented here.
Author contributions
MAM led the writing of the academic insights. NS led the writing of the retailer insights.
MAM – conceptualisation, investigation, project administration, writing original draft, writing review and editing.
NS – conceptualisation, investigation, writing original draft.
AK, EW, MT, VJ – investigation, writing review and editing.
Financial support
Academic work described in this manuscript has been funded by the following grants over a 10-year period: ESRC Funded Consumer Data Research Centre, references: ES/L011891/1, ES/S007164/1; ESRC Funded Centre for Doctoral Training in Data Analytics and Society, reference: ES/R501062/1; Institute for Grocery Distribution funding through their Social Impact programmes on healthy and sustainable diets; University of Leeds Engaged for Impact Prize Funding; Transforming the UK Food System for Healthy People and a Healthy Environment SPF Programme, delivered by UKRI, in partnership with the Global Food Security Programme, BBSRC, ESRC, MRC, NERC, Defra, DHSC, OHID, Innovate UK and FSA.
Competing interests
Nilani Sritharan and Maddie Thomas work for Sainsbury’s Plc.
Michelle A Morris is an inventor and shareholder at Dietary Assessment Limited but has not received payment from the company to date. Michelle has worked with multiple large retailers who have shared data for research purposes.
Alice Kininmonth, Emma Wilkins and Victoria Jenneson have worked with multiple large retailers who have shared data for research purposes.

 Open access

