With longer life expectancy and the accompanying increase in cognitive impairment and neurodegenerative diseases in many societies, there is a growing interest in identifying the factors that affect age-related cognitive decline, such as sleep duration (Faubel et al., Reference Faubel, Lopez-Garcia, Guallar-Castillon, Graciani, Banegas and Rodriguez-Artalejo2009; Kronholm et al., Reference Kronholm, Sallinen, Suutama, Sulkava, Era and Partonen2009; Lo et al., Reference Lo, Loh, Zheng, Sim and Chee2014; Brewster et al., Reference Brewster, Varrasse and Rowe2015). For older adults, the optimal sleep duration each night is seven to eight hours (Hirshkowitz et al., Reference Hirshkowitz2015). A recent meta-analytic review involving over 97,000 individuals has shown that short and long sleep durations increase the odds for poor cognitive function in older adults by 1.40 and 1.58 times, respectively, and such associations appear most prominent for general measures of cognition (Lo et al., Reference Lo, Groeger, Cheng, Dijk and Chee2016). Although some studies have examined the moderating effect of individual characteristics, such as age and gender, on the inverted U-shaped association between sleep duration and cognitive function (Lo et al., Reference Lo, Groeger, Cheng, Dijk and Chee2016), the importance of social relationships in this association remains unexplored.
It has been argued that antecedent of well-being is best understood within the biopsychosocial framework (Engel, Reference Engel1977). Psychologically, with increasing age and the limited amount of time left, individuals pay more attention to social relationships while being less concerned about the achievement and instrumental gains (Carstensen, Reference Carstensen2006). The current study addresses the moderating effects of three distinct domains of social relationships, namely, marital status, household size (number of people the elderly lives with), and social network with friends and relatives outside the household on the sleep duration–cognitive function association in older adults.
Literature has documented that these three domains of social relationships affect cognitive function in older adults. Unmarried elderly are found to have poorer cognition than their married counterparts (Yeh and Liu, Reference Yeh and Liu2003). Regarding household size, older adults who live alone have stronger cognitive decline (van Gelder et al., Reference van Gelder, Tijhuis, Kalmijn, Giampaoli, Nissinen and Kromhout2006). Additionally, fewer social ties are linked with poorer cognitive performance (Bassuk et al., Reference Bassuk, Glass and Berkman1999). One explanation is that social support associated with social relationships may provide mental stimulation that contributes to brain physiology and promotes better cognitive strategies (Sims et al., Reference Sims, Levy, Mwendwa, Callender and Campbell2011). Another perspective is that social support buffers against factors that impair cognition. For instance, social support may protect against inflammation (Yang et al., Reference Yang, Schorpp and Harris2014). Social support is also presumed to reduce physiological arousals, such as hypothalamic-pituitary-adrenal (HPA) axis and sympathetic nervous system (SNS) activations, which are linked with poorer cognition (Seeman and McEwen, Reference Seeman and McEwen1996).
Hypotheses
Consistent with the extant research (Lo et al., Reference Lo, Groeger, Cheng, Dijk and Chee2016), we expect an inverted U-shaped association between sleep duration and cognitive function in our sample (Hypothesis 1). Extreme sleep duration is associated with poor cognitive function via its impairing effect on brain physiology and elevation of systemic inflammation (Lo et al., Reference Lo, Groeger, Cheng, Dijk and Chee2016). We argue that being married (vs. unmarried), more (vs. fewer) household members, and stronger (vs. weaker) social network imply more social support (e.g. Yeh and Liu, Reference Yeh and Liu2003), and may reduce the negative impact of extreme sleep duration on cognitive function due to their salutary effects on brain physiology and reduction of inflammation (Sims et al., Reference Sims, Levy, Mwendwa, Callender and Campbell2011; Yang et al., Reference Yang, Schorpp and Harris2014). Specifically, the inverted U-shaped sleep duration–cognitive function association may be less profound when older adults are married (Hypothesis 2), live with more household members (Hypothesis 3), and/or have stronger social networks (Hypothesis 4).
Our predictions, if borne out empirically, will inform efforts to address elderly's social relationships as a way of reducing the negative impact of extreme sleep duration on cognitive function. This applied implication is particularly relevant to Singapore, the current research context. The number of Singaporeans aged 65 years or above was 11% in 2015 (Singapore Department of Statistics, 2015) and is projected to triple by 2030 (Singapore National Population and Talent Division, 2013). There is a pressing need to design interventions and policies that modulate cognitive decline, in order to improve the quality of life of this rapidly growing older adult population.
Methods
Participants
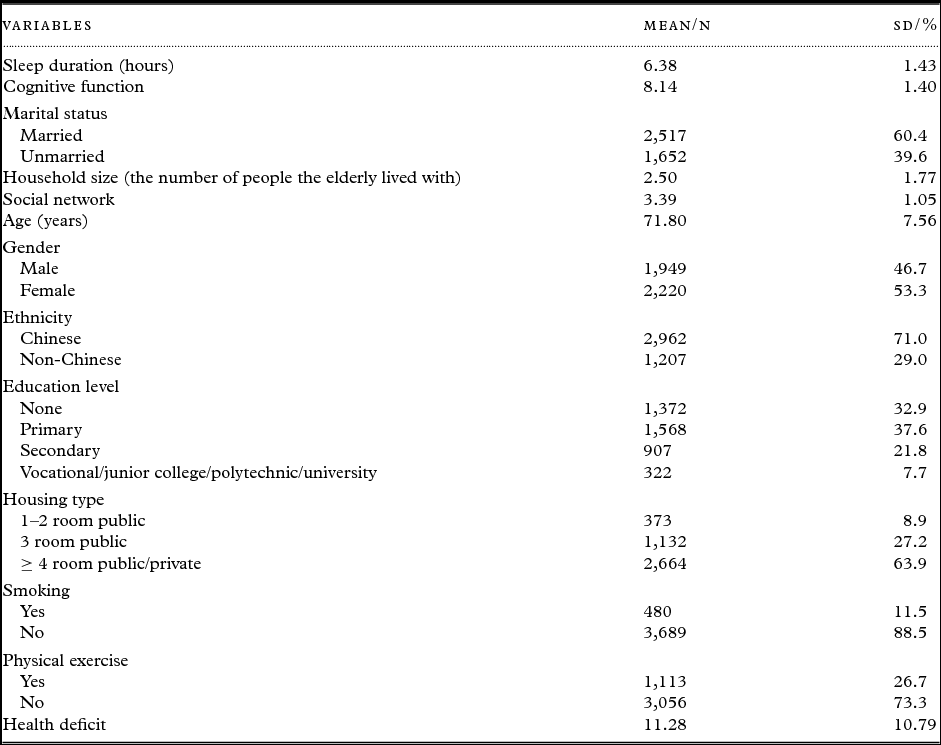
We utilized data from the Social Isolation, Health, and Lifestyles Survey (SIHLS). SIHLS was a nationally representative survey of community-dwelling older Singaporeans (≥ 60 years) conducted by the Singapore Ministry of Community Development, Youth, and Sports (currently known as Singapore Ministry of Social and Family Development), in 2009. It employed single-stage stratified random sampling to select the survey sample (for more details, see Chan et al., Reference Chan, Malhotra, Malhotra and Ostbye2011). A random sample of 8,400 older adults, stratified by age, gender, and ethnicity was drawn from a national database. 1,195 addresses were found to be invalid. 4,990 older adults or their proxies (mostly spouse or adult child; n = 453) were interviewed face-to-face at their residence with informed consent using a structured questionnaire (69% response rate). This sample was comparable to the general older population reported in the Singapore Census 2010 on age distribution, gender, ethnicity, education level, and housing type. Elderly who had been diagnosed with dementia (self-reported and/or confirmed with household members – an approach used in some previous studies, e.g. Xu et al., Reference Xu2011) were not included in the present analysis. During this survey, proxies were interviewed instead when the elderly were unable to respond directly (e.g. due to dementia, speaking difficulties). The proxy interviews were excluded here because variables including social network, depression, and cognition were not assessed through the proxies (Chan et al., Reference Chan, Malhotra, Malhotra and Ostbye2011; Malhotra et al., Reference Malhotra, Haaland, Chei, Chan, Malhotra and Matchar2015). Another major source of missing data was the record of body mass index (BMI). 570 older adults did not participate in the anthropometric measurement of their weight and height, and their BMI were missing. Given these reasons, some data was not missing at random. We adopted listwise deletion, which is the most common practice for handling missing data (Enders, Reference Enders2010). The final sample for the present analysis involved 4,169 individuals (mean age = 71.80 years; 1949 males; Table 1).
Descriptive statistics (N = 4169)
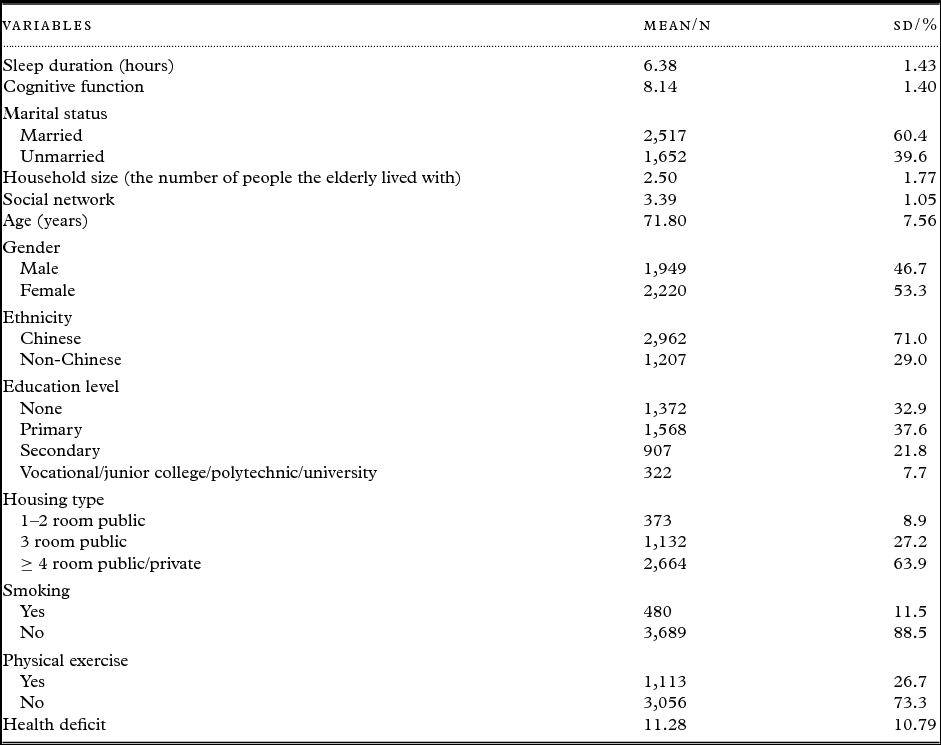
Note: Mean and SD are shown for the continuous variables (sleep duration, cognitive function, household size, social network, age, and health deficit). N and % are shown for the ordinal variables (education level and housing type) and dichotomous variables (marital status, gender, ethnicity, smoking, and physical exercise).
Main variables
In our analysis, higher scores signify higher levels of a continuous variable. For the predictor variable of sleep duration, a subjective measure was adopted. Participants indicated their duration of sleep in number of hours and minutes by answering the question “On average, approximately how much do you sleep per night?” The wordings of our sleep duration question are similar to those used in the previous studies of sleep and cognition in older adults (Loerbroks et al., Reference Loerbroks, Debling, Amelang and Stürmer2010; Lo et al., Reference Lo, Loh, Zheng, Sim and Chee2014).
The outcome variable of cognitive function was assessed with the Short Portable Mental Status Questionnaire (SPMSQ) (Pfeiffer, Reference Pfeiffer1975). SPMSQ includes 10 items (score range: 0 to 10; α = 0.75) that test orientation to time and place, memory, current event information (e.g. day of the week), and executive functions (subtract 3s starting with number 20). The validity and reliability of SPMSQ are well established (Fillenbaum et al., Reference Fillenbaum, Landerman and Simonsick1998). A large correlation between Mini-Mental State Examination (MMSE) (Folstein et al., Reference Folstein, Folstein and McHugh1975) and SPMSQ (r = 0.81) has been reported among Singaporean elderly (Malhotra et al., Reference Malhotra, Chan, Matchar, Seow, Chuo and Do2013a).
Health surveys of older adults conducted in face-to-face interviews, particularly instruments assessing cognitive function, are subject to interviewer error (Malhotra et al., Reference Malhotra, Haaland, Chei, Chan, Malhotra and Matchar2015). Interviewer error is a type of measurement error. Based on the initial interaction with an older adult before the cognitive assessment, the interviewer may have formed an impression of the cognitive status of the respondent. This impression may alter the interviewer's subsequent verbal and non-verbal cues to the respondent, influencing the respondent's performance during cognitive assessment. This impression may also affect the interviewer's interpretation of the responses provided. Hence, following Malhotra et al. (Reference Malhotra, Haaland, Chei, Chan, Malhotra and Matchar2015), we analyzed and reported corrected cognitive scores. Cognitive scores were adjusted for interviewer error by subtracting the random intercept estimates for each interviewer, which were obtained in multilevel analysis, from the SPMSQ score for each of their respondent.
Moderators included marital status, household size (number of people the elderly lives with), and social network. Marital status was a dichotomous variable (1 = married, 0 = unmarried), with unmarried encompassing widowed, separated, divorced, and never married (Malhotra et al., Reference Malhotra, Chan and Ostbye2010b). Social network was measured by Lubben and Gironda's (Reference Lubben, Gironda, Berkman and Harootyan2003) 12-item scale, which has been used in local research (Chan et al., Reference Chan, Malhotra, Malhotra and Ostbye2011). It assesses the size of network, frequency of contact, and perceived closeness with relatives (six items) and friends outside the household (six items) (Chan et al., Reference Chan, Malhotra, Malhotra and Ostbye2011). A sample item is “How often do you see or hear from friends with whom you have the most contact?” (6-point: 1 to 6; α = 0.92).
Covariates
Covariates included five demographic variables: age, gender (1 = males, 0 = females), ethnicity (1 = Chinese, 0 = non-Chinese), education level, and housing type. Education level was assessed with a 4-point ordinal scale, with 1 indicating none, and 4 indicating vocational/junior college/polytechnic/university (Chan et al., Reference Chan, Malhotra, Malhotra and Ostbye2011) (Table 1). In Singapore, over 80% of the population lives in public housing. The type of housing (private or public), and within public housing, the number of rooms can be regarded as proxy of socioeconomic status in this country (Malhotra et al., Reference Malhotra, Malhotra, Chan and Ostbye2013b). Here, housing type was assessed with a 3-point ordinal scale (1 indicating 1–2 room public, 3 indicating ≥ 4 room public/private) (Chan et al., Reference Chan, Malhotra, Malhotra and Ostbye2011).
We also included three health-related covariates: whether the individuals currently smoked (1 = yes, 0 = no), whether they did physical exercise regularly (1 = yes, 0 = no), and their health deficit. Health deficit is usually defined as the proportion of cumulative deficits to all possible physiological, psychological, and functional deficits for a given individual in various fields (Gu et al., Reference Gu, Dupre, Sautter, Zhu, Liu and Yi2009; Qiu et al., Reference Qiu, Sautter, Liu and Gu2011), resonating the worldwide acknowledgement that our body is a holistic system in which different heath aspects are interconnected (Brannon et al., Reference Brannon, Feist and Updegraff2014; Ng et al., Reference Ng, Feng, Nyunt, Larbi and Yap2014). While different studies include different numbers or types of indicators to estimate health deficit, a random selection of variables produces similar findings (Rockwood et al., Reference Rockwood, Mitnitski, Song, Steen and Skoog2006). To compute health deficit index, we divided the unweighted count of the number of deficits by the total number of possible deficits for an individual (e.g. Gu et al., Reference Gu, Dupre, Sautter, Zhu, Liu and Yi2009). We then multiplied this fraction by 100 such that this index lied between 0 (best health) and 100 (poorest health). We considered the presence (1 = yes, 0 = no) of 20 possible deficits, including 10 chronic diseases (e.g. cerebrovascular disease), obesity, 8 kinds of mobility limitation (e.g. difficulty in walking 200 to 300 m, see Nagi, Reference Nagi1976), and depression. Obesity was examined based on the Asian classification of BMI (Malhotra et al., Reference Malhotra, Chan, Malhotra and Ostbye2010a). Respondents with a BMI greater than 27.4 kg/m2 were regarded as obese. Depression was assessed with the 11-item Center for Epidemiological Studies Depression (CES-D) Scale (score range: 0 to 22; α = 0.76). A sample item is “I felt that everything I did was an effort.” Individuals who scored less than 7 were classified as free of depression symptoms (Kohout et al., Reference Kohout, Berkman, Evans and Cornoni-Huntley1993).
Statistical analysis
We performed multiple regression analysis to test our hypotheses (Cohen et al., Reference Cohen, Cohen, West and Aiken2002; Hayes, Reference Hayes2013) using SPSS version 24. To examine the hypothesized inverted U-shaped association between sleep duration and cognitive function (H1), the quadratic term of sleep duration as well as the lower order linear term was included in the regression model. Three variables of social relationships (marital status, household size, and social network) and eight covariates (age, gender, ethnicity, education level, housing type, smoking, physical exercise, and health deficit) were also included. To expound short and long sleep, we considered seven hours as the reference of sleep duration (e.g. Xu et al., Reference Xu2011) and centered sleep duration with this value. Age was mean centered to improve the interpretability of the model intercept.
To examine the moderating effect of marital status (H2), we came up with an interaction term between marital status and sleep duration (linear), and an interaction term between marital status and sleep duration (quadratic). We created similar interaction terms for the moderating effects of household size (H3) and social network (H4). Household size and social network were continuous variables and mean centered.
For significant moderators, we illustrated their effects using simple slope analysis, which has been advocated by the multiple regression literature (e.g. Cohen et al., Reference Cohen, Cohen, West and Aiken2002; Hayes, Reference Hayes2013). In line with the multiple regression literature, we did not create arbitrary subgroups of the continuous moderator variables (household size and social network). Instead, we preserved the continuous nature of these variables, and mathematically modeled how the shape of the sleep duration–cognitive function curve varied across different specific values of household size and social network. Following usual practice (e.g. Cohen et al., Reference Cohen, Cohen, West and Aiken2002; Hayes, Reference Hayes2013), two “simple slopes” were depicted to illustrate the moderating effect of social network: One for the sleep duration–cognitive function association when social network was “weaker” (at 1 SD below the mean social network), and another one for the sleep duration–cognitive function association when social network was “stronger” (at 1 SD above the mean social network). We also tested the statistical significance of these two curves. The moderating effect of household size was also scrutinized with these procedures. Overall, these procedures demonstrate how an association varies across the whole range of a continuous moderator. Similarly, for the effect of the categorical moderator of marital status, we depicted “simple slopes” to illustrate the sleep duration–cognitive function association for married and unmarried elderly separately, and examined the statistical significance of these two sleep duration–cognitive function curves.
Results
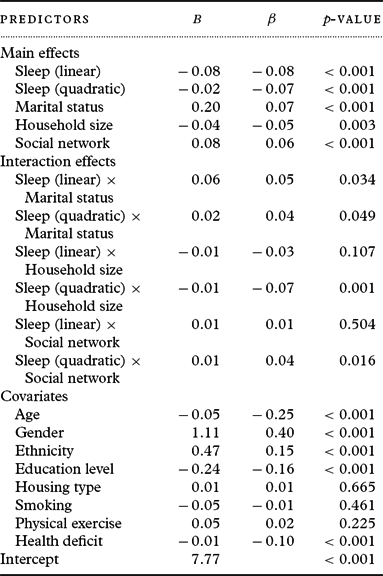
Our regression model significantly accounted for 30% variance of cognitive function, F (19, 4,168) = 92.86, p < 0.001. The quadratic term of sleep duration was significant (β = −0.07, p < 0.001; Table 2). This finding suggested an inverted U-shaped association between sleep duration and cognitive function, and was in line with H1.
Regression analysis of cognitive score
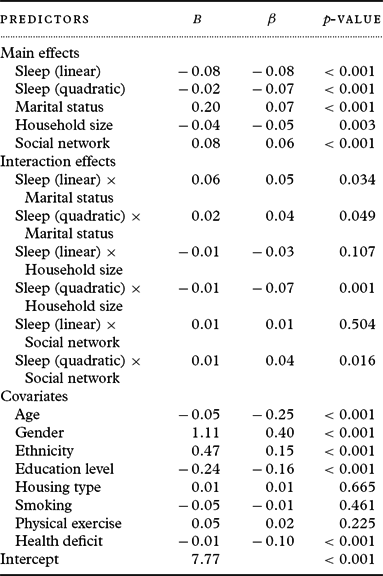
Note: B = unstandardized coefficient, β = standardized coefficient.
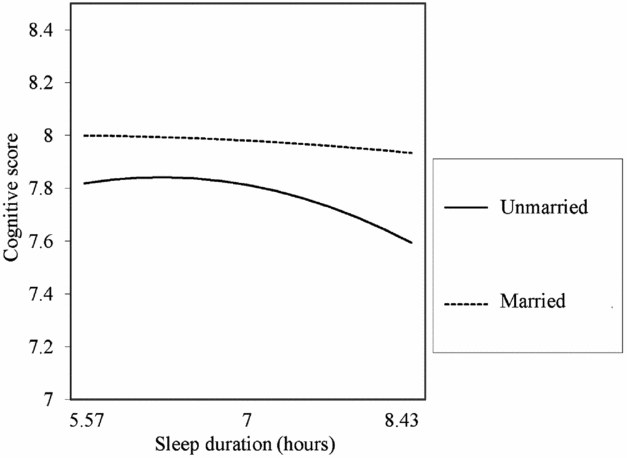
Next, we addressed the moderating effects using simple slope analysis (Cohen et al., Reference Cohen, Cohen, West and Aiken2002; Hayes, Reference Hayes2013). There was a significant interaction between sleep duration (quadratic) and marital status (β = 0.04, p = 0.049; Table 2). Corroborating H2, the sleep duration–cognitive function association was less profound for married elderly (β = −0.04, p = 0.006) than their unmarried counterparts (β = −0.10, p = 0.002; Figure 1).
Moderating effect of marital status. The simple slopes of the sleep duration–cognitive function associations for the married and unmarried older adults are respectively illustrated by the dotted and the solid lines.

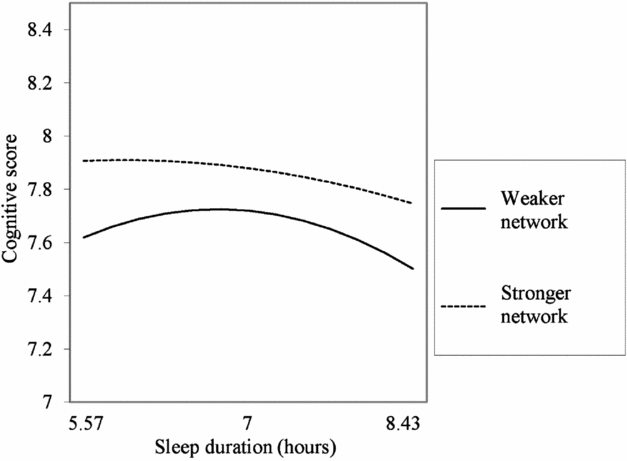
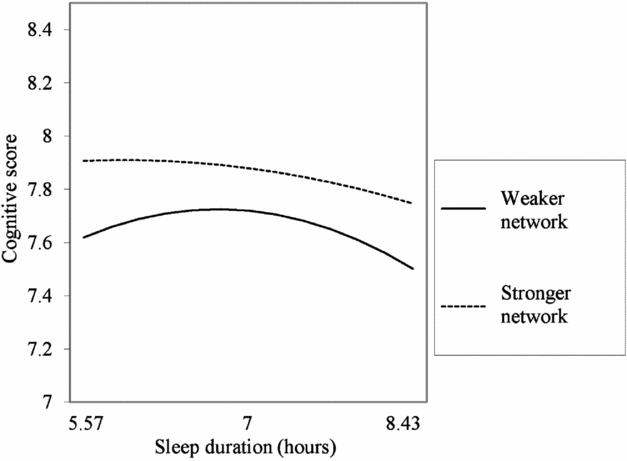
There was also a significant interaction between sleep duration (quadratic) and social network (β = 0.04, p = 0.016; Table 2). Simple slope analysis revealed that the sleep duration–cognitive function association was attenuated when social network was stronger (at 1 SD above the mean social network) (β = −0.04, p = 0.177) than when social network was weaker (at 1 SD below the mean social network) (β = −0.11, p < 0.001; Figure 2). These findings together indicated that the strength of the sleep duration–cognitive function association reduced with an improved social network (Cohen et al., Reference Cohen, Cohen, West and Aiken2002; Hayes, Reference Hayes2013). H4 was supported.
Moderating effect of social network. The simple slopes of the sleep duration–cognitive function associations for older adults with stronger social networks (at 1 SD above the mean social network) and those with weaker social networks (at 1 SD below the mean) are respectively illustrated by the dotted and the solid lines.
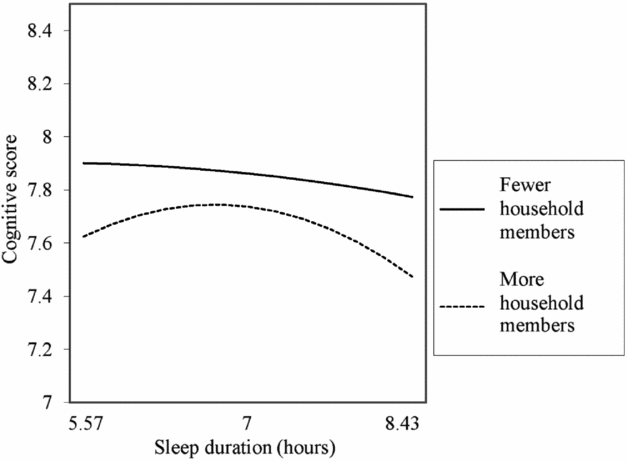
The moderating effect of household size was also significant (β = −0.07, p = 0.001; Table 2). Simple slope analysis showed that the association between sleep duration and cognitive function was stronger among elderly who had a relatively large household size (at +1 SD) (β = −0.13, p < 0.001) than those who had a relatively small household size (at −1 SD) (β = −0.02, p = 0.416; Figure 3). These findings together indicated that inconsistent with H3, the sleep duration–cognitive function association appeared to strengthen with more household members (Cohen et al., Reference Cohen, Cohen, West and Aiken2002; Hayes, Reference Hayes2013).
Moderating effect of household size. The simple slopes of the sleep duration–cognitive function associations for older adults with more household members (at 1 SD above the mean number of household members) and those with fewer household members (at 1 SD below the mean) are respectively illustrated by the dotted and the solid lines.

Discussion
Singapore has a rapidly aging population. Thus far, there is a dearth of data on the association between sleep duration and cognitive function among older Singaporeans. A notable exception is Lo et al.’s (Reference Lo, Loh, Zheng, Sim and Chee2014) study, which revealed an association between short sleep duration and faster cognitive decline in a relatively small sample (N = 66). Based on data from over 4,000 local elderly, we reveal an inverted U-shaped association between sleep duration and cognitive function. Importantly, we extend the sleep duration–cognitive function literature by pioneering the research on the moderating effect of social relationships.
From a biopsychosocial perspective (Engel, Reference Engel1977), the beneficial effects of social support on brain physiology and inflammation (Sims et al., Reference Sims, Levy, Mwendwa, Callender and Campbell2011; Yang et al., Reference Yang, Schorpp and Harris2014) may counteract the impairing effects of extreme sleep duration on these dimensions (Lo et al., Reference Lo, Groeger, Cheng, Dijk and Chee2016), thereby weakening the association between extreme sleep duration and poor cognitive performance. A spouse is a source of social support (Yeh and Liu, Reference Yeh and Liu2003), and married elderly may enjoy more social support than their unmarried counterparts. Indeed, our findings reveal that cognitive function is less vulnerable to the negative impact of extreme sleep duration among married elderly (Figure 1). Social support may also come from friends and relatives (Lubben and Gironda, Reference Lubben, Gironda, Berkman and Harootyan2003). Hence, the moderating effect of social network resembles that of marital status (Figure 2).
However, the curvilinear association between sleep duration and cognitive function appears to be stronger when the household size is larger (Figure 3). Although intuitively, more household members imply more daily support to the elderly (e.g. assistance with housework from the daughter, companionship of the grandson), the increased support accompanied with more household members could be a source of stress (Sims et al., Reference Sims, Hosey, Levy, Whitfield, Katzel and Waldstein2014). The incessant and various support provided by different household members may unintentionally heighten the elderly's feelings of dependence and burden, and may increase self-doubt of their usefulness and erode their perceived mastery (Ang and Malhotra, Reference Ang and Malhotra2016). One may also argue that support from household members is a source of stress to older adults from the angle of reciprocity (Sims et al., Reference Sims, Hosey, Levy, Whitfield, Katzel and Waldstein2014). With age, adults typically change their role from primary support provider to primary support recipient. To the extent the elderly perceive that they cannot reciprocate the constant support from household members and fail to negotiate their change in social roles, they may feel uncomfortable and stressed. This kind of stress may increase the level of cortisol, which has impairing effects on cognition (Starkman et al., Reference Starkman, Giordani, Berent, Schork and Schteingart2001; Brannon et al., Reference Brannon, Feist and Updegraff2014). Therefore, larger household size can potentially fuel the negative impact of extreme sleep duration on cognitive function.
Limitations and future research
Future studies may address whether social support and stress underlie the moderating effects of marital status, household size, and social network. Regarding marital status, researchers may focus on married elderly and compare the sleep duration–cognitive function association between those who enjoy higher marital quality (more social support) and those who have lower marital quality (less social support). We also acknowledge that we do not have data that directly speaks to the potential biological accounts (brain physiology and inflammation) for the interplay between sleep duration and social relationships in cognitive function. A future research avenue is the substantiation of these biological mechanisms.
Sleep duration was self-reported. Replication studies using objective measures of sleep duration (e.g. actigraphy) are needed. Future research should also take sleep disorders such as insomnia and obstructive sleep apnea into account. Another caveat is that the present analysis relied on correlational data and could not establish causal relationships. It could be that elderly's poor cognitive function induces more people to stay with them (larger household size). Note, however, that our discussion is based on previous research, some of which are longitudinal and able to demonstrate temporal causations (e.g. van Gelder et al., Reference van Gelder, Tijhuis, Kalmijn, Giampaoli, Nissinen and Kromhout2006).
The effect sizes of the moderating effects seemed small (0.04 ≤ |β| ≤ 0.07). Note that our research focuses on how the pattern of the sleep duration–cognitive function association is dependent on social relationships, and our findings were based on a large sample. Large sample introduces small sampling error (Hunter and Schmidt, Reference Hunter and Schmidt2004). Our observations are likely to be robust and not to be due to chance. The current survey (SILHS) adopted SPMSQ as the cognitive measure. Different measures vary in measurement error that affects effect size (Hunter and Schmidt, Reference Hunter and Schmidt2004). Larger effect sizes may be observed with other cognitive measures (e.g. MMSE, see Folstein et al., Reference Folstein, Folstein and McHugh1975), a possibility to be addressed in future studies.
Policy implications
Filial piety is a cultural value of Singapore. Singapore government emphasizes the role of family members in taking care of their aged parents. A relevant housing policy is the Married Child Priority Scheme (Singapore Housing and Development Board, 2016). The gist of this scheme is that for the application for public flats where over 80% of the population reside, priority is given to cases in which married child and the parents live together. The observed moderating effect of household size suggests that one should not merely focus on the number of household members and mechanistically assume that older adults benefit from a larger household. Attention is needed to address cognitive decline among older adults, particularly those who live with a relatively large number of people. Additional efforts to improve social integration of older adults, either through marriage retreats, or community programs such as befriending service may well reduce the negative cognitive impact of extreme sleep duration.
Conflict of interest
None.
Description of authors’ roles
Grand Cheng formulated the hypotheses, conducted the data analysis, and wrote the paper. Angelique Chan designed the study, supervised the data collection, and contributed to the writing of this paper. June Lo assisted with writing the paper.
Acknowledgments
This work was supported by Centre for Ageing Research and Education, Duke-NUS Medical School, Singapore (C-911-000-011-001).