1 Introduction
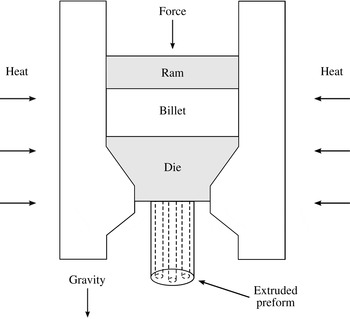
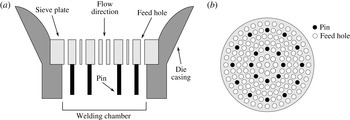
A microstructured optical fibre (MOF) consists of a thin thread of material containing a number of air channels aligned with the fibre axis that modify the optical properties. The flexibility of this design allows the fabrication of fibres with novel and useful optical properties (Knight Reference Knight2003; Monro & Ebendorff-Heidepriem Reference Monro and Ebendorff-Heidepriem2006). MOFs are manufactured by first producing a macroscopic version of the design, known as a preform, which is then drawn into a fibre. Billet extrusion (or simply extrusion) provides a promising method for fabricating soft-glass MOF preforms that is suited to automation (Ebendorff-Heidepriem & Monro Reference Ebendorff-Heidepriem and Monro2007). In this process, illustrated in figure 1, a billet of material is heated until molten and then forced through a die. The die, sketched in figure 2, contains a series of blocking elements called pins that are fixed to a sieve plate and are typically arranged to be the negative of the desired preform cross-section. The sieve plate sits across the die channel and contains a number of feed holes that allow the molten material to pass through. Once through the sieve plate, the strands of molten material fuse together around the pins inside the welding chamber. After the material emerges from the die the preform cools and solidifies. It has been observed that extruded preforms undergo so-called ‘fire polishing’ during cooling, which results in a smoother surface than found on preforms produced by other fabrication methods (Ebendorff-Heidepriem & Monro Reference Ebendorff-Heidepriem and Monro2012; Ebendorff-Heidepriem et al. Reference Ebendorff-Heidepriem, Schuppich, Dowler, Lima-Marques and Monro2014). This observation indicates that surface tension has some influence on the geometry, even if only in this limited regard.
Schematic of the extrusion process. The billet is heated and forced through the die by the ram. The blocking elements within the die give rise to the pattern of air channels in the preform.

A schematic of a typical extrusion die design modified from Ebendorff-Heidepriem & Monro (Reference Ebendorff-Heidepriem and Monro2012) showing (a) a cross-section through a typical die and (b) a corresponding representative sieve plate. The pins, arranged to be the negative of the desired geometry, are fixed to the sieve plate. The molten material flows through the feed holes and fuses around the pins inside the welding chamber before leaving the die.

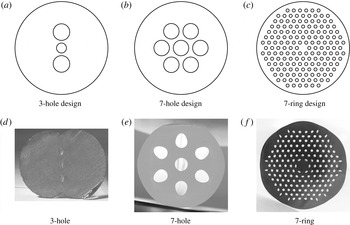
Preform extrusion enables the fabrication of a wide range of fibre designs (Monro & Ebendorff-Heidepriem Reference Monro and Ebendorff-Heidepriem2006); however, this process can lead to undesired deformation of the preform geometry. Such deformation includes changes to the shape, size and location of the air channels, the closure of air channels, and changes to the shape of the outer boundary. Some representative preform designs are shown in figure 3, along with experimental images showing typical deformation. At present the required die geometry is determined through experimentation, which is both time-consuming and costly. In some cases it is impossible to prevent unacceptable deformations. Mathematical modelling provides a promising and efficient avenue for investigating the cause of the deformation and developing strategies to overcome difficulties.
The three representative preform geometries considered in the examples presented in this study. (a–c) Show the die geometries used to extrude the preforms whose cross-sections are shown in (d–f), respectively. The
 $7$
-ring geometry contains
 $162$
interior holes. The experimental images are from (d) Manning (Reference Manning2011), (e) unpublished work in 2011 by the third author and (f) Ebendorff-Heidepriem & Monro (Reference Ebendorff-Heidepriem and Monro2007).

The slow dripping under gravity of a fluid from a circular tube was modelled by Wilson (Reference Wilson1988) to investigate the mass of the drops that break away both with and without surface tension. The model assumed the extruded fluid cylinder was slender and made use of an axial Lagrangian coordinate that labelled each cross-section by the extrusion time. The geometry predicted by this model was computed by solving a nonlinear algebraic equation. The work of Cummings & Howell (Reference Cummings and Howell1999), which used a slenderness approximation to study the stretching of solid fluid cylinders of arbitrary shape and constant mass with surface tension and gravity, is notable for the introduction of a reduced-time variable in which the transverse flow within each cross-section is independent of the axial flow. The same reduced-time variable was later used to model the drawing of thin-walled tubes (Griffiths & Howell Reference Griffiths and Howell2007, Reference Griffiths and Howell2008) and fluid cylinders of arbitrary cross-section neglecting gravity (Stokes et al. Reference Stokes, Buchak, Crowdy and Ebendorff-Heidepriem2014; Buchak et al. Reference Buchak, Crowdy, Stokes and Ebendorff-Heidepriem2015). Reduced time has also been used to study active channel pressurisation during fibre drawing (Chen et al. Reference Chen, Stokes, Buchak, Crowdy and Ebendorff-Heidepriem2015); however, the addition of pressure to the model meant that the axial and transverse problems did not decouple. Tronnolone et al. (Reference Tronnolone, Stokes, Foo and Ebendorff-Heidepriem2016) extended the work of Stokes et al. (Reference Stokes, Buchak, Crowdy and Ebendorff-Heidepriem2014) to model the stretching under gravity of fluid cylinders with internal structure and surface tension. It was shown that the model provided a good match to experimental data, suggesting that surface tension and gravity alone were responsible for the deformation observed in experiments. For a detailed review of the literature the reader is directed to the articles by Stokes et al. (Reference Stokes, Buchak, Crowdy and Ebendorff-Heidepriem2014) and Tronnolone et al. (Reference Tronnolone, Stokes, Foo and Ebendorff-Heidepriem2016).
Recently, Trabelssi et al. (Reference Trabelssi, Ebendorff-Heidepriem, Richardson, Monro and Joseph2015) constructed a model for steady-state preform extrusion taking into account the flow through and below the die. The fluid flow was modelled using the Stokes equations with constant temperature and viscosity. This work aimed to investigate the effect of a Navier-slip boundary condition imposed at boundaries inside the die. The deformation was assumed to be driven by the transition to plug flow of the fluid leaving the die. The model did not include gravity, while surface tension was neglected as unimportant due to the high viscosity. It was shown that increasing the normalised friction coefficient caused an increase in the level of deformation. By adjusting the value of this coefficient the model was able to produce deformation patterns very similar to those observed in experiments; however, this match was only produced by choosing a friction coefficient much larger than is physically realistic for the material used. Furthermore, a best fit was found by considering only one cross-section rather that matching the geometry along the entire length of the preform.
In this study we extend previous work to develop a model for preform extrusion that includes both surface tension and gravity; however, we assume plug flow at the die outlet and hence neglect the transition region in which the axial velocity profile is not uniform. Our approach is based upon the model used by Tronnolone et al. (Reference Tronnolone, Stokes, Foo and Ebendorff-Heidepriem2016) for gravitational stretching, but differs in that for the current problem it proves useful to combine the Lagrangian time coordinate used by Wilson (Reference Wilson1988) to model dripping with a modified reduced-time variable. Once again, the transverse flow decouples from the axial flow, the former of which reduces to a classical two-dimensional moving-boundary Stokes flow with unit surface tension. The axial flow model admits an exact solution that depends upon the total boundary length from the transverse flow. The structure of this model is similar to that found in other models of extensional flows and fibre drawing (Cummings & Howell Reference Cummings and Howell1999; Griffiths & Howell Reference Griffiths and Howell2007, Reference Griffiths and Howell2008; Stokes et al. Reference Stokes, Buchak, Crowdy and Ebendorff-Heidepriem2014); however, we emphasise that it is only through the careful choice of the transformed variables that the problem reduces to this simple form and that these choices form a central component of this work. Critically, the use of reduced time means that we may readily determine the shapes each cross-section may attain by solving the transverse problem, which is only possible due to the use of reduced time.
The remainder of this paper is structured as follows. The mathematical model is described in § 2 and, in § 3, is used to simulate preform extrusion from the three representative dies shown in figure 3 assuming the die is completely filled. For the
 $3$
-hole die experimental evidence indicates that the die is not completely filled during extrusion. Motivated by this, we consider extrusion from an unfilled die in § 4. Our results indicated that die effects have an important influence on the final geometry. Methods for overcoming deformation due to surface tension and gravity are discussed in § 5. We conclude in § 6 with a summary of key results and a discussion of future research.
2 Mathematical model
2.1 Formulation
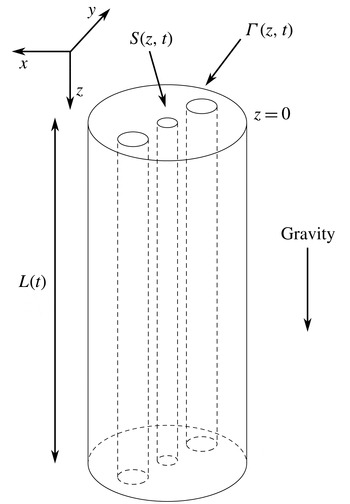
Consider a die containing an arbitrary number of pins through which is forced molten glass with volumetric flux denoted
 $Q(t)$
at time
 $t$
. As illustrated in figure 4, we initially consider a Cartesian coordinate system with the
 $z$
-axis oriented parallel to the flow of fluid out of the die, which is also the direction of gravity, so that the
 $x$
- and
 $y$
-axes are in the plane of the die exit. The corresponding velocity vector is
 $\boldsymbol{u}=(u,v,w)$
, the pressure
 $p$
and the axial length of the extruded material
 $L(t)$
. The area of the cross-section at
 $z\leqslant L(t)$
is denoted
 $S(z,t)$
and the total boundary length of each cross-section, including any internal boundaries, is denoted
 $\unicode[STIX]{x1D6E4}(z,t)$
. We denote the density by
 $\unicode[STIX]{x1D70C}$
, the viscosity by
 $\unicode[STIX]{x1D707}(x,y,z,t)$
and gravitational acceleration by
 $g$
.
A typical cylinder with internal structure. A Cartesian coordinate system is employed in which the
 $z$
-axis is directed along the axis of the cylinder, while the
 $x$
- and
 $y$
-axes are oriented in the transverse direction. The total length and cross-sectional area are denoted
 $L(t)$
and
 $S(z,t)$
, respectively, while the total boundary length of each cross-section is denoted
 $\unicode[STIX]{x1D6E4}(z,t)$
. The cylinder is aligned such that gravity acts in the direction of increasing
 $z$
.

The softened material is modelled as an incompressible Newtonian fluid, which is described by the Navier–Stokes and continuity equations,
 $$\begin{eqnarray}\displaystyle & \displaystyle \unicode[STIX]{x1D70C}\left(\frac{\unicode[STIX]{x2202}\boldsymbol{u}}{\unicode[STIX]{x2202}t}+\boldsymbol{u}\boldsymbol{\cdot }\unicode[STIX]{x1D735}\boldsymbol{u}\right)=-\unicode[STIX]{x1D735}p+\unicode[STIX]{x1D735}\boldsymbol{\cdot }[\unicode[STIX]{x1D707}(\unicode[STIX]{x1D735}\boldsymbol{u}+(\unicode[STIX]{x1D735}\boldsymbol{u})^{\text{T}})]+\unicode[STIX]{x1D70C}g\boldsymbol{k}, & \displaystyle\end{eqnarray}$$
 $$\begin{eqnarray}\displaystyle & \displaystyle \unicode[STIX]{x1D735}\boldsymbol{\cdot }\boldsymbol{u}=0, & \displaystyle\end{eqnarray}$$
 $\boldsymbol{k}$
is the unit vector in the
 $z$
-direction. We describe the external boundary as the solution to
 $G^{(0)}(\boldsymbol{x},t)=0$
and the internal boundaries as the solutions to
 $G^{(n)}(\boldsymbol{x},t)=0$
for
 $n=1,2,\ldots ,N$
, where
 $N$
is the number of internal channels. On all inner boundaries and the outer boundary we apply the dynamic and kinematic boundary conditions
 $$\begin{eqnarray}\displaystyle & \displaystyle (-p\unicode[STIX]{x1D644}+\unicode[STIX]{x1D707}[\unicode[STIX]{x1D735}\boldsymbol{u}+(\unicode[STIX]{x1D735}\boldsymbol{u})^{\text{T}}])\unicode[STIX]{x1D735}G^{(n)}=(-\unicode[STIX]{x1D6FE}\unicode[STIX]{x1D705})\unicode[STIX]{x1D735}G^{(n)}, & \displaystyle\end{eqnarray}$$
 $$\begin{eqnarray}\displaystyle & \displaystyle \frac{\unicode[STIX]{x2202}G^{(n)}}{\unicode[STIX]{x2202}t}+\boldsymbol{u}\boldsymbol{\cdot }\unicode[STIX]{x1D735}G^{(n)}=0, & \displaystyle\end{eqnarray}$$
 $\unicode[STIX]{x1D644}$
is the
 $3\times 3$
identity tensor,
 $\unicode[STIX]{x1D6FE}$
is the coefficient of surface tension and
 $\unicode[STIX]{x1D705}$
is the curvature. The curvature is defined to be positive if the unit tangent to the boundary rotates anticlockwise as the boundary is traversed with the fluid on the left-hand side. The area
 $S(0,t)$
and axial velocity
 $u(0,t)$
at the die exit
 $z=0$
are assumed known. We must also specify the value of any additional axial force applied to the extruded glass; however, during preform extrusion this will typically be zero.
We introduce the characteristic area
 ${\mathcal{S}}$
, which is the fluid area at the die exit, a characteristic volumetric flux through the die exit
 ${\mathcal{Q}}$
and a characteristic length scale
 ${\mathcal{L}}$
, the last of which will be defined below. The velocity scale
 ${\mathcal{U}}$
is taken to be a representative axial velocity at the die exit related to the characteristic area and flux by
 ${\mathcal{Q}}={\mathcal{S}}{\mathcal{U}}$
, while the time scale is
 ${\mathcal{L}}/{\mathcal{U}}={\mathcal{L}}{\mathcal{S}}/{\mathcal{Q}}$
. In a typical preform extrusion the temperature varies with both position and time; however, as in previous work on fibre drawing (Stokes et al.
Reference Stokes, Buchak, Crowdy and Ebendorff-Heidepriem2014; Buchak et al.
Reference Buchak, Crowdy, Stokes and Ebendorff-Heidepriem2015; Chen et al.
Reference Chen, Stokes, Buchak, Crowdy and Ebendorff-Heidepriem2015) and gravitational extension of a fluid cylinder (Tronnolone et al.
Reference Tronnolone, Stokes, Foo and Ebendorff-Heidepriem2016), we assume that the temperature profile is known. The viscosity depends only on temperature, so is thus assumed known and scaled
 $\unicode[STIX]{x1D707}=\unicode[STIX]{x1D707}_{0}\unicode[STIX]{x1D707}^{\ast }$
for some characteristic viscosity
 $\unicode[STIX]{x1D707}_{0}$
. The slenderness ratio
 $\unicode[STIX]{x1D716}=\sqrt{{\mathcal{S}}}/{\mathcal{L}}$
is, neglecting an initial start-up time, assumed small so that the extruded preform is slender.
We introduce the scaled variables
 $$\begin{eqnarray}\displaystyle \left.\begin{array}{@{}c@{}}\displaystyle (x,y,z)={\mathcal{L}}(\unicode[STIX]{x1D716}\hat{x},\unicode[STIX]{x1D716}{\hat{y}},\hat{z}),\quad t=\frac{{\mathcal{L}}}{U}\hat{t},\quad (u,v,w)=U(\unicode[STIX]{x1D716}\hat{u} ,\unicode[STIX]{x1D716}\hat{v},{\hat{w}}),\\ \displaystyle S={\mathcal{S}}{\hat{S}},\quad \unicode[STIX]{x1D6E4}=\unicode[STIX]{x1D716}{\mathcal{L}}\hat{\unicode[STIX]{x1D6E4}},\quad Q={\mathcal{Q}}\hat{Q}.\end{array}\right\} & & \displaystyle\end{eqnarray}$$
From this point onwards we drop carets from dimensionless variables but will retain asterisks on scaled parameters for later convenience. The ratio of gravitational forces to viscous forces is
 $$\begin{eqnarray}\displaystyle g^{\ast }=\frac{\unicode[STIX]{x1D70C}g{\mathcal{L}}^{2}}{\unicode[STIX]{x1D707}_{0}{\mathcal{U}}}=\frac{Re}{Fr^{2}}, & & \displaystyle\end{eqnarray}$$
where
 $Re=\unicode[STIX]{x1D70C}{\mathcal{U}}{\mathcal{L}}/\unicode[STIX]{x1D707}_{0}$
is the Reynolds number and
 $Fr={\mathcal{U}}/\sqrt{g{\mathcal{L}}}$
is the Froude number. We assume that
 $g^{\ast }$
is
 $O(1)$
and so fix the axial length scale
 ${\mathcal{L}}$
by setting
 $g^{\ast }=1$
. With this choice the length scale, Reynolds number, dimensionless surface-tension parameter and time scale are, respectively,
 $$\begin{eqnarray}\displaystyle {\mathcal{L}}=\sqrt{\frac{\unicode[STIX]{x1D707}_{0}{\mathcal{Q}}}{\unicode[STIX]{x1D70C}g{\mathcal{S}}}},\quad Re=\sqrt{\frac{\unicode[STIX]{x1D70C}{\mathcal{Q}}^{3}}{\unicode[STIX]{x1D707}_{0}g{\mathcal{S}}^{3}}},\quad \unicode[STIX]{x1D6FE}^{\ast }=\frac{\unicode[STIX]{x1D6FE}}{\sqrt{\unicode[STIX]{x1D707}_{0}\unicode[STIX]{x1D70C}g{\mathcal{Q}}}},\quad \frac{{\mathcal{L}}}{{\mathcal{U}}}=\sqrt{\frac{\unicode[STIX]{x1D707}_{0}{\mathcal{S}}}{\unicode[STIX]{x1D70C}g{\mathcal{Q}}}}. & & \displaystyle\end{eqnarray}$$
The parameter
 $\unicode[STIX]{x1D6FE}^{\ast }$
is an inverse Bond number and is equivalent to the dimensionless parameter found by (Wilson Reference Wilson1988, p. 564, equation (17)), differing only by a factor of
 $3/\sqrt{\unicode[STIX]{x03C0}}$
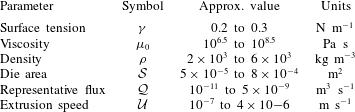
. Typical values for the material properties and other parameters for MOF preform extrusion are given in table 1, which yield a length scale
 ${\mathcal{L}}$
of between 1 and 10 cm, a Reynolds number
 $Re$
of
 $O(10^{-11})$
, a dimensionless surface tension
 $\unicode[STIX]{x1D6FE}^{\ast }$
of
 $O(10^{-1})$
, and a slenderness ratio
 $\unicode[STIX]{x1D716}$
of
 $O(10^{-2})$
.
Typical parameter values for preform extrusion.

For small times
 $t$
the extruded cylinder is shorter than the length
 ${\mathcal{L}}$
, and thus the slenderness ratio
 $\unicode[STIX]{x1D716}$
is not a true measure of the geometry. As such, initially the extruded cylinder cannot be considered slender. We here assume that the error introduced by applying the slenderness approximation for early times is small. In practice, the lower end of a MOF preform, which is extruded first, consists of threads of fluid that have not properly welded in the die, and is discarded. A consequence of this is that the region above this, which is retained, may be considered slender for all times.
Applying a slenderness approximation to the governing equations (2.1) and boundary conditions (2.2), in a similar manner to that of Tronnolone et al. (Reference Tronnolone, Stokes, Foo and Ebendorff-Heidepriem2016) for a stretching cylinder, results in a one-dimensional model for the axial flow and a two-dimensional model for the transverse flow.
2.2 The axial problem
The fluid flow in the axial direction is described by the cross-sectional area
 $S(z,t)$
and axial velocity
 $w(z,t)$
, which are governed by the equations
 $$\begin{eqnarray}\displaystyle & \displaystyle S_{t}+(wS)_{z}=0, & \displaystyle\end{eqnarray}$$
 $$\begin{eqnarray}\displaystyle & \displaystyle -(3\unicode[STIX]{x1D707}^{\ast }Sw_{z})_{z}=Sg^{\ast }+\frac{\unicode[STIX]{x1D6FE}^{\ast }}{2}\unicode[STIX]{x1D6E4}_{z}, & \displaystyle\end{eqnarray}$$
 $\unicode[STIX]{x1D6E4}$
. The parameters
 $g^{\ast }$
and
 $\unicode[STIX]{x1D6FE}^{\ast }$
are defined in (2.4). Following Wilson (Reference Wilson1988), we introduce an axial Lagrangian coordinate
 $\unicode[STIX]{x1D702}$
that labels each cross-section with the time at which it leaves the die, illustrated in figure 5. The cross-section that leaves the die at time
 $t=0$
has Lagrangian coordinate
 $\unicode[STIX]{x1D702}=0$
, and at any subsequent time
 $t>0$
the value of
 $\unicode[STIX]{x1D702}$
increases from
 $\unicode[STIX]{x1D702}=0$
at the lower end of the preform to
 $\unicode[STIX]{x1D702}=t$
at the die exit. Thus,
 $\unicode[STIX]{x1D702}$
is defined as the solution to
 $z(\unicode[STIX]{x1D702},\unicode[STIX]{x1D702})=0$
, where
 $z=z(\unicode[STIX]{x1D702},t)$
. In order to relate
 $\unicode[STIX]{x1D702}$
and
 $z$
we must consider the flux of material through the die. In the region between
 $\unicode[STIX]{x1D702}$
and
 $\unicode[STIX]{x1D702}+\text{d}\unicode[STIX]{x1D702}$
we have that
 $$\begin{eqnarray}\displaystyle Q\,\text{d}\unicode[STIX]{x1D702}=-S\,\text{d}z, & & \displaystyle\end{eqnarray}$$
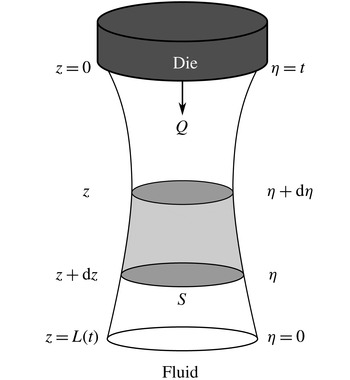
Illustration of the Cartesian coordinate
 $z$
(left-hand side) and Lagrangian coordinate
 $\unicode[STIX]{x1D702}$
(right-hand side) for an extruded fluid cylinder. The coordinate
 $\unicode[STIX]{x1D702}$
labels each cross-section with the time at which it leaves the die, so that
 $\unicode[STIX]{x1D702}$
is defined as the solution to
 $z(\unicode[STIX]{x1D702},\unicode[STIX]{x1D702})=0$
, where
 $z=z(\unicode[STIX]{x1D702},t)$
. Fluid is extruded from the die at the volumetric flow rate
 $Q(t)$
and has cross-sectional area
 $S(z,t)$
. Enforcing conservation of mass within the shaded region shows that
 $Q\,\text{d}\unicode[STIX]{x1D702}=-S\,\text{d}z$
.

so that in the limit as
 $\text{d}\unicode[STIX]{x1D702}$
and
 $\text{d}z$
go to zero we have
 $$\begin{eqnarray}\displaystyle \frac{\unicode[STIX]{x2202}z}{\unicode[STIX]{x2202}\unicode[STIX]{x1D702}}=-\frac{Q}{S}. & & \displaystyle\end{eqnarray}$$
Integrating (2.7), with the condition that
 $z(\unicode[STIX]{x1D702},\unicode[STIX]{x1D702})=0,$
yields
 $$\begin{eqnarray}\displaystyle z(\unicode[STIX]{x1D702},t)=\int _{\unicode[STIX]{x1D702}}^{t}\frac{Q(t)}{S(\unicode[STIX]{x1D702},t)}\,\text{d}\unicode[STIX]{x1D702}^{\prime }. & & \displaystyle\end{eqnarray}$$
We introduce the total axial tension
 $\unicode[STIX]{x1D70E}^{\ast }$
, defined by
 $$\begin{eqnarray}\displaystyle 6\unicode[STIX]{x1D70E}^{\ast }(\unicode[STIX]{x1D702},t)=V(\unicode[STIX]{x1D702})+c(t), & & \displaystyle\end{eqnarray}$$
where
 $$\begin{eqnarray}\displaystyle V(\unicode[STIX]{x1D702})=\int _{0}^{\unicode[STIX]{x1D702}}Q(t^{\prime })\,\text{d}t^{\prime } & & \displaystyle\end{eqnarray}$$
is the dimensionless weight of material below cross-section
 $\unicode[STIX]{x1D702}$
and
 $c(t)$
represents any additional axial tension set by the boundary conditions. Transforming to the Lagrangian coordinate
 $\unicode[STIX]{x1D702}$
and integrating over the length of the cylinder, the axial system (2.5) reduces to
 $$\begin{eqnarray}\displaystyle 3\unicode[STIX]{x1D707}^{\ast }\frac{\text{D}S}{\text{D}t}=-6\unicode[STIX]{x1D70E}^{\ast }+\frac{\unicode[STIX]{x1D6FE}^{\ast }}{2}\unicode[STIX]{x1D6E4}, & & \displaystyle\end{eqnarray}$$
where
 $$\begin{eqnarray}\displaystyle \frac{\text{D}}{\text{D}t}=\frac{\unicode[STIX]{x2202}}{\unicode[STIX]{x2202}t}+w\frac{\unicode[STIX]{x2202}}{\unicode[STIX]{x2202}z} & & \displaystyle\end{eqnarray}$$
is the material derivative. The axial equation (2.11) involves both the area
 $S$
and the total boundary length
 $\unicode[STIX]{x1D6E4}$
, which, for a general geometry, cannot be related directly. This system is closed by considering the transverse problem.
2.3 The transverse problem and reduced time
Following Cummings & Howell (Reference Cummings and Howell1999), we introduce scaled transverse coordinates and variables, denoted by tildes, given by
 $$\begin{eqnarray}\displaystyle (\tilde{x},{\tilde{y}})=\frac{1}{\unicode[STIX]{x1D712}}(x,y),\quad \tilde{p}=\frac{\unicode[STIX]{x1D712}}{\unicode[STIX]{x1D6FE}^{\ast }}(p-p_{ZST}),\quad (\tilde{u} ,\tilde{v})=\frac{\unicode[STIX]{x1D707}^{\ast }}{\unicode[STIX]{x1D6FE}^{\ast }}[(u,v)-(u_{ZST},v_{ZST})], & & \displaystyle \nonumber\\ \displaystyle & & \displaystyle\end{eqnarray}$$
where
 $(p_{ZST},u_{ZST},v_{ZST})$
is the zero-surface-tension eigensolution (Stokes et al.
Reference Stokes, Buchak, Crowdy and Ebendorff-Heidepriem2014) and
 $\unicode[STIX]{x1D712}=\sqrt{S}$
. We also introduce the reduced time
 $$\begin{eqnarray}\displaystyle \unicode[STIX]{x1D70F}(\unicode[STIX]{x1D702},t)=\int _{\unicode[STIX]{x1D702}}^{t}\frac{\unicode[STIX]{x1D6FE}^{\ast }}{\unicode[STIX]{x1D707}^{\ast }\unicode[STIX]{x1D712}}\,\text{d}t^{\prime }. & & \displaystyle\end{eqnarray}$$
This definition is similar in form to that of Cummings & Howell (Reference Cummings and Howell1999), but uses different limits of integration so that every cross-section leaves the die with
 $\unicode[STIX]{x1D70F}=0$
(that is, with no deformation). Since
 $\unicode[STIX]{x1D70F}=\unicode[STIX]{x1D70F}(\unicode[STIX]{x1D702},t)$
for
 $t\geqslant \unicode[STIX]{x1D702}$
, at time
 $t$
each cross-section is associated with a different reduced time; however, as each cross-section has the same initial geometry, being the negative of the die, every cross-section has the same associated transverse problem. Finally, introducing
 $\tilde{G}^{(n)}(\tilde{x},{\tilde{y}},\tilde{z},t)=G^{(n)}(x,y,z,t)$
for
 $n=0,1,2,\ldots ,N$
, the transverse problem reduces to
 $$\begin{eqnarray}\displaystyle & \displaystyle \tilde{u} _{\tilde{x}}+\tilde{v}_{{\tilde{y}}}=0, & \displaystyle\end{eqnarray}$$
 $$\begin{eqnarray}\displaystyle & \displaystyle \tilde{u} _{\tilde{x}\tilde{x}}+\tilde{u} _{{\tilde{y}}{\tilde{y}}}=\tilde{p}_{\tilde{x}}, & \displaystyle\end{eqnarray}$$
 $$\begin{eqnarray}\displaystyle & \displaystyle \tilde{v}_{\tilde{x}\tilde{x}}+\tilde{v}_{{\tilde{y}}{\tilde{y}}}=\tilde{p}_{{\tilde{y}}}, & \displaystyle\end{eqnarray}$$
 $$\begin{eqnarray}\displaystyle & \displaystyle -pn_{1}+2\tilde{u} _{\tilde{x}}n_{1}+(\tilde{u} _{{\tilde{y}}}+\tilde{v}_{\tilde{x}})n_{3}=-\tilde{\unicode[STIX]{x1D705}}n_{1}\quad \text{on }\tilde{G}^{(n)}=0, & \displaystyle\end{eqnarray}$$
 $$\begin{eqnarray}\displaystyle & \displaystyle -pn_{2}+(\tilde{u} _{{\tilde{y}}}+\tilde{v}_{\tilde{x}})n_{1}+2\tilde{v}_{{\tilde{y}}}n_{2}=-\tilde{\unicode[STIX]{x1D705}}n_{2}\quad \text{on }\tilde{G}^{(n)}=0, & \displaystyle\end{eqnarray}$$
 $$\begin{eqnarray}\displaystyle & \displaystyle \tilde{G}_{\unicode[STIX]{x1D70F}}^{(n)}+\tilde{u} \tilde{G}_{\tilde{x}}^{(n)}+\tilde{v}\tilde{G}_{{\tilde{y}}}^{(n)}=0\quad \text{on }\tilde{G}^{(n)}=0. & \displaystyle\end{eqnarray}$$
If there is no known exact solution for a given geometry then (2.15) must be solved using a numerical method, such as the spectral methods described by Buchak et al. (Reference Buchak, Crowdy, Stokes and Ebendorff-Heidepriem2015) and Tronnolone (Reference Tronnolone2016), which are designed for moving-boundary Stokes flow problems such as (2.15). In these methods a conformal map constructed from complex series is used to transform the physical geometry into a canonical region in the complex plane on which the problem is readily solved. The Goursat functions are approximated using complex series for which the coefficients at any time step are found using the boundary conditions (2.15d ) and (2.15e ), while the map coefficients are updated using (2.15f ) and a Runge–Kutta integration scheme. Solutions for geometries with a circular outer boundary and elliptical inner boundaries may be found using the elliptical pore model of Buchak et al. (Reference Buchak, Crowdy, Stokes and Ebendorff-Heidepriem2015). Given enough time, surface tension will close all holes and leave the outer boundary circular. The numerical methods used here cannot compute the solution beyond the closure of a hole; however, as hole closure is undesirable during preform fabrication we exclude this possibility.
Solving the transverse problem (2.15) yields the scaled boundary length
 $\tilde{\unicode[STIX]{x1D6E4}}(\unicode[STIX]{x1D70F})$
, which is related to the quantity
 $\unicode[STIX]{x1D6E4}$
in (2.11) by
 $$\begin{eqnarray}\displaystyle \unicode[STIX]{x1D6E4}(\unicode[STIX]{x1D702},\unicode[STIX]{x1D70F})=\unicode[STIX]{x1D712}(\unicode[STIX]{x1D702},\unicode[STIX]{x1D70F})\tilde{\unicode[STIX]{x1D6E4}}(\unicode[STIX]{x1D70F}). & & \displaystyle\end{eqnarray}$$
The quantity
 $\tilde{\unicode[STIX]{x1D6E4}}$
is a function of
 $\unicode[STIX]{x1D70F}$
only because each cross-section has the same associated transverse problem. Transforming the axial equation (2.11) to reduced time and substituting for
 $\unicode[STIX]{x1D6E4}$
in terms of
 $\tilde{\unicode[STIX]{x1D6E4}}$
yields
 $$\begin{eqnarray}\displaystyle \frac{\text{D}\unicode[STIX]{x1D712}}{\text{D}\unicode[STIX]{x1D70F}}-\frac{1}{12}\unicode[STIX]{x1D712}\tilde{\unicode[STIX]{x1D6E4}}=-\frac{\unicode[STIX]{x1D70E}^{\ast }}{\unicode[STIX]{x1D6FE}^{\ast }}, & & \displaystyle\end{eqnarray}$$
which is simply a linear differential equation for
 $\unicode[STIX]{x1D712}$
and has solution
 $$\begin{eqnarray}\displaystyle \unicode[STIX]{x1D712}(\unicode[STIX]{x1D702},\unicode[STIX]{x1D70F})=\frac{1}{H(\unicode[STIX]{x1D70F})}\left(1-\frac{1}{\unicode[STIX]{x1D6FE}^{\ast }}\int _{0}^{\unicode[STIX]{x1D70F}}\unicode[STIX]{x1D70E}^{\ast }H(\unicode[STIX]{x1D70F})\,\text{d}\unicode[STIX]{x1D70F}^{\prime }\right), & & \displaystyle\end{eqnarray}$$
where
 $$\begin{eqnarray}\displaystyle H(\unicode[STIX]{x1D70F})=\exp \left(-\frac{1}{12}\int _{0}^{\unicode[STIX]{x1D70F}}\tilde{\unicode[STIX]{x1D6E4}}(\unicode[STIX]{x1D70F}^{\prime })\,\text{d}\unicode[STIX]{x1D70F}^{\prime }\right). & & \displaystyle\end{eqnarray}$$
The function
 $H(\unicode[STIX]{x1D70F})$
is an integrating factor identical to the function employed by Stokes et al. (Reference Stokes, Buchak, Crowdy and Ebendorff-Heidepriem2014) and Buchak et al. (Reference Buchak, Crowdy, Stokes and Ebendorff-Heidepriem2015) in problems without gravity. A similar function was used by Tronnolone et al. (Reference Tronnolone, Stokes, Foo and Ebendorff-Heidepriem2016) to model a fluid cylinder stretching under gravity, in which case the boundary length
 $\tilde{\unicode[STIX]{x1D6E4}}$
, and hence so too the integrating factor, depended upon both reduced time and an axial Lagrangian coordinate. Typically, the integrals in (2.18) and (2.19) must be computed numerically.
Finally, for any cross-section
 $\unicode[STIX]{x1D702}$
we note that at the time of extrusion
 $t=\unicode[STIX]{x1D702}$
we must have
 $\unicode[STIX]{x1D70F}=0$
. Thus, manipulating (2.14) results in the relationship
 $$\begin{eqnarray}\displaystyle \int _{0}^{\unicode[STIX]{x1D70F}}\unicode[STIX]{x1D712}\,\text{d}\unicode[STIX]{x1D70F}^{\prime }=\int _{\unicode[STIX]{x1D702}}^{t}\frac{\unicode[STIX]{x1D6FE}^{\ast }}{\unicode[STIX]{x1D707}^{\ast }}\,\text{d}t^{\prime }=\frac{\unicode[STIX]{x1D6FE}^{\ast }(t-\unicode[STIX]{x1D702})}{m(\unicode[STIX]{x1D702},t)}, & & \displaystyle\end{eqnarray}$$
where
 $$\begin{eqnarray}\displaystyle m(\unicode[STIX]{x1D702},t)=\frac{t-\unicode[STIX]{x1D702}}{\displaystyle \int _{\unicode[STIX]{x1D702}}^{t}\frac{1}{\unicode[STIX]{x1D707}^{\ast }(\unicode[STIX]{x1D702},t^{\prime })}\,\text{d}t^{\prime }} & & \displaystyle\end{eqnarray}$$
is the harmonic mean of
 $\unicode[STIX]{x1D707}^{\ast }(\unicode[STIX]{x1D702},t)$
for cross-section
 $\unicode[STIX]{x1D702}$
between times
 $\unicode[STIX]{x1D702}$
and
 $t\geqslant \unicode[STIX]{x1D702}$
. Given values for
 $\unicode[STIX]{x1D702}$
and
 $t$
we can compute the associated reduced time
 $\unicode[STIX]{x1D70F}$
by solving (2.20) numerically. This provides a complete general solution to the extrusion problem.
Up to this point we have allowed the additional tension
 $c(t)$
, which contributes to the axial tension
 $\unicode[STIX]{x1D70E}^{\ast }$
, to be a function of time. In order to evaluate the integrals in (2.18) and (2.19) we must know
 $c(t)$
as a function of reduced time
 $\unicode[STIX]{x1D70F}$
, which greatly complicates the solution process. In all of the examples from this point onwards we assume that
 $c(t)\equiv 0$
, as is typical in preform extrusion.
3 Extrusion assuming a filled die
3.1 Geometry and parameters
Using the model developed in § 2 we now investigate the extrusion of the three typical MOF preform designs, shown in figure 3, which we refer to as the
 $3$
-hole,
 $7$
-hole and
 $7$
-ring preforms, the last of which contains
 $162$
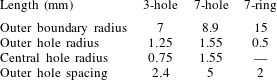
interior holes. The dimensions of each preform are given in table 2. In these examples we assume that the die is completely filled in the vicinity of the exit. The primary goals of this section are to determine (1) whether surface tension causes significant deformation during preform extrusion and (2) whether this matches the deformation observed in experiments. The amount of deformation due to surface tension in a given cross-section is described by the magnitude of the associated reduced time
 $\unicode[STIX]{x1D70F}$
, with larger values of
 $\unicode[STIX]{x1D70F}$
indicating greater deformation. While
 $\unicode[STIX]{x1D70F}$
necessarily increases with time
 $t$
, if this increase is small then the deformations due to surface tension will be minimal in practice. Thus, to answer the first question we must determine whether
 $\unicode[STIX]{x1D70F}$
becomes large enough for surface-tension-driven deformations of the cross-sections to be observed. For the purposes of this analysis we consider noticeable deformation to have occurred for reduced time
 $\unicode[STIX]{x1D70F}\geqslant 10^{-2}$
. The second question is answered by comparing the model geometries to the experimental observations shown in figure 3.
Dimensions of the
 $3$
-hole,
 $7$
-hole and
 $7$
-ring preforms. For the
 $3$
-hole and
 $7$
-hole designs the outer hole spacing is the distance between the centres of the outer holes and the centre of the geometry. For the
 $7$
-ring design this quantity is the spacing between adjacent holes.

Extrusion conditions for the three experiments shown in figure 3(d–f) are given by Manning (Reference Manning2011), Ebendorff-Heidepriem & Monro (Reference Ebendorff-Heidepriem and Monro2007) and in unpublished work by the third author, respectively, which we summarise here briefly. The
 $3$
- and
 $7$
-hole preforms were fabricated using lead flint glass (F2), while the
 $7$
-ring preform was made from lead silicate glass (SF57), both produced by the Schott Glass Company and commonly used in optical technology (Ebendorff-Heidepriem & Monro Reference Ebendorff-Heidepriem and Monro2007). Values for the coefficient of surface tension and the density for both glasses, as given by Boyd et al. (Reference Boyd, Ebendorff-Heidepriem, Monro and Munch2012) and the Schott Glass Company (2015), respectively, are listed in table 3. In a typical MOF preform extrusion the flux is held constant so we set
 $Q(t)\equiv 1$
. We also assume that the temperature below the die is the same as the temperature within the die so that the viscosity is constant and, hence, take
 $\unicode[STIX]{x1D707}^{\ast }\equiv m\equiv 1$
. Values for
 $\unicode[STIX]{x1D707}_{0}$
correspond to the extrusion temperatures; however, the results are sensitive to the precise values chosen. For the
 $3$
- and
 $7$
-hole preforms the billet diameter is 30 mm, which means that the billet has cross-sectional area
 ${\mathcal{S}}_{b}=2.25\unicode[STIX]{x03C0}\times 10^{-4}~\text{m}^{2}$
. For the
 $7$
-ring preform the billet has diameter 50 mm and hence cross-sectional area
 ${\mathcal{S}}_{b}=6.25\unicode[STIX]{x03C0}\times 10^{-4}~\text{m}^{2}$
. The billet length for the
 $3$
-hole and
 $7$
-ring preforms is
 ${\mathcal{L}}_{b}=30~\text{mm}$
, while for the
 $7$
-hole preform the length is
 ${\mathcal{L}}_{b}=68~\text{mm}$
. The velocity at the die is constant and is set by the ram speed, here taken to be
 ${\mathcal{U}}_{b}=0.1~\text{mm}~\text{min}^{-1}\approx 1.66\times 10^{-2}~\text{m}~\text{s}^{-1}$
. By conservation of mass, the flux scale is
 $$\begin{eqnarray}\displaystyle {\mathcal{Q}}={\mathcal{S}}{\mathcal{U}}={\mathcal{S}}_{b}{\mathcal{U}}_{b}. & & \displaystyle\end{eqnarray}$$
Rearranging this expression shows that the corresponding extrusion velocity is
 $$\begin{eqnarray}\displaystyle {\mathcal{U}}=\frac{{\mathcal{S}}_{b}{\mathcal{U}}_{b}}{{\mathcal{S}}}. & & \displaystyle\end{eqnarray}$$
We assume that extrusion continues until all of the material has been used up, so that the dimensionless extrusion time is
 $$\begin{eqnarray}\displaystyle t_{f}=\frac{{\mathcal{L}}_{b}}{{\mathcal{U}}_{b}}. & & \displaystyle\end{eqnarray}$$
In dimensional units the
 $3$
-hole and
 $7$
-ring extrusions take 300 min, while the
 $7$
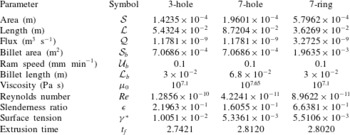
-hole extrusion takes 680 min. In practice some of the glass remains inside the die and cannot be forced out by the ram, but this does not significantly change the model results. The values of the scales and dimensionless parameters for each example are given in table 4.
Physical properties for F2 and SF57 glasses relevant to the extrusion examples. The values for the coefficients of surface tension were found by Boyd et al. (Reference Boyd, Ebendorff-Heidepriem, Monro and Munch2012), while the densities were given by the Schott Glass Company (2015).


3.2 3-hole preform
The transverse problem associated with the
 $3$
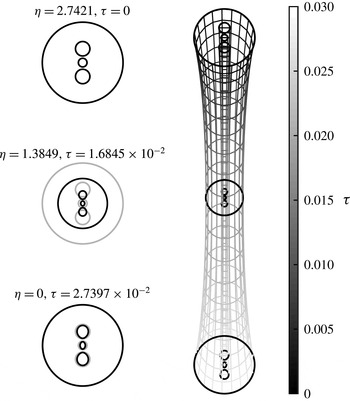
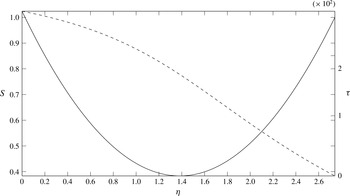
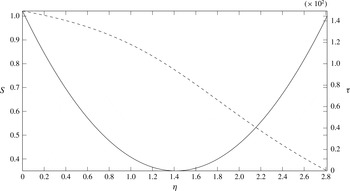
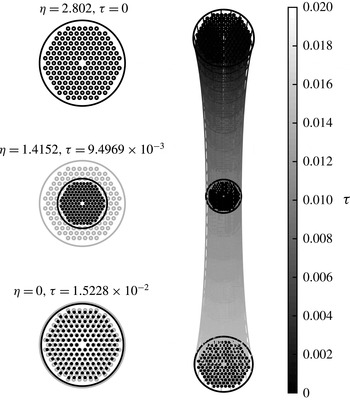
-hole geometry is readily solved using the spectral numerical method described by Tronnolone (Reference Tronnolone2016). The predicted preform geometry is shown in figure 6 along with cross-sections from the top, middle and bottom of the preform. The final physical length of the preform is 27.5 cm, which is comparable to the lengths observed in practice. Figure 7 shows the area
 $S$
and reduced time
 $\unicode[STIX]{x1D70F}$
plotted against
 $\unicode[STIX]{x1D702}$
at the end of the extrusion. The area is larger than unity at
 $\unicode[STIX]{x1D702}=0$
due to the compressive effect of surface tension in the axial direction and the absence of gravitational stretching. Over half of the preform has a reduced time greater than
 $10^{-2}$
, and the plotted cross-sections show that these values of
 $\unicode[STIX]{x1D70F}$
are sufficiently large for the interior holes to display surface-tension-driven deformation. The maximum reduced time is
 $\unicode[STIX]{x1D70F}=2.7397\times 10^{-2}$
, which occurs at the free end
 $\unicode[STIX]{x1D702}=0$
of the preform. The value of
 $\unicode[STIX]{x1D70F}$
decreases with
 $\unicode[STIX]{x1D702}$
to zero at the die, where there is no deformation.
The three inner boundaries show similar behaviour to that seen in the experimental result of Manning (Reference Manning2011) from figure 3(f): the central hole elongates along the axis through the three holes, while the two outer holes show higher curvature on the ends nearer to the inner hole than on the ends nearer to the outer boundary. In contrast, the outer boundary shows significantly different behaviour. In the experiment this boundary developed cusp-like regions at both sides of the preform nearest to the internal boundaries, which are not captured by the model.
The extruded
 $3$
-hole preform plotted in the scaled Eulerian coordinates
 $(x,y,z)$
. The shade represents the value of
 $\unicode[STIX]{x1D70F}$
from zero at the die to almost
 $0.03$
at the free end. Highlighted in black are three cross-sections, at the top, middle and bottom of the preform, that are plotted left along with the initial condition (grey). The physical length of the preform is 27.5 cm.

The area
 $S$
(solid) and reduced time
 $\unicode[STIX]{x1D70F}$
(dashed) plotted against position
 $\unicode[STIX]{x1D702}$
for the extruded
 $3$
-hole preform. The area is larger than unity at
 $\unicode[STIX]{x1D702}=0$
(the free end of the preform), while the value of
 $\unicode[STIX]{x1D70F}$
decreases with
 $\unicode[STIX]{x1D702}$
. Over half of the preform has a reduced time greater than
 $10^{-2}$
, corresponding to noticeable surface-tension-driven deformation.

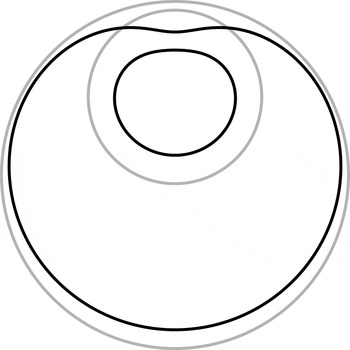
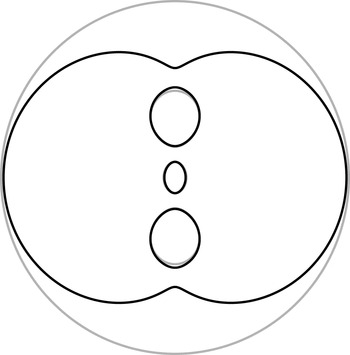
In order to show that surface tension cannot cause cusp-like deformations in the outer boundary we consider an extreme geometry featuring one interior hole with radius half that of the outer boundary and centred 45 % of this distance above the centre of the outer boundary. This geometry was first studied in numerical simulations by van de Vorst (Reference van de Vorst1993). The initial condition is shown in figure 8, along with the solution computed by the spectral method at
 $\unicode[STIX]{x1D70F}=0.08$
. While the outer boundary shows some deformation, this is not as extreme as the deformation observed in experiments. Since a large interior hole, which should have a strong influence on the outer boundary, does not produce cusp-like deformations in the outer boundary, and moving the hole away from the external boundary reduces its influence, we conclude that these deformations cannot arise due to surface tension alone.
The initial condition (grey) and solution at
 $\unicode[STIX]{x1D70F}=0.08$
(black) for the extreme geometry with a single large hole close to the external boundary. While the outer boundary shows some deformation, this is less pronounced than that observed in the experiments by Manning (Reference Manning2011).

3.3 7-hole preform
The transverse problem associated with the
 $7$
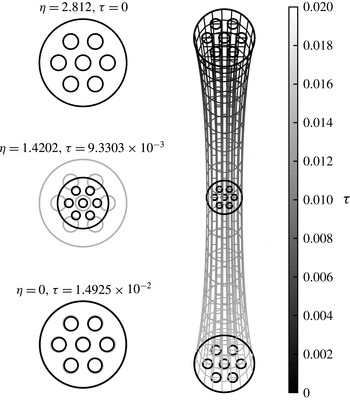
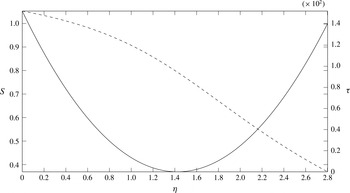
-hole geometry is again solved using the spectral numerical method of Tronnolone (Reference Tronnolone2016). The extruded preform geometry is plotted in figure 9, while the area and reduced time at the end of the extrusion are plotted against
 $\unicode[STIX]{x1D702}$
in figure 10. The physical length of the preform is 48 cm, which is close to lengths obtained experimentally. This preform is larger than the
 $3$
-hole preform, as the latter used a billet of smaller mass. At the middle of the preform the area is less than half of the area at the die, while the area at the free end
 $\unicode[STIX]{x1D702}=0$
is slightly greater than the initial value. The largest reduced time
 $\unicode[STIX]{x1D70F}$
is
 $1.4925\times 10^{-2}$
, which occurs at
 $\unicode[STIX]{x1D702}=0$
, and approximately half of the preform has a reduced time
 $\unicode[STIX]{x1D70F}>10^{-2}$
, which is sufficiently large for noticeable surface-tension-driven deformation to occur. The shape of the
 $\unicode[STIX]{x1D70F}$
versus
 $\unicode[STIX]{x1D702}$
curve (figure 10) is similar to that obtained for the
 $3$
-hole preform. Despite the preform showing noticeable deformation due to surface tension, the shapes of the interior holes are much more circular than those observed in the experiment shown in figure 3(e). In particular, the six outer holes do not match the asymmetric deformation of the corresponding holes observed in experiments. Even if the transverse problem is solved up to larger values of reduced time the computed solution shows only a weak qualitative match to the experimental result. We thus conclude that the deformation observed experimentally is not simply due to surface tension. We will return to this later in § 3.5.
The extruded
 $7$
-hole preform plotted in the scaled Eulerian coordinates
 $(x,y,z)$
. The shade represents the value of
 $\unicode[STIX]{x1D70F}$
from zero at the die exit to
 $1.4925\times 10^{-2}$
at the free end. Highlighted in black are three cross-sections, at the top, middle and bottom of the preform, that are plotted left along with the initial condition (grey). The physical length of the preform is 48 cm.

The area
 $S$
(solid) and reduced time
 $\unicode[STIX]{x1D70F}$
(dashed) plotted against position
 $\unicode[STIX]{x1D702}$
for the extruded
 $7$
-hole preform. The area at the middle of the preform is less than half of the area at the die, while the area has increased near the free end, cross-section
 $\unicode[STIX]{x1D702}=0$
. Approximately half of the preform has a reduced time greater than
 $10^{-2}$
, corresponding to significant surface-tension-driven deformation in this region.

3.4 7-ring preform
Due to the large number of elliptical interior boundaries, the
 $7$
-ring transverse problem is solved using the elliptical pore model of Buchak et al. (Reference Buchak, Crowdy, Stokes and Ebendorff-Heidepriem2015). The extruded
 $7$
-ring preform geometry is shown in figure 11, while the area and reduced time at the end of the extrusion are plotted against
 $\unicode[STIX]{x1D702}$
in figure 12. This preform is only 19.1 cm long, which is smaller than the previous two examples due to a larger cross-sectional area at the die exit. The maximum reduced time is
 $\unicode[STIX]{x1D70F}=1.5228\times 10^{-2}$
, which occurs at
 $\unicode[STIX]{x1D702}=0$
, which is large enough for surface-tension-driven deformation to become noticeable, and approximately half of the preform has a reduced time greater than
 $10^{-2}$
, indicating significant deformation in this region. As
 $\unicode[STIX]{x1D70F}$
increases, all of the boundaries reduce in size and increase in eccentricity; however, all the holes remain more circular than observed in experiments.
The extruded
 $7$
-ring preform plotted in the scaled Eulerian coordinates
 $(x,y,z)$
. The shade represents the value of
 $\unicode[STIX]{x1D70F}$
from zero at the die exit to
 $1.5228\times 10^{-2}$
at the free end. Highlighted in black are three cross-sections, at the top, middle and bottom of the preform, that are plotted left along with the initial condition (grey). The physical length of the preform is 19.1 cm.

The area
 $S$
(solid) and reduced time
 $\unicode[STIX]{x1D70F}$
(dashed) plotted against position
 $\unicode[STIX]{x1D702}$
for the extruded
 $7$
-ring preform. Approximately half of the preform has a reduced time greater than
 $10^{-2}$
, corresponding to significant surface-tension-driven deformation in this region.

3.5 Changing the inner-hole spacing
While the
 $3$
-hole example presented above had some features that provided a good qualitative match to experimental results, the
 $7$
-hole and
 $7$
-ring examples did not capture the characteristic patterns from the experiments; however, altering the inner-hole spacing greatly affects these comparisons. The
 $3$
-hole geometry from § 3.2 had a dimensionless inner-hole spacing of
 $0.33526$
. If this value is increased to
 $0.4$
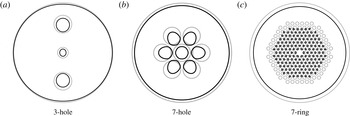
there is less interaction between the interior holes. This may be shown by computing the solution to the transverse problem up to time
 $\unicode[STIX]{x1D70F}=0.04$
, as shown in figure 13(a). While surface tension still causes the interior holes to close, these all remain approximately circular and no longer display the characteristic elongation shown in figure 3(d). The interior holes do have a larger effect on the outer boundary, which shows larger deformation near the inner holes, but this is still not cusp-like.
Decreasing the inner-hole spacing has the opposite effect. In the
 $7$
-hole example from § 3.3 the dimensionless inner-hole spacing was
 $0.35713$
. Reducing this distance to
 $0.25$
causes a stronger interaction between the interior holes. Computing the solution to the transverse problem up to
 $\unicode[STIX]{x1D70F}=0.04$
, as shown in figure 13(b), results in a shape change in the interior holes that provides a better qualitative match to the experiment (figure 3
e), ignoring interior hole location. Similar behaviour is observed in the
 $7$
-ring example shown in figure 13(c), for which the initial dimensionless inner-hole spacing was reduced from
 $8.3072\times 10^{-2}$
to
 $6\times 10^{-2}$
and the solution computed up to
 $\unicode[STIX]{x1D70F}=0.02$
. This solution provides a strong qualitative match to the experimental result from figure 3(f). In particular, the orientation of the holes in the outermost and innermost rings match the experiment very well. This agreement was also observed in numerical simulations performed by Stokes et al. (Reference Stokes, Crowdy, Tronnolone, Ebendorff-Heidepriem and Monro2012).
Three examples demonstrating the change in behaviour when the inner-hole spacing is changed. In all cases the final solution is shown in black and the initial condition is shown in grey. Shown in (a) is a
 $3$
-hole geometry at
 $\unicode[STIX]{x1D70F}=0.04$
with an inner-hole spacing of
 $0.4$
, which is larger than the value of
 $0.33526$
used in § 3.2. With this separation each interior boundary has a smaller effect on the others, while the interior holes have a larger effect on the outer boundary. The computed geometry does not provide a good qualitative match to the experimental result from figure 3(d). Shown in (b) is a
 $7$
-hole geometry at
 $\unicode[STIX]{x1D70F}=0.04$
with a dimensionless interior hole spacing of
 $0.25$
, which is smaller than the value of
 $0.35713$
used in § 3.3. The decrease in separation causes greater interaction between the interior holes, which produces a better qualitative match between the shape of the interior holes in the model and the experimental result from figure 3(e). Shown in (c) is a
 $7$
-ring geometry at
 $\unicode[STIX]{x1D70F}=0.02$
with the inner-hole spacing reduced from
 $8.3072\times 10^{-2}$
to
 $6\times 10^{-2}$
. Again, this decrease provides a better match to the experimental result from figure 3(f).

Based on these examples we conclude that surface tension has a significant effect on the final geometry consistent with experimental results; however, it cannot completely explain the deformations observed in experiments, which we have shown typically correspond to model results for more closely spaced holes. It would appear that some important effect is neglected in our model, and extrudate swell is a likely candidate. This may cause an initial increase in hole size, leading to a reduction in hole spacing and a greater interaction between holes, resulting in the type of deformation seen in practice. The results of Trabelssi et al. (Reference Trabelssi, Ebendorff-Heidepriem, Richardson, Monro and Joseph2015) also support the conclusion that extrudate swell is important in the absence of surface tension, albeit using exaggerated friction coefficients. We do not, however, believe that this explains the cause of the cusped boundaries seen in the
 $3$
-hole extrusion, which we address in the next section.
4 Extrusion assuming an unfilled die
Shown in figure 14 is a section from an extruded
 $3$
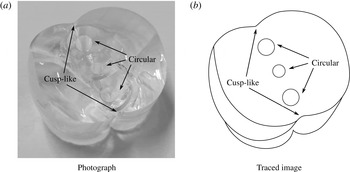
-hole preform following solidification of the glass and removal from the die. The top of this piece was at the die exit and the lower end a small distance below it. The three interior boundaries are close to circular, being still in contact with or just below the pins, while the outer boundary already features cusp-like deformations. We conclude that the external boundary shape developed during the sintering of the glass strands coming through the feed holes into the welding chamber within the die (see figure 2), resulting in an unfilled die. Similar behaviour is not observed during extrusion of
 $7$
-hole and
 $7$
-ring designs. This may be due to the higher degree of rotational symmetry possessed by these designs compared to the
 $3$
-hole design. In addition, the
 $3$
-hole die contains large spaces with no pins on either side of the geometry, not found in the other designs, that may result in an unfilled die.
A section from an extruded
 $3$
-hole preform that was at the die exit when the material solidified. Shown is (a) a photograph of the section and (b) a traced version of this photograph. The top of this piece was just at the exit and the lower end outside. The interior boundaries are still circular, while the outer boundary features cusp-like regions, which we conclude have formed inside the die.

Motivated by this observation, we here investigate whether our extrusion model produces deformation similar to those observed in experiments when given an initial geometry like that in figure 14. In particular, we seek to determine whether: (1) the outer boundary retains the cusp-like regions or if these become smooth due to surface tension; and (2) whether the internal holes still develop the correct pattern with a non-circular outer boundary or if the irregular outer boundary results in a modified hole geometry.
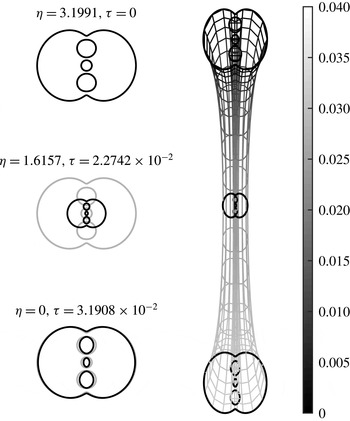
The geometry of the
 $3$
-hole preform from an unfilled die plotted in the scaled Eulerian coordinates
 $(x,y,z)$
. The shade represents the value of
 $\unicode[STIX]{x1D70F}$
from zero at the die exit to
 $3.1908\times 10^{-2}$
at the free end. Highlighted in black are three cross-sections, at the top, middle and bottom of the preform, that are plotted left along with the initial condition (grey). The cusp-like regions present at the die exit persist along the length of the preform, while the inner holes show deformation similar to that observed in experiments. The preform has a physical length of 64 cm. The deformation of the inner boundaries is similar to the deformation observed with a circular outer boundary shown in figure 6.

Using the method described by Tronnolone (Reference Tronnolone2016), we are able to construct conformal maps that describe
 $3$
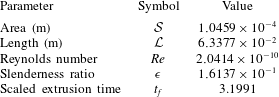
-hole preforms with circular inner boundaries and cusp-like regions on the outer boundary suitable for use in the spectral numerical method. The computed solution to the transverse problem is then used to find the preform geometry. The extrusion parameters are given in table 5, where we have assumed the same material properties (for F2 glass), billet size, ram speed and, hence, flux at the die exit, as were used for the filled-die
 $3$
-hole extrusion example in § 3. This ensures that
 $\unicode[STIX]{x1D6FE}^{\ast }$
is the same in both simulations.
Scales and dimensionless parameters for the cusped preform extrusion example, where these differ from those of § 3.2 due to the change in the cross-sectional area
 ${\mathcal{S}}$
at the die exit.

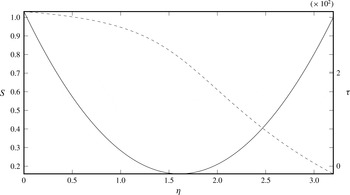
The area
 $S$
(solid) and reduced time
 $\unicode[STIX]{x1D70F}$
(dashed) for the
 $3$
-hole preform with an initial non-circular external boundary. Note that
 $\unicode[STIX]{x1D702}=0$
is the lower end of the preform. The behaviour is similar to that observed in the original
 $3$
-hole extrusion example shown in figure 7.

A comparison between the geometry at the end of the unfilled-die
 $3$
-hole preform (black) and the filled-die
 $3$
-hole preform from § 3 (grey). The interior holes in each solution are similar in both size and shape.

The final preform geometry is shown in figure 15. We see that the cusp-like regions present at the die persist along the length of the preform, meaning that surface tension is not strong enough to smooth these before extrusion finishes. The final area and reduced time are plotted against the Lagrangian coordinate
 $\unicode[STIX]{x1D702}$
in figure 16. These show similar behaviour to the filled-die
 $3$
-hole extrusion solution shown in figure 7. The preform has a physical length of 64 cm, which is longer than the original example due to the smaller fluid area at the die exit. Figure 17 shows the geometry at the lower end of the preform (black), along with the corresponding cross-section for the filled-die preform (grey). Clearly the initially non-circular outer boundary gives a result consistent with experimental observations. We note that in both cases the interior holes are similar in both shape and size, although in the case of the cusped external boundary the holes nearer the cusps are more elliptical. Thus, for this type of geometry, the outer boundary has only a small influence over the evolution of interior boundaries. Importantly, this means that, even with a wrong assumption of a completely filled die, the interior boundaries still display the characteristic deformation observed in experiments, which in turn suggests that the deformation of the inner boundaries is due, at least in part, to surface tension acting on the fluid once outside the die. On the other hand, the cusp-like regions in the outer boundary are due to the fluid flow inside the die. We conclude that, given the correct initial condition at the die exit, the extrusion model yields a solution that provides a qualitative match to the behaviour observed in experiments. The inclusion of extrudate swell may increase the level of deformation and provide better agreement.
5 Overcoming deformation
5.1 The inverse problem
In the examples considered in § 3 it was shown that surface tension causes significant deformation during extrusion. Following the convention used in practice, in each of these examples the die geometry was taken to be the negative of the desired preform geometry. It is possible to instead run the transverse problem backwards in reduced time using the spectral code, starting from the desired geometry, to determine an initial condition that would compensate for the effect of surface tension. The efficacy of this strategy is, however, limited by the nature of surface-tension-driven deformation. As the above examples demonstrate, once the extrusion ends each cross-section will, in general, have reached a different value of
 $\unicode[STIX]{x1D70F}$
, and thus no single die geometry will be appropriate for every cross-section. Since the die geometry is fixed, in practice this means that solving the inverse transverse problem can only ensure that the final preform geometry of any given cross-section differs from the desired shape by some tolerance. Nonetheless, this strategy still has the potential to reduce the overall level of deformation.
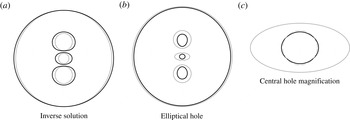
An example of this approach is shown in figure 18(a) for the
 $3$
-hole geometry from figure 3(a), in which the desired geometry is evolved backwards in reduced time to
 $\unicode[STIX]{x1D70F}=-0.03$
. Thus, a fluid region with this cross-section would be expected to deform to the desired
 $3$
-hole geometry in
 $0.03$
units of reduced time. It is a simple exercise to use the spectral method to evolve the geometry from figure 18(a) forwards for
 $0.03$
units of reduced time to verify that this recovers the initial
 $3$
-hole geometry. The time over which the spectral code can be run backwards is, however, limited: as the solution is computed backwards in reduced time, the inner holes increase in size until eventually they will, to numerical precision, intersect. This can be seen in the example in figure 18(a), which cannot be run backwards much further than
 $\unicode[STIX]{x1D70F}=-0.03$
. In addition, circular die pins are typically easier to fabricate and some more-complicated die geometries, such as the inverse from figure 18(a), may be difficult to produce; however, improvements in die fabrication, such as the use of three-dimensional printing, may in future allow the fabrication of complex dies (Ebendorff-Heidepriem et al.
Reference Ebendorff-Heidepriem, Schuppich, Dowler, Lima-Marques and Monro2014). We also note that, as discussed by Buchak et al. (Reference Buchak, Crowdy, Stokes and Ebendorff-Heidepriem2015), the inverse problem is ill-posed. In all cases considered in this study the inverse problem was solved by choosing an appropriate number of terms to use in the series representations of the solutions, which acts to regularise the problem. The same approach is used in the elliptical pore model of Buchak et al. (Reference Buchak, Crowdy, Stokes and Ebendorff-Heidepriem2015), in which the number of terms used to represent each boundary is restricted so as to keep all inner boundaries elliptical and the outer boundary circular.
Inverse solutions for the
 $3$
-hole geometry. Shown in (a) is the geometry of the
 $3$
-hole die (black) obtained by starting with the desired preform geometry (grey, and as shown in figure 3
a) and running the transverse problem backwards in time to
 $\unicode[STIX]{x1D70F}=-0.03$
. Evolving this die geometry forwards in time will recover the desired preform geometry. Shown in (b) is the
 $3$
-hole geometry at
 $\unicode[STIX]{x1D70F}=0.06$
(black) arising from the initial geometry with an elliptical central hole with aspect ratio
 $2.0254$
(grey), while (c) shows a magnification of the central hole along with a circle of radius
 $3.1051\times 10^{-2}$
(grey dashed), which is the mean of the major and minor radii of the computed central hole. As seen, the central hole has become approximately circular.

If the temperature of the extruded material can be accurately controlled it may be possible to cool the extruded preform at a precise rate so that each cross-section solidifies after a predetermined reduced time, thus allowing the use of the strategy described above to obtain a die geometry required to yield a given preform. A thorough examination of cooling requires a coupled fluid and temperature model, the development of which will be considered in future work. The variation in
 $\unicode[STIX]{x1D70F}$
along the length of the preform may also be controlled by adjusting the extrusion parameters, and will be discussed further below.
For some geometries it is possible to avoid the complications arising from the computation of an inverse solution by exploiting the observed deformation and the precise preform requirements. It was noted by Manning (Reference Manning2011) that the shapes of the two lateral interior channels in the
 $3$
-hole geometry are not important, and only the central hole must stay circular so as to fit a smaller preform, known as a cane, with a circular outer boundary. As such, we need only focus on producing a preform with a circular central hole, while the outer holes need only remain open. From the experimental result shown in figure 6 we observe that the central hole becomes approximately elliptical due to the influence of the two outer holes, and thus it is possible that this deformation could be overcome by using a die with an elliptical central pin having the opposite eccentricity. Compared to computing a full inverse solution, this approach has the advantage that elliptical pins are easier to fabricate than the irregular shapes in figure 18(a), and also avoids the need to compute the transverse problem backwards in time, which, as noted above, is an ill-posed problem. Solving the transverse problem forwards in time with a geometry featuring elliptical inner boundaries is readily achieved using the spectral numerical method described by Tronnolone (Reference Tronnolone2016).
At reduced time
 $\unicode[STIX]{x1D70F}=0.06$
the central hole may be approximated by an ellipse with the aspect ratio
 $2.0254$
. We thus take an initial condition in which the central circular hole has been replaced by an ellipse with the same aspect ratio but with the major and minor radii swapped. This geometry is then evolved forwards in reduced time until
 $\unicode[STIX]{x1D70F}=0.06$
. The initial and final geometries are shown in figure 18(b) (grey and black, respectively). The major and minor radii of the central hole at
 $\unicode[STIX]{x1D70F}=0.06$
are approximately
 $3.3447\times 10^{-2}$
and
 $2.8656\times 10^{-2}$
, respectively, which correspond to the aspect ratio
 $1.1672$
. The mean of the major and minor radii is
 $3.1051\times 10^{-2}$
, and for comparison a circle with this radius is superimposed on the actual boundary in figure 18(c) (grey dashed). We see that from the chosen initial configuration a geometry is obtained with a central hole that is approximately circular. As before, since each cross-section will ultimately arrive at a different reduced time, no single inverse will be perfectly suitable for every cross-section, and in practice we must select a suitable initial condition that gives the best fit along the length of the preform.
Although we have in this section only considered the
 $3$
-hole design, other extruded preforms also develop approximately elliptical interior boundaries, such as the
 $7$
-hole geometry from figure 3(f), and would thus also be amenable to this technique.
5.2 Minimising deformation
We have seen that, under typical conditions, surface tension causes significant deformation to the geometry of an extruded preform. We here investigate the relationship between the dimensionless surface tension
 $\unicode[STIX]{x1D6FE}^{\ast }$
and the amount of surface-tension-driven deformation in an extruded fluid cylinder. To facilitate this analysis we introduce measures of the level of both axial and transverse deformation.
The state of any cross-section
 $\unicode[STIX]{x1D702}$
may be described by the area
 $S$
and reduced time
 $\unicode[STIX]{x1D70F}$
. As a measure of axial deformation at time
 $t$
we choose
 $$\begin{eqnarray}\displaystyle S_{d}(\unicode[STIX]{x1D6FE}^{\ast },t)=\max _{\unicode[STIX]{x1D702}}|S-1|, & & \displaystyle\end{eqnarray}$$
which measures the maximum deviation of the area from the initial area of
 $1$
. Similarly, as a larger
 $\unicode[STIX]{x1D70F}$
corresponds to a greater surface-tension-driven change in geometry, we measure the transverse deformation by
 $$\begin{eqnarray}\displaystyle \unicode[STIX]{x1D70F}_{d}(\unicode[STIX]{x1D6FE}^{\ast },t)=\max _{\unicode[STIX]{x1D702}}|\unicode[STIX]{x1D70F}|. & & \displaystyle\end{eqnarray}$$
Both
 $S_{d}$
and
 $\unicode[STIX]{x1D70F}_{d}$
are non-decreasing with time
 $t$
. While it would be possible to define average or integrated measures of the deformation, we choose the above forms as they provide an upper bound on the deformation, so are easily related to specified manufacturing tolerances.
By way of example we consider extrusion through an annular die. Defining
 $\unicode[STIX]{x1D6FC}_{0}$
to be the initial difference between the outer and inner radii in the associated transverse problem, the cross-sectional area is given by
 $$\begin{eqnarray}\displaystyle S(\unicode[STIX]{x1D702},\unicode[STIX]{x1D70F})=\left(\frac{\unicode[STIX]{x1D70F}}{2\unicode[STIX]{x1D6FC}_{0}}+1\right)^{2/3}\left\{1-\frac{3\unicode[STIX]{x1D6FC}_{0}\unicode[STIX]{x1D70E}^{\ast }}{\unicode[STIX]{x1D6FE}^{\ast }}\left[\left(\frac{\unicode[STIX]{x1D70F}}{2\unicode[STIX]{x1D6FC}_{0}}+1\right)^{2/3}-1\right]\right\}^{2}, & & \displaystyle\end{eqnarray}$$
while the relationship between
 $t$
and
 $\unicode[STIX]{x1D70F}$
is
 $$\begin{eqnarray}\displaystyle \frac{2\unicode[STIX]{x1D6FE}^{\ast }}{3\unicode[STIX]{x1D6FC}_{0}m}(t-\unicode[STIX]{x1D702})=\left(1+\frac{3\unicode[STIX]{x1D6FC}_{0}\unicode[STIX]{x1D70E}^{\ast }}{\unicode[STIX]{x1D6FE}^{\ast }}\right)\left[\left(\frac{\unicode[STIX]{x1D70F}}{2\unicode[STIX]{x1D6FC}_{0}}+1\right)^{4/3}-1\right]-\frac{\unicode[STIX]{x1D70E}^{\ast }\unicode[STIX]{x1D70F}}{\unicode[STIX]{x1D6FE}^{\ast }}\left(\frac{\unicode[STIX]{x1D70F}}{2\unicode[STIX]{x1D6FC}_{0}}+2\right), & & \displaystyle\end{eqnarray}$$
where
 $m$
is as defined in (2.21). These equations are equivalent to those found by Tronnolone et al. (Reference Tronnolone, Stokes, Foo and Ebendorff-Heidepriem2016) for a tube with unit initial area stretching under gravity. The only change is replacing
 $t$
by
 $t-\unicode[STIX]{x1D702}$
; that is, the time over which cross-section
 $\unicode[STIX]{x1D702}$
, which leaves the die at
 $t=\unicode[STIX]{x1D702}$
, evolves. The solution process is identical to that described by Tronnolone et al. (Reference Tronnolone, Stokes, Foo and Ebendorff-Heidepriem2016).
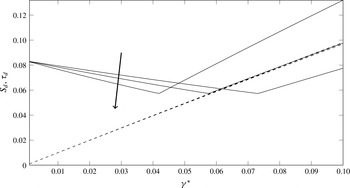
The deformation measures
 $S_{d}$
(solid black) and
 $\unicode[STIX]{x1D70F}_{d}$
(black dashed) plotted against the dimensionless surface tension
 $\unicode[STIX]{x1D6FE}^{\ast }$
for annular cylinders with initial aspect ratios
 $\unicode[STIX]{x1D719}_{0}=0.3$
,
 $0.5$
and
 $0.7$
. The arrow shows the direction of increasing
 $\unicode[STIX]{x1D719}_{0}$
for the
 $S_{d}$
curves. At each value of
 $\unicode[STIX]{x1D719}_{0}$
the axial deformation
 $S_{d}$
first decreases with
 $\unicode[STIX]{x1D6FE}^{\ast }$
, then increases. The minimum value of
 $S_{d}$
occurs at
 $\unicode[STIX]{x1D6FE}_{m}^{\ast }(\unicode[STIX]{x1D719}_{0})$
, which depends on the initial aspect ratio
 $\unicode[STIX]{x1D719}_{0}$
. The transverse deformation
 $\unicode[STIX]{x1D70F}_{d}$
is almost identical for the three values of
 $\unicode[STIX]{x1D719}_{0}$
, and increases with
 $\unicode[STIX]{x1D6FE}^{\ast }$
.

We consider extrusion through annular dies with aspect ratios
 $\unicode[STIX]{x1D719}_{0}=0.3$
,
 $0.5$
and
 $0.7$
. For each die geometry we run the model until time
 $t=1$
for a range of surface tensions
 $\unicode[STIX]{x1D6FE}^{\ast }$
between
 $0$
and
 $0.1$
. The deformation measures
 $S_{d}(\unicode[STIX]{x1D6FE}^{\ast },1)$
and
 $\unicode[STIX]{x1D70F}_{d}(\unicode[STIX]{x1D6FE}^{\ast },1)$
are plotted against
 $\unicode[STIX]{x1D6FE}^{\ast }$
in figure 19. The transverse deformation
 $\unicode[STIX]{x1D70F}_{d}$
is virtually identical for the three aspect ratios
 $\unicode[STIX]{x1D719}_{0}$
, and increases approximately linearly with
 $\unicode[STIX]{x1D6FE}^{\ast }$
. That
 $\unicode[STIX]{x1D70F}_{d}$
increases with
 $\unicode[STIX]{x1D6FE}^{\ast }$
is evident from the relationship (2.14) between
 $t$
and
 $\unicode[STIX]{x1D70F}$
, which shows that for a fixed time
 $t$
a larger
 $\unicode[STIX]{x1D6FE}^{\ast }$
results in larger values of
 $\unicode[STIX]{x1D70F}$
, and hence a larger
 $\unicode[STIX]{x1D70F}_{d}$
. The near-linearity of this increase suggests that the quantity
 $$\begin{eqnarray}\displaystyle \max _{\unicode[STIX]{x1D702}}\left|\int _{\unicode[STIX]{x1D702}}^{1}\frac{1}{\unicode[STIX]{x1D707}\unicode[STIX]{x1D712}}\,\text{d}t^{\prime }\right|, & & \displaystyle\end{eqnarray}$$
is approximately constant as
 $\unicode[STIX]{x1D6FE}^{\ast }$
varies. While not apparent from figure 19, the value of
 $\unicode[STIX]{x1D70F}_{d}$
decreases with
 $\unicode[STIX]{x1D719}_{0}$
for a given
 $\unicode[STIX]{x1D6FE}^{\ast }$
, but the three solutions differ by no more than
 $1.3\times 10^{-3}$
. The axial deformation
 $S_{d}$
initially decreases with
 $\unicode[STIX]{x1D6FE}^{\ast }$
, reaches a minimum at some value
 $\unicode[STIX]{x1D6FE}_{m}^{\ast }(\unicode[STIX]{x1D719}_{0})$
, which is different for each annulus, and then increases. The value of
 $\unicode[STIX]{x1D6FE}_{m}^{\ast }(\unicode[STIX]{x1D719}_{0})$
decreases with
 $\unicode[STIX]{x1D719}_{0}$
. The behaviour of
 $S_{d}$
is explained by considering the balance between axial stretching and surface tension in the governing differential equation (2.11). In the region
 $0\leqslant \unicode[STIX]{x1D6FE}^{\ast }<\unicode[STIX]{x1D6FE}_{m}^{\ast }(\unicode[STIX]{x1D719}_{0})$
the largest change in the area
 $S$
is due to gravitational stretching; that is,
 $S_{d}$
corresponds to a cross-section
 $\unicode[STIX]{x1D702}$
at which
 $S(\unicode[STIX]{x1D702},1)<1$
. For
 $\unicode[STIX]{x1D6FE}^{\ast }>\unicode[STIX]{x1D6FE}_{m}^{\ast }(\unicode[STIX]{x1D719}_{0})$
, the largest area change occurs near the free end
 $\unicode[STIX]{x1D702}=0$
of the extruded cylinder where surface tension causes the area to increase, where it corresponds to a cross-section
 $\unicode[STIX]{x1D702}$
at which
 $S(\unicode[STIX]{x1D702},1)>1$
. The point
 $\unicode[STIX]{x1D6FE}_{m}^{\ast }(\unicode[STIX]{x1D719}_{0})$
corresponds to a value of
 $\unicode[STIX]{x1D6FE}^{\ast }$
at which the largest area change due to stretching equals the largest area change due to surface tension. The value of
 $\unicode[STIX]{x1D6FE}_{m}^{\ast }(\unicode[STIX]{x1D719}_{0})$
increases with
 $\unicode[STIX]{x1D719}_{0}$
because larger
 $\unicode[STIX]{x1D719}_{0}$
results in larger boundary lengths, and hence a stronger contribution from the surface tension terms in (2.11).
These results have important implications for MOF preform extrusion. Typically, the area of each cross-section is not important, as this can be adjusted automatically by the draw ratio used when the preform is drawn into a fibre. In contrast, the shape of each cross-section must have a precise pattern, and any deformation of the shape cannot readily be corrected during drawing. Indeed, studies have shown that during drawing the cross-sectional shape again evolves as a two-dimensional Stokes flow with surface tension, and thus deformations in the preform will become worse during drawing (Stokes et al.
Reference Stokes, Buchak, Crowdy and Ebendorff-Heidepriem2014). While surface-tension-driven deformation arising during drawing can be controlled by pressurising the channels, either by sealing the air channels (self-pressurisation) or applying a pressure, in practice this is difficult to achieve and control (Ebendorff-Heidepriem, Moore & Monro Reference Ebendorff-Heidepriem, Moore and Monro2008; Chen et al.
Reference Chen, Stokes, Buchak, Crowdy, Foo, Dowler and Ebendorff-Heidepriem2016). It is thus important to minimise
 $\unicode[STIX]{x1D70F}_{d}$
, while the value of
 $S_{d}$
is less important. This implies that the extrusion parameters should be chosen so as to minimise
 $\unicode[STIX]{x1D6FE}^{\ast }$
. Given a particular material, this may be achieved by increasing either
 ${\mathcal{Q}}$
or
 $\unicode[STIX]{x1D707}_{0}$
. That is, both a faster extrusion speed and a larger viscosity result in less surface-tension-driven deformation in the transverse geometry. In practice, however, these two parameters are generally not independent: increasing
 ${\mathcal{Q}}$
requires a greater ram force, which may ultimately require a reduction in
 $\unicode[STIX]{x1D707}_{0}$
. The optimal conditions thus depend on the physical limitations of the extrusion device used. Reducing the effect of surface tension will also reduce the level of fire polishing, and will thus reduce the surface quality of the preform. Further investigation of extrudate swell is required in order to determine whether adjusting
 ${\mathcal{Q}}$
or
 $\unicode[STIX]{x1D707}_{0}$
has an impact on this source of deformation.
6 Conclusions
We have developed a model for the extrusion of a viscous fluid from a die of arbitrary geometry. It has been shown that, with the use of a slenderness approximation and a transformation to reduced time
 $\unicode[STIX]{x1D70F}$
, the transverse flow decouples from the axial flow. The resulting transverse problem is simply a classical two-dimensional Stokes flow moving-boundary problem with unit surface tension, while an exact solution to the resulting axial problem may be written down in terms of the total boundary length from the transverse problem. The simplicity of this solution depends strongly upon the introduction of
 $\unicode[STIX]{x1D70F}$
and the Lagrangian coordinate
 $\unicode[STIX]{x1D702}$
.
This model has been used to analyse the fabrication of microstructured optical fibre preforms by extrusion. By examining three representative geometries we have demonstrated that surface tension contributes significantly to the deformation observed in practice; however, while our model can reproduce some of the experimental behaviour, it fails to replicate all of the features. It has been shown previously that gravity and surface tension alone can explain the deformation of a stretching fluid cylinder in the absence of extrusion through a die (Tronnolone et al. Reference Tronnolone, Stokes, Foo and Ebendorff-Heidepriem2016), while extrudate swell has been shown to have a significant effect on extrusion in the absence of surface tension and gravity (Trabelssi et al. Reference Trabelssi, Ebendorff-Heidepriem, Richardson, Monro and Joseph2015). We thus propose that both surface tension and extrudate swell work in concert to deform the geometry once the fluid has left the die. Our work suggests that extrudate swell may expand holes and reduce hole spacing, leading to a greater interaction between holes and more deformation. The contributions of surface tension and extrudate swell are expected to depend upon the extrusion conditions. Furthermore, experimental evidence suggests that in some cases the fluid does not completely fill the welding chamber, and hence exits the die with a geometry significantly different from that anticipated. Both the filling of the die and extrudate swell are matters that require further investigation.
It has been assumed throughout both this work and that of Trabelssi et al. (Reference Trabelssi, Ebendorff-Heidepriem, Richardson, Monro and Joseph2015) that the glass temperature remains constant during the extrusion process, which is not physically realistic. There is, therefore, a need for additional temperature modelling to understand how the temperature of the glass changes during extrusion, and how this affects the fluid flow.
We conclude that a satisfactory model of the extrusion process must include the contributions of surface tension, extrudate swell and a variable temperature. In addition it is important to know whether the die is completely filled. Work is currently under way to develop coupled models of the fluid and heat flows in order to understand their relationship better. Of greater difficulty is the inclusion of die effects. Future work could consider modelling extrude swell only over some small region below the die, and using this as an initial condition in the surface-tension model developed here.
Acknowledgements
H.T. was supported by a Lift-Off Fellowship from the Australian Mathematical Society, an Australian Postgraduate Award and an A. F. Pillow Applied Mathematics Top-Up Scholarship. This research was also supported by grant DP130101541 from the Australian Research Council. This work was in part performed at the Optofab node of the Australian National Fabrication Facility utilising Commonwealth and SA State Government funding. Permission to reproduce figure 3(d) was kindly provided by S. Manning. The authors wish to thank D. G. Crowdy for useful discussions.