





Introduction
Maize (Zea mays L.) is the most important staple food crop in Zambia and an important source of income for smallholder farmers (Hoogendoorn et al., Reference Hoogendoorn, Audet-Bélanger, Böber, Donnet, Lweya, Malik and Gildemacher2018; Silva et al., Reference Silva, Baudron, Ngoma, Nyagumbo, Simutowe, Kalala, Habeenzu, Mphatso and Thierfelder2023). Zambian smallholder farmers are central to national maize production, contributing about 90% of the country’s production (World Bank, 2022). Although maize hybrids are widely used by smallholder farmers in Zambia, mainly due to the Farmer Input Support Programme (FISP), average yield remains low at 2.4 Mg ha−1 (Hoogendoorn et al., Reference Hoogendoorn, Audet-Bélanger, Böber, Donnet, Lweya, Malik and Gildemacher2018). Despite the large number of new hybrids released annually, farmers face challenges distinguishing among relatively similar varieties and often lack information on their specific adaptation (Blekking et al., Reference Blekking, Waldman and Evans2021).
Smallholder farmers in sub-Saharan Africa (SSA) operate under diverse agro-ecological (climate, soil types, and topography) and biophysical contexts (pests, diseases, and soil fertility), as well as socio-economic conditions (access to agricultural inputs, labour, land, market, and credit) (Descheemaeker et al., Reference Descheemaeker, Ronner, Ollenburger, Franke, Klapwijk, Falconnier, Wichern and Giller2019; Haussmann et al., Reference Haussmann, Aminou, Descheemeaker, Weltzien, Some, Richardson, Coe, Tonapi, Talwar, Are, Bhat, Reddy and Dalton2020; Tittonell et al., Reference Tittonell, Muriuki, Shepherd, Mugendi, Kaizzi, Okeyo, Verchot, Coe and Vanlauwe2010; Vanlauwe et al., Reference Vanlauwe, Coe and Giller2019). These conditions and factors, contributing to variability in contexts such as variable seasonal rainfall patterns and fluctuations in input and output prices, influence farmers’ choices of agronomic management practices and the performance of best-bet agricultural options at the farm level (Descheemaeker et al., Reference Descheemaeker, Ronner, Ollenburger, Franke, Klapwijk, Falconnier, Wichern and Giller2019; Vanlauwe et al., Reference Vanlauwe, Coe and Giller2019). In response to this complexity, the option × context (O × C) framework acknowledges that the diversity of agro-ecological and socio-economic conditions requires ‘best-fit’ solutions tailored to specific contexts and needs (Descheemaeker et al., Reference Descheemaeker, Ronner, Ollenburger, Franke, Klapwijk, Falconnier, Wichern and Giller2019; Haussmann et al., Reference Haussmann, Aminou, Descheemeaker, Weltzien, Some, Richardson, Coe, Tonapi, Talwar, Are, Bhat, Reddy and Dalton2020; Nelson et al., Reference Nelson, Coe and Haussmann2019; Sinclair and Coe, Reference Sinclair and Coe2019). In plant breeding, the options correspond to crop genotypes, which must be suited to the target users and environments.
For the effective design of a breeding programme, it is essential to define the target user group(s) and the target environment(s), where new varieties are expected to perform better than existing ones and respond to the specific needs of the target group of farmers (Ceccarelli et al., Reference Ceccarelli, Guimaraes and Weltzien2009; Christinck et al., Reference Christinck, Welzien and Hoffmann2005; Cooper and Messina, Reference Cooper and Messina2023). Breeding strategies have traditionally been tailored to specific regions and agro-ecological conditions (Ceccarelli et al., Reference Ceccarelli, Guimaraes and Weltzien2009), while genotype × environment (G × E) interactions have often been minimized rather than strategically utilized (Annicchiarico, Reference Annicchiarico, Ceccarelli, Guimaraes and Weltzien2009). Participatory plant breeding (PPB) recognizes that people belonging to different social groups (even when working under similar agro-ecological conditions) may have distinct needs and preferences for seeds and varieties. Thus, it is important to target the breeding work not only to biophysical but also to socio-economic conditions (Ceccarelli et al., Reference Ceccarelli, Guimaraes and Weltzien2009; Christinck et al., Reference Christinck, Welzien and Hoffmann2005). Selecting cultivars specifically adapted to different contexts and uses is a key strength of the PPB approach. It enables the development of varieties that meet diverse farmers’ needs while contributing to greater agrobiodiversity in farmers’ fields (Ceccarelli et al., Reference Ceccarelli, Galie, Mustafa, Grando, Ruiz and Vernooy2012; Joshi et al., Reference Joshi, Subedi, Rana, Kadayat and Sthapit1997; Weltzien et al., Reference Weltzien, Rattunde, Sidibe, vom Brocke, Diallo, Haussmann, Diallo, Nebie, Toure, Christinck, Westengen and Winge2020). Engaging with farmers to understand their production systems and objectives is the first step towards developing a joint understanding of problems and approaches in a new participatory breeding programme. It also supports decision-making about testing conditions and criteria for evaluation of breeding materials (Christinck et al., Reference Christinck, Welzien and Hoffmann2005).
The identification and delineation of the target environments is often done by analysing multi-environment trials (METs), through which a broad range of potential varieties can be evaluated in the target region (Ceccarelli et al., Reference Ceccarelli, Guimaraes and Weltzien2009). In PPB programmes, such METs are usually conducted in farmers’ fields under their growing conditions and on research stations (Weltzien and Christinck, Reference Weltzien, Christinck, Snapp and Pound2008). Testing conditions on research stations often do not represent farmers’ field conditions well because they are usually overfertilized, with more mechanized and better-timed field operations (Ceccarelli et al., Reference Ceccarelli, Grando, Bailey, Amri, El-Felah, Nassif, Rezgui and Yahyaoui2001; Haussmann et al., Reference Haussmann, Aminou, Descheemeaker, Weltzien, Some, Richardson, Coe, Tonapi, Talwar, Are, Bhat, Reddy and Dalton2020; Rattunde et al., Reference Rattunde, Michel, Leiser, Piepho, Diallo, vom Brocke, Diallo, Haussmann and Weltzien2016; Weltzien and Christinck, Reference Weltzien, Christinck, Snapp and Pound2008). Thus, testing breeding materials or experimental varieties in farmers’ fields helps to obtain more relevant information for a breeding programme on variety performance and adaptation, as well as farmers’ preferences. Multi-year testing is essential to assess yield stability, which is particularly important for risk-averse farmers who prioritize a stable minimum yield over maximum yield response in more favourable years (Haussmann et al., Reference Haussmann, Fred Rattunde, Weltzien-Rattunde, Traoré, vom Brocke and Parzies2012).
The Mother-Baby Trial (MBT) design (Snapp, Reference Snapp, Bellon and Reeves2002) is commonly used in PPB programmes (Weltzien and Christinck, Reference Weltzien, Christinck, Snapp and Pound2008) for decentralized variety testing. Mother trials (MTs) are usually replicated within sites and include a full set of varieties, whereas baby trials (BTs) are smaller, with each farmer testing a subset of MT varieties (Snapp, Reference Snapp, Bellon and Reeves2002). Recent participatory research initiatives, such as the Farmer Research Network (Nelson et al., Reference Nelson, Coe and Haussmann2019) and the triadic comparisons of technologies (tricot) (van Etten et al., Reference van Etten, Beza, Calderer, van Duijvendijk, Fadda, Fantahun, Kidane, van de Gevel, Gupta, Mengistu, Kiambi, Mathur, Mercado, Mittra, Mollel, Rosas, Steinke, Suchini and Zimmerer2019), have developed new approaches to better understand options-by-context interactions through large-scale farmer-managed trials. The objective of such large-scale testing is to identify and scale out agricultural technology options tailored to the diverse needs and conditions of smallholder farmers (Oberson et al., Reference Oberson, Moussa, Aminou, Kidane, Luo, Giuliani, Weltzien and Haussmann2024).
As part of a new maize breeding programme launched by the seed company KWS in Zambia in partnership with the social-for-profit seed enterprise Good Nature Agro (GNA), the overall goal of this study is to support decisions about the maize breeding strategy in Eastern Zambia and the organization of large-scale variety testing that enables smallholder farmers to select varieties adapted to their production conditions and needs. Specifically, this study aims to (i) characterize maize growing conditions among smallholder farmers in Eastern Zambia, (ii) investigate G × E interaction patterns for yield in large-scale on-farm variety trials in this region, and (iii) use the on-farm variety trial results to guide the maize breeding strategy in Eastern Zambia and assess their relevance for breeders and farmers.
Materials and methods
GNA farmers conducted rainfed MBTs across six agricultural camps in Kasenengwa District, Eastern Zambia, in 2021–22 and across five camps in 2022–23 (Supplementary Material Figure S1). The district is located in the agro-ecological zone IIa. The growing season lasts from November to April, with annual rainfall ranging from 800 to 1000 mm (Makondo and Thomas, Reference Makondo and Thomas2020). In this study, trial seasons are referred to by the calendar year in which they ended, namely 2022 and 2023.
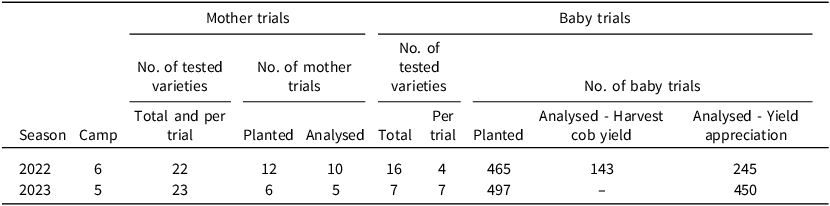
Twelve MTs were conducted in 2022, of which six were retained in 2023. MT farmers for 2023 were selected based on 2022 trial quality, gender balance, motivation, and diversity in management practices and rainfall amount. In parallel, 465 BTs were implemented in 2022 and 497 in 2023 (Table 1). Of these, 53% were retained in 2022 and 91% in 2023 for the yield appreciation analysis, reflecting improvements in data quality and completeness. MT and BT farmers managed their trials under their own cropping practices, including planting time, fertilization and pesticide application, weeding and harvesting time.
Number of trials and number of maize varieties tested in the on-farm Mother-Baby Trials conducted in the 2022 and 2023 seasons (excluding farmer’s own varieties)

Long description
The table presents data on the number of trials and varieties tested in on-farm Mother-Baby Trials conducted in the 2022 and 2023 seasons. It includes information on the number of tested varieties, the number of trials, and the number of trials analyzed for both mother trials and baby trials. The table is divided into two main sections: Mother trials and Baby trials, with each section further divided into columns for the season, camp, number of tested varieties, and number of trials. For the Mother trials, the data is presented for the 2022 and 2023 seasons, with details on the number of tested varieties total and per trial, and the number of mother trials planted and analyzed. For the Baby trials, the data includes the number of tested varieties total and per trial, and the number of baby trials planted, analyzed for harvest cob yield, and analyzed for yield appreciation. The table provides a comprehensive overview of the trials conducted, highlighting the differences and trends between the two seasons.
Plant materials and experimental design
A total of 22 maize varieties were tested in the 2022 MTs. These included 14 commercial hybrids, seven open-pollinated varieties (OPVs), and the common check PAN53. In addition, each MT farmer included their own variety, referred to as the farmer’s own variety (FOV), which was the same variety planted in the surrounding field (Supplementary Material Table S1). Most farmers planted PAN53 as their FOV, confirming its relevance as a common check. For the statistical analysis, the FOVs corresponding to the same underlying variety across the MTs were treated as a single variety. The strategy in the 2022 MTs was to expose farmers to a wide range of varieties to learn about farmers’ preferences and assess variety performance under farmers’ conditions. In the 2023 MTs, we selected the nine best-performing and most preferred varieties from the 2022 MTs, including the common check PAN53, and added 13 recently released commercial hybrids and one experimental hybrid. This made a total of 23 varieties plus the FOVs (Supplementary Material Table S1). In both MT seasons, the experimental design was a 6x4 Alpha lattice with two complete replicates per farmer, each consisting of four incomplete blocks of six plots. Plots consisted of two rows of five meters in length. In 2022, the design was unbalanced with the variety ZM4252 included only in replicate 1 and the common check PAN53 used as a filler in replicate 2. Entry 24 was filled with the variety ZMS520 in replicate 1 and with ZMS606 in replicate 2.
In the 2022 BTs, we selected 16 varieties from the complete set of varieties tested in the MTs (Supplementary Material Table S1) and packed them into sets of two. Each BT farmer chose two sets (four varieties) for testing and added their FOV, providing a baseline for comparison. Thus, each farmer had five plots with their four selected test varieties plus their FOV. This resulted in each test variety appearing on a different number of farms. For the 2023 BTs, we selected the two best-performing and most preferred varieties from the 2022 MBTs and added five varieties from the set of 14 included in the 2023 MTs, forming a common set of seven test varieties (Supplementary Material Table S1). Each farmer had eight plots with this set plus their FOV, resulting in each test variety appearing on the same number of farms. For the statistical analysis of the 2022 and 2023 BTs, all FOVs were treated as one common baseline check. Plots consisted of three rows of 10 m length in both trial seasons. In 2022, farmers could sow additional rows if seed quantity allowed depending on the intra-row spacing, while the number of rows was fixed at three in 2023. In 2023, varieties were not randomized to facilitate farmer-led planting and data recording. In the 2022 season, many BT farmers did not report the variety names on the record sheet according to their own randomization, leading to data losses. Given this challenge and the large number of BT farmers involved, all farmers in 2023 planted the letter-coded varieties (A to G) in the same order from left to right, followed by their FOV in the final plot. Record sheets were standardized to match this planting order.
The MBT design was co-developed by the main author and project partners. The BT design was iteratively refined based on farmers’ feedback after each trial season. Researchers and MT farmers jointly decided on the traits to assess across the trials. MT and BT farmers received separate on-the-job training on basic principles of trial implementation and data collection. Farmers managed the trials with support from the project team for the MTs and from lead farmers for the BTs (Oberson et al., Reference Oberson, Moussa, Aminou, Kidane, Luo, Giuliani, Weltzien and Haussmann2024).
The MBTs were blinded trials to avoid bias in trait scoring, as the farmers might be familiar with some of the tested varieties (van Etten et al., Reference van Etten, Beza, Calderer, van Duijvendijk, Fadda, Fantahun, Kidane, van de Gevel, Gupta, Mengistu, Kiambi, Mathur, Mercado, Mittra, Mollel, Rosas, Steinke, Suchini and Zimmerer2019). In both MTs and BTs, trait assessment was mainly based on visual observation. The MT farmers scored selected traits on a scale of 1–5 (1-very good; 5-very bad). In the BTs, most traits were scored on a scale of 1–3 (1-good; 3-bad). Farmers defined 1 as the best score, consistent with the Zambian primary school grading system. BT protocols were simplified to facilitate data recording by low-literate farmers (Oberson et al., Reference Oberson, Moussa, Aminou, Kidane, Luo, Giuliani, Weltzien and Haussmann2024). In 2022, cob yield was measured in one-third of the BTs among farmers who followed the main principles of trial implementation. In 2023, yield was assessed visually using the same 1–3 scale.
Data analysis
Mother trials
In this study, genotype × farmer (G × F) interaction refers to the multi-location analysis within a year, using ‘farmer’ as a proxy for location, because each trial was managed under farmers’ own crop management practices and socio-economic conditions (models 3 and 4). Genotype × environment (G × E) interaction refers to the multi-location analysis across years involving all MTs and genotypes, where each environment was a combination of farmer and year (modified models 3 and 4). A separate three-way interaction analysis (G × F × Y) was performed on a reduced dataset of common varieties and farms across both years (model 6).
In a first step, single-location analyses were conducted for each year separately, using a linear mixed model to obtain REML estimates of variance components and best linear unbiased predictors (BLUPs) for grain yield. All design and treatment effects were assumed to be random. The same model was fitted with genotype considered as a fixed effect to obtain the best linear unbiased estimators (BLUEs). These BLUEs were used for (i) the regression of grain yield of the nine common genotypes across years on the average yield of all genotypes in the MT environments and (ii) the comparison of variety rankings across levels of the crop management factors.
Computations for estimating repeatabilities of single trials in the within-year analysis, as well as heritabilities in both the within-year analyses across MTs and across-year analysis (farmer-year combination), were based on BLUPs of genotypic effects (Cullis et al., Reference Cullis, Smith and Coombes2006; Piepho and Möhring, Reference Piepho and Möhring2007):
 ${H^2} = 1 - {{{\rm{V}}{{\rm{D}}_{{\rm{BLUP}}}}} \over {2\sigma _g^2}}$
where
 ${\sigma^{2}_g}$
is the genotypic variance and VDBLUP is the mean variance of a difference of the BLUPs. Individual MTs with a repeatability lower than 0.20 were dropped from the analysis.
To enable comparisons of genetic variance across trials of differing mean yields, the genetic coefficient of variation (GCV) of each trial was calculated as:
 $GCV={\sqrt{{\sigma }_{g}^{2}} \over \mu }$
where
 ${\sigma^{2}_g}$
is the genotypic variance component and µ is the trial grand mean (Leiser et al., Reference Leiser, Rattunde, Piepho, Weltzien, Diallo, Melchinger, Parzies and Haussmann2012).
The following linear mixed model was set up for the within-year analysis across MT farmers to obtain REML-estimates of variance components and BLUPs of genotypic effects across farmers. It also served as a base model to assess the extent of the contribution of the context factors to G × F interaction:
 ${{\rm{y}}_{ijlm} = {\rm{\mu}} + {{\rm{g}}_i} + {{\rm{f}}_j} + {({\rm{gf}})_{ij}} + {{\rm{r}}_{jl}} + {{\rm{b}}_{jlm}} + {\rm {\varepsilon}} _{ijlm}}$
with y ijlm designating the grain yield of the ith genotype at jth farmer, lth replicate, and mth incomplete block; and the model consisting of the intercept (μ), the effect of the ith genotype (g i ), of the jth farmer (f j ), of the lth replicate within the jth farmer (r jl ), of the mth incomplete block within the lth replicate within the jth farmer (b jlm ), the interaction of ith genotype with the jth farmer [(gf) ij ], and the residual effects (ϵ ijlm ).
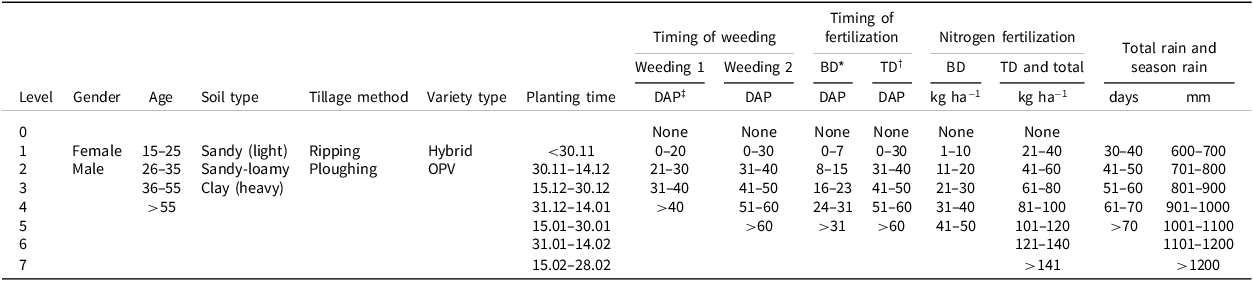
The above model (3) was extended to include interaction effects between genotype and each context factor, representing biophysical, social, and management factors (Table 2), in order to estimate their contribution to G × F interactions. The levels of each factor were defined based on relevant thresholds or crop growth stages influencing yield response. Age categories were defined based on access to assets and land, as well as farming experience. The model can be stated as:
 ${{\rm{y}}_{ijklm}} = {\rm{\mu}} + {{\rm{g}}_i} + {{\rm{f}}_j} + {({\rm{gf}})_{ij}} + {({\rm{gc}})_{ik}} + {{\rm{r}}_{jl}} + {{\rm{b}}_{jlm}} + {{\rm {\varepsilon}} _{ijlm}}$
where (gc) ik is the interaction effect of the ith genotype and the kth level of context factor c. The method was adapted from Leiser et al. (Reference Leiser, Rattunde, Piepho, Weltzien, Diallo, Melchinger, Parzies and Haussmann2012). The contribution of each context factor to G × F interaction was quantified as the percentage reduction in the variance component of gf. It was calculated as
 ${VC\left(gf\right)_{base\,\,\textit{model}}\ -\ VC\left(gf\right)_{\textit{factor}\,\,\textit{model}} \over VC(gf)_{base\,\,\textit{model}}}\times100$
Context factors and their levels in the 2022 and 2023 mother trials

Table 2. Long description
A table detailing context factors and their levels in the 2022 and 2023 mother trials. The table has 7 rows and 14 columns. The columns are labeled as Level, Gender, Age, Soil type, Tillage method, Variety type, Planting time, Timing of weeding (Weeding 1 DAP, Weeding 2 DAP), Timing of fertilization (BD DAP, TD DAP), Nitrogen fertilization (BD kg ha⁻¹, TD and total kg ha⁻¹), and Total rain and season rain (days, mm). The rows are labeled with levels 0 to 7. Row 1: Level 0, Gender Female, Age 15-25, Soil type Sandy (light), Tillage method Ripping, Variety type Hybrid, Planting time <30.11, Weeding 1 None, Weeding 2 None, BD None, TD None, BD None, TD and total None, days 30-40, mm 600-700. Row 2: Level 1, Gender Male, Age 26-35, Soil type Sandy-loamy, Tillage method Ploughing, Variety type OPV, Planting time 30.11-14.12, Weeding 1 0-20, Weeding 2 21-30, BD 0-7, TD 8-15, BD 11-20, TD and total 21-40, days 41-50, mm 701-800. Row 3: Level 2, Gender Male, Age 36-55, Soil type Clay (heavy), Tillage method Ploughing, Variety type OPV, Planting time 15.12-30.12, Weeding 1 31-40, Weeding 2 41-50, BD 16-23, TD 31-40, BD 21-30, TD and total 41-60, days 51-60, mm 801-900. Row 4: Level 3, Gender Male, Age >55, Soil type Clay (heavy), Tillage method Ploughing, Variety type OPV, Planting time 31.12-14.01, Weeding 1 >40, Weeding 2 >60, BD >31, TD >60, BD 31-40, TD and total 61-80, days 61-70, mm 901-1000. Row 5: Level 4, Gender Male, Age >55, Soil type Clay (heavy), Tillage method Ploughing, Variety type OPV, Planting time 15.01-30.01, Weeding 1 >40, Weeding 2 >60, BD >31, TD >60, BD 41-50, TD and total 81-100, days >70, mm 1001-1100. Row 6: Level 5, Gender Male, Age >55, Soil type Clay (heavy), Tillage method Ploughing, Variety type OPV, Planting time 31.01-14.02, Weeding 1 >40, Weeding 2 >60, BD >31, TD >141, BD 121-140, TD and total >120, days >1200, mm 1101-1200. Row 7: Level 6, Gender Male, Age >55, Soil type Clay (heavy), Tillage method Ploughing, Variety type OPV, Planting time 15.02-28.02, Weeding 1 >40, Weeding 2 >60, BD >31, TD >141, BD 121-140, TD and total >120, days >1200, mm 1101-1200.
* BD = basal dressing.
† TD = top dressing.
‡ DAP = days after planting.
For the combined analysis across 15 MT environments, the model (3) was modified by replacing the farmer effect (f j ) with the environment effect (e j ) and likewise for the interaction effect with genotype. All varieties tested in the respective MT environments were included in this analysis. The modified model (3) was used as the base model for the analysis of the context factors contributing to G × E interactions. For this analysis, the model (4) was modified in the same way, replacing the farmer terms by the environment terms. The environment FJ_2022 was discarded because of missing rainfall data.
To investigate the repeatability of G × F interaction across years, we also fitted a three-way-interaction model using a subset of nine common varieties tested in the same five MT farms in both years, together with the corresponding FOVs. This subset of the dataset allowed the separation of main genotype effects from the interaction effects. The corresponding model is
 ${{\rm{y}}_{ijklm}} = {\rm{\mu}} + {{\rm{g}}_i} + {{\rm{f}}_j} + {y_k} + {({\rm{gf}})_{ij}} + {({\rm{gy}})_{ik}} + {({\rm{fy}})_{jk}} + {({\rm{gfy}})_{ijk}} + {{\rm{r}}_{jkl}} + {{\rm{b}}_{jklm}} + {{\rm {\varepsilon}} _{ijklm}}$
with y ijklm designating the grain yield of the ith genotype at jth farmer, kth year, lth replicate, and mth incomplete block. The model consists of the intercept (μ), the main effects of the ith genotype (g i ), the jth farmer (f j ), the kth year (y k ), the two-way interactions of ith genotype with the jth farmer [(gf) ij ], of ith genotype with the kth year [(gy) ik ], of jth farmer with the kth year [(fy) jk ], the three-way interaction of ith genotype with the jth farmer, and kth year [(gfy) ijk ]. The experimental design is accounted for by the replicate (r jkl ), incomplete block (b jklm ), and residual (ϵ ijklm ) effects.
In the combined analyses, all factors were treated as random except the year, which was treated as fixed in model (6). A heterogeneous error variance was assumed between farmers for the within-year analyses (models 3 and 4) and between farmer-year combinations for the model (4) with the environment effect (e j ) and model (6).
To visualize G × E interaction patterns, a genotype–genotype-by-environment (GGE) biplot analysis was conducted (Yan and Kang, Reference Yan and Kang2003), retaining the nine varieties common to both years. Yield stability was investigated by regressing the grain yield of the nine common varieties on the mean yield of all varieties in the 15 MT environments (Finlay and Wilkinson, Reference Finlay and Wilkinson1963).
All analyses were conducted with the software language R v.4.3.0 (Core Team 2023) for statistical computing and graphics. Estimation of variance components and other mixed-model analyses were fitted with v.4.3.7 of the sommer software package in R.
Baby trials
The harvested cob yield was analysed across trials using the following model:
 ${{\rm{y}}_{ij}} = {\rm{\mu}} + {{\rm{g}}_i} + {{\rm{f}}_j} + {{\rm {\varepsilon}} _{ij}}$
where y ij is the response of ith genotype in jth farmer, μ is the overall mean yield, g i is the main effect of ith genotype, f j is the random effect of jth farmer, and ϵ ij is the residual effect comprising the G × F interaction and error. Each farm was considered as representing its own context.
For the within-year analysis of the effect of the context factors (Supplementary Material Table S2) and their interaction with genotype on harvested cob yield, we first used a forward selection approach to screen for context factor relevance based on p-values (Heinze et al., Reference Heinze, Wallisch and Dunkler2018). The model used was
 ${{\rm{y}}_{ijk}} = {\rm{\mu}} + {{\rm{g}}_i} + {{\rm{c}}_k} + {{\rm{f}}_j} + {{\rm {\varepsilon}} _{ij}}$
where y ijk is the response of the ith genotype in jth farmer and kth class of context factor c (Supplementary Material Table S2). μ is the overall mean yield, g i is the main effect of the ith genotype, c k represents the effect of each kth class of context factor c, f j is the random effect of jth farmer, and ϵ ij is the residual effect comprising G × F interaction and error.
After identifying the best-fitting model, we then tested genotype × context (G × C) factor interactions. We kept all retained context factors as main effects and added each G × C interaction term individually because sparse data for some factor levels prevented simultaneous fitting of interaction terms. The model fitted was the following:
 ${{\rm{y}}_{ijk}} = {\rm{\mu}} + {{\rm{g}}_i} + {{\rm{c}}_k} + {({\rm{gc}})_{ik}} + {{\rm{f}}_j} + {{\rm {\varepsilon}} _{ij}}$
where (gc) ik is the interaction effect of the ith genotype and the kth level of context factor c. The levels of the context factors were reduced for the 2022 BTs analysis (Supplementary Material Table S2) compared with the MTs (Table 2) due to limited observations per factor level for testing the interaction effects. Levels were revised in line with critical crop-management timings known to influence yield response (Raemaekers, Reference Raemaekers2001; ZARI, 2002). The factor level 0 for timing of first weeding was dropped because only one trial fell into this category.
A threshold model was used to analyse the yield appreciation scores, which were considered as ordered categorical data (McCullagh, Reference McCullagh1980; Piepho and Kalka, Reference Piepho and Kalka2003). Covariate screening was conducted using a linear model on the latent scale with the same predictors as in model (8). The covariates that significantly improved the base model were iteratively added to form the best-fitting model. For each retained covariate, G × C factor interactions were then tested using the same predictors as in model (9). All threshold models were fitted using a probit link for cumulative probabilities P(score < i). We assumed a multinomial distribution with probabilities π1, π2, … for the ordered categories, where πi is the probability to observe a score equal to i, as determined by the cumulative probabilities P(score < i) (Piepho and Kalka, Reference Piepho and Kalka2003). The threshold model was fitted using the cumulative link mixed model specification in v. 2023.12-4.1 of the ordinal package in R.
Statistical significance of the context factors and their interactions with genotype was tested using a likelihood ratio test. For all fitted models, the significance level was set at α = 0.10. All terms were considered as fixed effect, except the farmer effect, which was assumed random.
Spearman rank correlation (rs) was used to assess the relationship between genotype BLUPs for grain yield across the 2022 MTs and adjusted mean cob yields across the 2022 BTs, as well as between genotype BLUPs across the 2023 MTs and the adjusted mean yield appreciation scores across the 2023 BTs. For the 2023 correlation analysis, the yield appreciation score was treated as numeric, and the scale was reversed (1-bad; 3-good). Model (7) was fitted with the yield appreciation score as the response variable y ij , and the adjusted mean scores were obtained using the emmeans package in R.
Results
Ten of 12 MTs in season 2022 could be analysed, the remaining two trials had to be dropped. One trial failed due to poor germination caused by a dry spell after sowing, and the other was excluded because of repeatability zero for grain yield. In 2023, five of six MTs were analysed; one was excluded due to zero repeatability.
Mean yield levels and repeatability
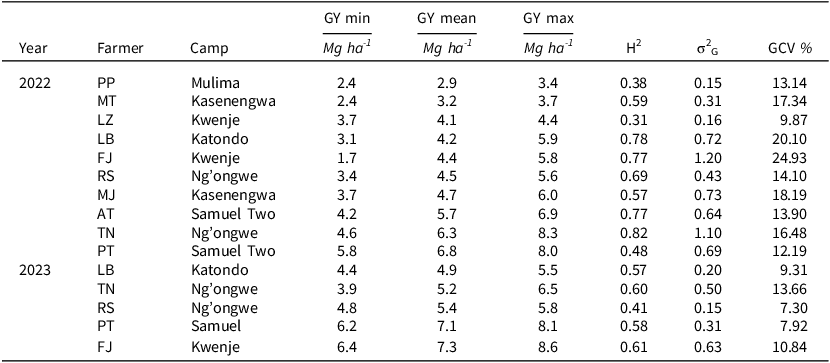
Grain yield levels among the individual MTs ranged from 2.9 Mg ha−1 to 6.8 Mg ha−1 in 2022 and from 4.9 Mg ha−1 to 7.3 Mg ha−1 in 2023, reflecting the diversity of growing conditions of farmers (Table 3). Mean grain yield across the 2022 MTs was lower (4.7 Mg ha−1) than across the 2023 MTs (6.0 Mg ha−1). A lower variability was observed among the 2023 MTs, with three trials yielding approximatively 5 Mg ha−1 and two trials yielding 7 Mg ha−1 (Table 3). The 2022 BTs ranged from 1.5 to 11.3 Mg ha−1, showing high variability among farmers. BT trials were skewed toward low to medium productivity levels, with a median harvest cob yield of 4.5 Mg ha−1, equivalent to a grain yield of 3.6 Mg ha−1 assuming an 80% threshing index (Supplementary Material Figure S2).
Estimates of mean (GY, in Mg ha− 1), repeatability (H2), genetic coefficient of variation (GCV) for grain yield in the 2022 and 2023 mother trials eligible for the analyses

Table 3. Long description
A table comparing grain yield levels among individual mother trials for the years 2022 and 2023. The table has 14 rows and 8 columns. The columns are labeled Year, Farmer, Camp, GY min (Mg ha⁻¹), GY mean (Mg ha⁻¹), GY max (Mg ha⁻¹), H2, and GCV (%). The rows list data for different farmers and camps across the years 2022 and 2023. Row 1: 2022, PP, Mulima, 2.4, 2.9, 3.4, 0.38, 13.14. Row 2: 2022, MT, Kasenengwa, 2.4, 3.2, 3.7, 0.59, 17.34. Row 3: 2022, LZ, Kwenje, 3.7, 4.1, 4.4, 0.31, 9.87. Row 4: 2022, LB, Katondo, 3.1, 4.2, 5.9, 0.78, 20.10. Row 5: 2022, FJ, Kwenje, 1.7, 4.4, 5.8, 0.77, 24.93. Row 6: 2022, RS, Ng’ongwe, 3.4, 4.5, 5.6, 0.69, 14.10. Row 7: 2022, MJ, Kasenengwa, 3.7, 4.7, 6.0, 0.57, 18.19. Row 8: 2022, AT, Samuel Two, 4.2, 5.7, 6.9, 0.77, 13.90. Row 9: 2022, TN, Ng’ongwe, 4.6, 6.3, 8.3, 0.82, 16.48. Row 10: 2022, PT, Samuel Two, 5.8, 6.8, 8.0, 0.48, 12.19. Row 11: 2023, LB, Katondo, 4.4, 4.9, 5.5, 0.57, 9.31. Row 12: 2023, TN, Ng’ongwe, 3.9, 5.2, 6.5, 0.60, 13.66. Row 13: 2023, RS, Ng’ongwe, 4.8, 5.4, 5.8, 0.41, 7.30. Row 14: 2023, PT, Samuel, 6.2, 7.1, 8.1, 0.58, 7.92. Row 15: 2023, FJ, Kwenje, 6.4, 7.3, 8.6, 0.61, 10.84.
The repeatability estimates of individual MTs ranged from 0.31 to 0.82 (Table 3), with a mean repeatability of 0.60 across years. For farmers, higher repeatability implies that yield differences are largely due to the varieties and not to uncontrolled field variation. The 2022 MTs showed a higher mean repeatability (0.62) than the 2023 MTs (0.55), despite higher trial mean yields in the 2023 MTs. Weak positive correlation was observed between repeatability and productivity level among the MTs (rs = 0.21, n.s.) (Supplementary Material Figure S3).
The GCV tended to be higher in the 2022 MTs relative to the 2023 MTs. In 2022, the GCV was inflated due to the inclusion of lower-performing materials, mostly OPVs, which increased the genetic variance for yield. In contrast, the 2023 MTs included generally better-performing genotypes, resulting in reduced genotypic variance and lower GCV (Table 3).
Heritabilities, G × F and G × E interactions
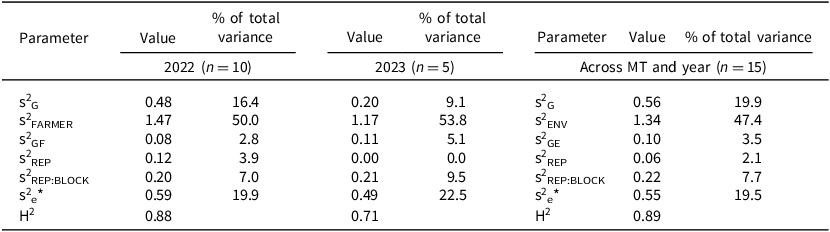
Combined analyses within year across MTs showed a larger genotypic variance relative to the G × F interaction variance components, resulting in relatively high heritability estimates in both years (Table 4). G × F interaction was significant in the 2022 MTs (p = 0.042), with the genotypic variance largely exceeding G × F interaction variance (1:0.17 for s2 G:s2 GF). Ranking of varieties showed a relatively stable top 10 genotypes across most of the 2022 MTs, except for three farmers (MJ, LZ, PP) (Supplementary Material Table S3). Although the G × F interaction was not significant in 2023 (p = 0.08), the variance component ratio of G to G × F (1:0.56) was larger than in 2022. Unlike in 2022, most genotypes did not rank consistently across the 2023 MTs (Supplementary Material Table S4).
Variance components and their percentage of the total variance for grain yield (Mg ha-1) from the combined analyses within year of the 2022 and 2023 mother trials and the combined analysis over mother trial environments (farmer-year combinations)

Table 4. Long description
The table presents variance components and their percentages of total variance for dry grain yield (Mg ha-1) from a univariate heterogeneous variance model analysis. It includes data from combined analyses within the years 2022 and 2023, and across multi-environment trials (MT environments). The table is divided into three main sections: 2022 (n = 10), 2023 (n = 5), and across MT and year (n = 15). Each section lists parameters such as s2G, s2FARMER, s2GF, s2REP, s2REP:BLOCK, and Se2, along with their respective values and percentages of total variance. For 2022, the parameters and their percentages of total variance are as follows: s2G: 0.48 (16.4 percent), s2FARMER: 1.47 (50.0 percent), s2GF: 0.08 (2.8 percent), s2REP: 0.12 (3.9 percent), s2REP:BLOCK: 0.20 (7.0 percent), Se2: 0.59 (19.9 percent), and H2: 0.88. For 2023, the parameters and their percentages of total variance are: s2G: 0.20 (9.1 percent), s2FARMER: 1.17 (53.8 percent), s2GF: 0.11 (5.1 percent), s2REP: 0.00 (0.0 percent), s2REP:BLOCK: 0.21 (9.5 percent), Se2: 0.49 (22.5 percent), and H2: 0.71. Across MT and year, the parameters and their percentages of total variance are: s2G: 0.56 (19.9 percent), s2ENV: 1.34 (47.4 percent), s2GE: 0.10 (3.5 percent), s2REP: 0.06 (2.1 percent), s2REP:BLOCK: 0.22 (7.7 percent), Se2: 0.55 (19.5 percent), and H2: 0.89.
* Error variance is a computed mean of the residual variances of each MT for the multi-location analyses with year and of each MT environment (farmer-year combination) for the combined analysis across environments.
Combined analysis across MT environments revealed significant genotype, environment, and G × E interaction for grain yield. The environment accounted for 47.4% of the total variance, while the contribution of genotype (19.9%) was larger than the G × E variance component (3.5%) (Table 4).
The three-way-interaction revealed a larger G × F × Y interaction variance (s2 0.17) compared to the genotype × year (G × Y) variance (s2 0.09) and G × F variance (s2 0) (data not shown). This complex G × F × Y interaction is illustrated in the GGE biplot by obtuse angles between the two years and most farmers, indicating no consistent performance patterns within distinct groups of environments (Figure 1). The position of the variety AF635 near the biplot origin indicates that it was the most stable of the nine varieties tested across both years. The variety PAN53 also showed relatively stable performance across environments. The regression of individual grain yield on the environmental mean shows that PAN53 was the best-performing variety in low- to medium-yielding conditions, while it dropped slightly below the trial mean in high-yielding ones (Supplementary Material Figure S4). MT farmers described PAN53 as a drought-tolerant variety, with good grain quality (less susceptible to weevils due to grain hardness), minimal fertilizer requirements, good grain weight for the market, good husk cover and high flour: grain ratio.
Genotype–genotype-by-environment biplot of grain yield for 9 genotypes (blue colour) tested in 15 MT environments in 2022 and 2023. Environment labels (red colour) show the farmer-year combination.

Long description
A genotype-genotype by environment biplot of grain yield for 9 genotypes tested in 15 environments in 2022 and 2023. The biplot includes two axes: PC1 (36 percent TSS) on the horizontal axis and PC2 (17 percent TSS) on the vertical axis. The genotypes are represented by blue dots, and the environments are represented by red dots. Each environment label shows the farmer-year combination. The biplot shows the distribution of genotypes and environments, indicating how different genotypes perform in various environments. The genotypes and environments are spread across the plot, with some clustering and some outliers. The biplot helps visualize the interaction between genotypes and environments, highlighting which genotypes are best suited to specific environments.
Characterization of the Mother-Baby Trials
Planting dates in the MTs ranged from 27 November to 14 January, with most trials planted between 20 and 24 December (Supplementary Material Table S5). One MT each season was planted in January, due to delayed rainfall in 2022 and waterlogging after germination in 2023. BT planting ranged from mid-November to early February in 2022 and late January in 2023.
In 67% of the MTs, both the first (>20 DAP) and second (>40 DAP) weedings were delayed, including 3 trials without a second weeding. A further 13% of MTs delayed or omitted only the second weeding (Supplementary Material Table S5). In the 2022 BTs, 21% of farmers delayed the first weeding (>25 DAP), while 57% delayed or omitted the second (Supplementary Material Figure S5). Among MTs, 60% practiced minimum tillage, and two-thirds of them applied selective herbicides for the first weeding. For the trials without a second weeding, MT farmers explained that the long-lasting effect of the selective herbicide from the first weeding eliminated the need for additional weeding. In contrast, only 8% of BT farmers practiced minimum tillage.
Delayed fertilizer application occurred in most MTs. Fifty-three percent experienced delays in both basal (>15 DAP) and top dressing (>40 DAP) fertilisation, including 2 MTs without basal fertilization. A further 26% of MTs experienced delays, split equally between basal (13%) and top-dressing (13%) fertilization (Supplementary Material Table S5). In the BTs, 42% of farmers did not apply basal fertilizers. Among them, many reported mixing NPK and urea for a single application at top dressing. Nitrogen application rates were below the recommended 20 kg N ha−1 at basal and 92 kg N ha−1 at top dressing (ZARI, 2002) in 53% of MTs for both applications, in 13% for basal only, and in 7% for top dressing only. Among those, average application rates were 10.5 kg N ha−1 at basal and 59 kg N ha−1 at top dressing.
Crop management practices differed among female and male farmers. In the 2022 MTs, women applied basal fertilizer on average 20 days later than men farmers. In both MT seasons, women applied on average 18 and 19 kg N ha−1 less than men (Supplementary Material Table S6). In the 2022 BTs, a higher proportion of women than men delayed weedings and top dressing application (Supplementary Material Figure S5).
Rainfall patterns varied within and between seasons. Among 2022 MTs, there was a higher variability in rainfall amount and number of rain days compared to 2023 MTs. Peak rainfall occurred in January for 2022, while shifted to December in 2023 (Supplementary Material Figure S6). The 2023–24 rainy season was marked by an El Niño–induced drought that led to severe drought conditions across the country (OCHA, 2025).
Context factors explaining G × E interactions
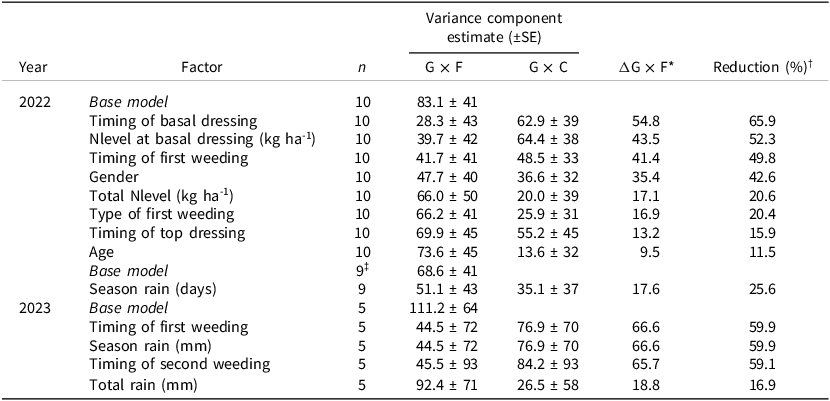
The context factors explaining most of G × E interaction across the 14 MT environments were the timing of second weeding (39%), timing of first weeding (33%), timing of basal (29%), and top dressing (25%) application, and to a lower extent, the nitrogen application rate at basal dressing and the number of rain days during the growing season (Supplementary Material Table S7). An unbalanced dataset across the MT seasons was expected in such trials due to variability in crop management practices and differences in the sets of varieties tested across the seasons. Because this limits the precision of the variance component estimates, we additionally present the results of the contributing factors to G × F interaction for each MT season.
Across the 2022 MTs, the main factors contributing to the G × F interaction for grain yield were, in order of importance, the timing of basal dressing, followed by the nitrogen application rate at basal dressing, the timing of first weeding, and gender (Table 5). Across the 2023 MTs, the main factors explaining G × F interaction were the timing of the first and second weeding, the amount of rainfall during the growing season, and, to a lesser extent, the total amount of rainfall (Table 5). The common factor to both MT seasons was the timing of the first weeding, explaining, respectively, 50 and 60% of G × F interaction.
Variance components and their standard errors for total genotype × farmer (G × F) interaction for grain yield (Mg ha-1), and absolute and relative reductions in G × F interaction variance after accounting for genotype interactions with 17 individual context factors, using mixed-model restricted maximum likelihood analyses across 10 mother trials in 2022 and 5 trials in 2023. All values were multiplied by 1000. Only reductions above 10% are shown

Table 5. Long description
The table presents variance components and their standard errors for total genotype × farmer (G × F) interaction for grain yield (Mg ha⁻¹) and the reductions in G × F interaction variance after accounting for genotypic interactions with 17 individual context factors, using mixed-model restricted maximum likelihood analyses across 10 mother trials in 2022 and 5 trials in 2023. The table has 21 rows and 7 columns. The columns are labeled Year, Factor, n, G × F, G × C, ΔG × F*, and Reduction (%). The rows are grouped by year, 2022 and 2023, and each year has a base model and various factors such as timing of basal dressing, nitrogen level at basal dressing, timing of first weeding, gender, total nitrogen level, type of first weeding, timing of top dressing, age, season rain (days), season rain (mm), and timing of second weeding. Each row provides the variance component estimate and standard error for G × F and G × C, the reduction in G × F interaction, and the percentage reduction. Notable trends include the timing of basal dressing and the nitrogen application rate at basal dressing being significant factors in 2022, while the timing of the first and second weeding and the amount of rainfall during the growing season were significant in 2023. The timing of the first weeding was a common significant factor in both years.
* ΔG × F = VCG×F(base model) − VCG×F(factor model)..
† Reduction (%) = ΔG × F/VCG×F(base model) × 100.
‡ One trial was excluded for rainfall factors due to missing data.
Some varieties showed specific adaptations for grain yield under certain crop management levels in the MTs. The open-pollinated variety ZM421 ranked first not only under the single stress condition of no basal dressing (Supplementary Material Table S8) but also under the combined stresses of no basal dressing and late first weeding. In 2023, PAN7M-83 ranked first under early first weeding (≤20 DAP) but dropped under delayed first weeding (Supplementary Material Table S9). DKC80-23 ranked among the best varieties under delayed second weeding (41–50 and 51–60 DAP) (Supplementary Material Table S10).
In the 2022 BT analysis, the most significant initial covariate, total number of rain days, was first added to the base model. Adding the other covariates one at a time to this model did not reveal any additional significant context factor effects on yield appreciation. Multicollinearity is unlikely to explain this result, as the correlation coefficients among the covariates ranged from 0.31 to 0.52, except for a correlation coefficient of 0.70 among the timing of the second weeding and the timing of top-dressing fertilization. Moreover, the variance inflation factor values did not indicate problematic multicollinearity. By examining changes in ranking of varieties across the levels of total rain days, we inferred that factors beyond rainfall alone influenced the yield appreciation scores. Therefore, we repeated the forward selection without the factor of the total number of rain days. This revealed significant effects of the factors timing of basal dressing, planting time, timing of second weeding, and gender on yield appreciation scores. No significant interaction effects were found between those factors and genotype (Supplementary Material Table S11). Applying the same forward selection approach to test the effect of the context factors on harvested cob yield revealed significant effects of timing of top dressing and tillage method, including a significant G × tillage method interaction. The reduced number of trials (n = 103) available for this analysis may explain the differences in the results compared to the model using yield appreciation score as a latent variable. The 2023 BT results revealed significant interactions between genotype and total rain days and between genotype and planting time on yield appreciation score (n = 399) (Supplementary Material Table S11).
Comparison of variety performance among MTs and BTs
The top ten varieties out of the 16 tested in both the 2022 BTs (n = 137) and MTs (n = 10) ranked similarly for grain and cob yield across both trial types. A strong correlation was found between cob yield across the 2022 BTs and grain yield across the 2022 MTs (rs = 0.90). In contrast, the correlation between grain yield across the 2023 MTs and mean score for yield appreciation across the 2023 BTs is close to zero (rs = −0.14). This result can be attributed to the small sample size (seven varieties) and the narrow range of both yield and appreciation scores (Supplementary Material Table S12).
Discussion
Priority adaptation traits – implications for maize breeding in Eastern Zambia
Characterization of the MTs revealed high variability in crop management practices and rainfall patterns within and across the 2022 and 2023 seasons (Supplementary Material Table S5). This variability was reflected in significant farmer and environment effects on maize grain yield (Table 4). These findings align with previous research emphasizing the diversity of agro-ecological and socio-economic conditions of smallholder farming systems in SSA (Descheemaeker et al., Reference Descheemaeker, Ronner, Ollenburger, Franke, Klapwijk, Falconnier, Wichern and Giller2019; Haussmann et al., Reference Haussmann, Aminou, Descheemeaker, Weltzien, Some, Richardson, Coe, Tonapi, Talwar, Are, Bhat, Reddy and Dalton2020; Tittonell et al., Reference Tittonell, Muriuki, Shepherd, Mugendi, Kaizzi, Okeyo, Verchot, Coe and Vanlauwe2010; Vanlauwe et al., Reference Vanlauwe, Coe and Giller2019) and their influence on the performance of agricultural options (Descheemaeker et al., Reference Descheemaeker, Ronner, Ollenburger, Franke, Klapwijk, Falconnier, Wichern and Giller2019; Vanlauwe et al., Reference Vanlauwe, Coe and Giller2019). Despite heterogeneous growing conditions across MT environments, the G × E interaction variance was relatively small compared with the genotypic variance (Table 4). This was expected, as the varieties were tested within a single district in Eastern Zambia. Nevertheless, specific adaptation patterns were identified for certain management levels (Supplementary Material Tables S8–S10). Most drivers of G × F interaction differed between seasons, except for the timing of first weeding, which consistently explained a large proportion of G × F interaction across both seasons (Table 5). In 2022, G × F interaction was mainly driven by the timing and rate of basal nitrogen application, while in 2023, it was driven primarily by the timing of weedings and rainfall during the growing season.
Across the MT environments and 2022 BTs, delayed and low-rate nitrogen applications were prevalent, while the absence of basal dressing was more frequent in the BTs. In the MT environments where nitrogen application rates were below recommendations, the average rate was about half of the recommended 20 kg N ha−1 at basal and two-thirds of the 92 kg N ha−1 at top dressing (ZARI, 2002). Only one MT environment and six BT farmers applied basal fertilizer at planting. Farmers often delay basal fertilization to avoid wasting fertilizer in the event of poor germination (Burke et al., Reference Burke, Frossard, Kabwe and Jayne2019). Fertilizer access constraints and late delivery – often linked to the FISP programme – further contributed to delayed N application, consistent with prior findings in Zambia (Burke et al., Reference Burke, Frossard, Kabwe and Jayne2019; Namonje-Kapembwa et al., Reference Namonje-Kapembwa, Black and Thomas2017). In 2023, 43% of BT farmers accessed FISP inputs, a proportion similar to that reported by Audet-Bélanger et al. (Reference Audet-Bélanger, Gildemacher and Hoogendoorn2016). Given these results, and the fact that nitrogen stress remains a major limitation to maize productivity in SSA (Bänziger and Cooper, Reference Bänziger and Cooper2001; Ertiro et al., Reference Ertiro, Beyene, Das, Mugo, Olsen, Oikeh, Juma, Labuschagne and Prasanna2017; Setimela et al., Reference Setimela, Magorokosho, Lunduka, Gasura, Makumbi, Tarekegne, Cairns, Ndhlela, Erenstein and Mwangi2017; Tarekegne et al., Reference Tarekegne, Wegary, Cairns, Zaman-Allah, Beyene, Negera, Teklewold, Tesfaye, Jumbo, Das, Nhamucho, Simpasa, Kaonga, Mashingaidze, Thokozile, Mhike and Prasanna2023), breeding maize for low N adaptation and delayed fertilization should be considered in the breeding strategy.
Delayed weedings were also widespread. Most MT environments experienced delays in the first weeding and the second was either delayed or omitted; BT farmers predominantly delayed the second weeding. Early weed control is critical because maize is highly sensitive to weed competition at early growth stages (Gantoli et al., Reference Gantoli, Ayala and Gerhards2013; Munialo et al., Reference Munialo, Dahlin, Onyango, Oluoch-Kosura, Marstorp and Öborn2020). Delayed second weeding increases competition during peak N demand, from ear initiation to the end of silking (Munialo et al., Reference Munialo, Dahlin, Onyango, Oluoch-Kosura, Marstorp and Öborn2020). Poor weed control accounts for 50-90% of maize yield losses in Africa (Chikoye et al., Reference Chikoye, Udensi and Fontem Lum2005). Despite its importance and that weed control is labour- and time-intensive for smallholder farmers (Chikoye et al., Reference Chikoye, Udensi and Fontem Lum2005), breeding maize for adaptation to weed competition has received limited attention. Early research identified maize cultivars with higher weed suppressive ability (Mhlanga et al., Reference Mhlanga, Chauhan and Thierfelder2016), indicating potential for productivity gains under poor weed management conditions. Further research on this topic is therefore recommended.
Maize varieties ranked differently under different tillage methods in the 2022 BTs, whereas this context factor contributed little to G × F interaction in the MTs. The low practice of minimum tillage reported in the 2022 BTs is consistent with Mutale et al. (Reference Mutale, Kalinda and Kuntashula2017), but contrasts with Simutowe et al. (Reference Simutowe, Ngoma, Manyanga, Silva, Baudron, Nyagumbo, Kalala, Habeenzu and Thierfelder2024), who reported adoption rates of 23% in 2021 and 34% in 2022 in Zambia. Adoption of conservation agriculture (CA) by smallholder farmers in southern Africa is constrained by the fact that weed control under minimum tillage mostly relies on herbicide use (Lee and Thierfelder, Reference Lee and Thierfelder2017). The MT results, showing greater use of herbicides at planting and during early weeding, confirm this reliance on herbicides under minimum tillage. Before considering tillage practices in the breeding programme, CA adoption rates in the targeted regions of Zambia should be further investigated.
Finally, adaptation to low N and late fertilization, or delayed weeding, is of particular importance for women farmers. In the 2022 BTs, a higher proportion of women farmers delayed weeding and top-dressing application compared with men (Supplementary Material Figure S5). Women typically provide most of the labour for weeding, and women farmers often have limited access to soil fertility resources (Haussmann et al., Reference Haussmann, Aminou, Descheemeaker, Weltzien, Some, Richardson, Coe, Tonapi, Talwar, Are, Bhat, Reddy and Dalton2020; Quisumbing et al., Reference Quisumbing, Meinzen-Dick, Raney, Croppenstedt, Behrman and Peterman2014). Prioritizing these adaptation traits in selection strategies will help ensure that women farmers benefit from variety improvement.
Decentralized large-scale variety testing with farmers
G × E interaction – implication for variety testing in the target environment
The non-repeatable G × F interaction across years and the relatively small G × E interaction variance component compared to the genotypic variance (Table 4) indicate that selection for genotypic effects across MTs and years can effectively identify superior and stable genotypes. The GGE biplot further showed vectors pointing in opposite directions for the same farms across the two years. This result, together with the larger G × Y interaction relative to the G × F component, highlights the need for multi-year on-farm testing. Temporal yield stability is particularly critical for farmers operating under unpredictable rainfall and dynamic production environments (Annicchiarico, Reference Annicchiarico2002). Haussmann et al. (Reference Haussmann, Fred Rattunde, Weltzien-Rattunde, Traoré, vom Brocke and Parzies2012) reported that for risk-averse farmers, securing a constant and average performance level in stress environment is often more important than targeting outstanding performance in rare favorable years. Decentralized large-scale variety testing with farmers helps to build an evidence base for performance stability under farmers’ growing conditions.
Opportunities and challenges of large-N farmer-managed trials
Testing varieties under farmer-managed MTs in Eastern Zambia resulted in acceptable repeatability estimates (Table 3), significant genotypic variance, and high heritability estimates (Table 4) to discriminate among genotypes for grain yield. The low positive correlation between productivity and repeatability levels in the MTs (Supplementary Material Figure S3) suggests that selection under diverse management conditions, including low-input environments, can capture genetic variation to achieve breeding progress. This finding aligns with reports of high heritability from evaluations of experimental maize hybrids under both stress and non-stress conditions (Ertiro et al., Reference Ertiro, Beyene, Das, Mugo, Olsen, Oikeh, Juma, Labuschagne and Prasanna2017; Mebratu et al., Reference Mebratu, Wegary, Mohammed, Teklewold and Tarekegne2019) and from on-farm early-generation sorghum selection conducted under low-productivity conditions in West Africa (Rattunde et al., Reference Rattunde, Michel, Leiser, Piepho, Diallo, vom Brocke, Diallo, Haussmann and Weltzien2016; Weltzien et al., Reference Weltzien, Rattunde, Sidibe, vom Brocke, Diallo, Haussmann, Diallo, Nebie, Toure, Christinck, Westengen and Winge2020). Conversely, Bänziger and Cooper (Reference Bänziger and Cooper2001) reported reduced genetic variance and heritability in low-yielding environments, limiting breeding progress.
Maintaining the two-replicate alpha-lattice design for the MTs is essential to enable repeatability estimates and control experimental error. Given farmers’ feedback that 48 plots is the upper manageable limit for trial management and post-harvest handling, a constant set of approximately 24 varieties per season is recommended in the MTs.
Productivity levels captured across the MT environments and 2022 BTs represented well the range of maize productivity among Zambian smallholder farmers, comparable to Silva et al. (Reference Silva, Baudron, Ngoma, Nyagumbo, Simutowe, Kalala, Habeenzu, Mphatso and Thierfelder2023), who reported 0–9.0 Mg ha−1 across more than 6000 farmers. The narrower yield range observed in the 2023 MTs compared to 2022 (Table 3) reflects the selection of best-performing varieties for testing in 2023 and the dynamic growing conditions among seasons. To ensure good representativeness, a reasonable number of MTs should be sustained. Inclusion of non-GNA farmers, or GNA farmers receiving the lowest level of input support, could further enhance representativeness, given that GNA farmers generally have improved access to inputs and finance and practice legume–maize rotations that enhance soil fertility. While farmer-managed MTs require initial investments in training and supervision, these diminish as farmers gain experience. Over time, costs will be limited to the preparation and delivery of seed and trial protocols, making MTs a cost-effective approach for variety evaluation under a wide range of growing conditions.
The BT approach was designed to enable farmers to manage trials independently, with minimal project support. While efficient, it presents a trade-off between the need for detailed contextual information required to identify varieties with specific adaptation, and the challenge for time-constrained and low-literate farmers to collect extensive data (Oberson et al., Reference Oberson, Moussa, Aminou, Kidane, Luo, Giuliani, Weltzien and Haussmann2024). Despite significant effects of context factors on yield appreciation scores (Supplementary Material Table S11), no significant G × C factor interactions were detected in 2022 BTs, likely due to the unbalanced dataset. In contrast, testing the same set of varieties across BT farmers in 2023 revealed significant genotype × planting time and genotype × number of rain days interactions on yield appreciation scores. However, binary context factors (e.g. fertilization yes/no) appeared too coarse to detect specific genotype responses. Data collection on context factors could be further facilitated by building on the 2023 BT approach (cascading training and support through literate BT farmer facilitators) and by developing farmer-friendly digital tools for data recording and management (Oberson et al., Reference Oberson, Moussa, Aminou, Kidane, Luo, Giuliani, Weltzien and Haussmann2024).
For seed companies that have built strong collaboration with farmers, supporting farmers to generate and share reliable information on variety performance and adaptation to their local contexts would help farmers make informed choices and provide the company with a competitive advantage through variety-specific recommendations. This is particularly relevant in Zambia’s maize seed market, where farmers face difficulties navigating among relatively similar new maize hybrids and lack information on their adaptation (Blekking et al., Reference Blekking, Waldman and Evans2021). MT farmers reported three maize varieties commonly cultivated on larger fields in their communities. Among these, PAN53 and PHB30G19, familiar hybrids released in the early 2000s, were among the most frequently planted FOVs in the MTs and BTs.
Large-scale farmer-managed MBTs provided valuable information for both the breeding program and farmers. The BTs complemented the MTs by providing results on variety adaptation and stability across a large number of farmers within a short period (one to two seasons). Changes in the predicted probability of good yield appreciation over years confirmed the importance of multi-year testing. Another key outcome of the BTs was the predicted probability of good appreciation of the varieties (data not shown), providing indications of potential market size. These results can guide final decisions for variety release. For farmers, MTs and BTs offered an opportunity to evaluate a range of varieties under their own management conditions, to share observations and knowledge during participatory activities, and to make joint decisions on variety selection (Oberson et al., Reference Oberson, Moussa, Aminou, Kidane, Luo, Giuliani, Weltzien and Haussmann2024). The gained learnings strengthened farmers’ capacity to make informed variety choices. Similarly, large-scale initiatives involving farmers’ organizations have proven effective in shaping learning and priority setting, thereby offering tailored agricultural options to their members (Oberson et al., Reference Oberson, Moussa, Aminou, Kidane, Luo, Giuliani, Weltzien and Haussmann2024).
Conclusion
Participatory large-scale farmer-managed trials conducted under farmers’ own management conditions over two seasons in Eastern Zambia confirmed their potential to rapidly assess variety performance and stability under farmers’ own growing conditions.
Characterization of the mother and baby trials revealed that breeding for adaptation to low nitrogen and delayed fertilization should be considered in the maize breeding strategy for Eastern Zambia. While nitrogen stress remains a major limitation to maize productivity in SSA, greater attention should also be given to adaptation to weed pressure, as weed control is expensive for smallholder farmers and poor weed management accounts for 50–90% of maize yield losses. Further research on breeding maize for weed-suppressive or tolerant traits is therefore recommended. These adaptation traits are of particular importance for women, who provide most of the labour for weeding and often have limited access to soil fertility resources. Prioritizing them in selection will help ensure that women farmers benefit from variety improvement.
The relatively small G × E interaction variance compared with the genotypic variance indicates that selection for genotypic effects across MTs and years can effectively identify superior and stable genotypes. However, indications of specific adaptation to certain management levels could be utilized for variety-specific recommendations. For seed companies with strong farmer partnerships, strengthening their capacity to generate and share reliable information on variety performance and adaptation could provide a competitive advantage in Zambia’s maize seed market, where farmers currently face limited variety choice and a serious lack of information.
Decentralized large-scale variety testing under farmer-managed conditions proved valuable for both breeders and farmers. The good repeatability estimates obtained in the MTs indicate that variety performance under variable and dynamic growing conditions is sufficiently reliable to inform selection decisions. For breeders, this provides robust information on adaptation and stability. Farmers can select varieties that best fit their local conditions.
Supplementary material
The supplementary material for this article can be found at https://doi.org/10.1017/S0014479726100374.
Acknowledgements
We would like to express our sincere gratitude to the staff of the Seeds for Zambian Incomes and Livelihoods (SeZIL) project who contributed to the successful implementation of this research: Prisca Mutale, Bwalya Kangwa, Mickey Mwamba, Andrew Sakala, Nomsa Tembo, and Lawrence Chanda. Our profound gratitude goes to Carl Jensen, Sunday Silungwe, Kellan Hays, and the field staff at GNA for hosting and supporting this research. We are deeply grateful to the mother and baby trial farmers, who were key partners in this research through the implementation of the trials in their fields and their active participation in the research activities. This work is dedicated to them. Further, we also thank the Zambia Agriculture Research Institute for providing some of the genotypes.
Author contributions
NO designed the study, developed the trial protocols, supported the field staff or farmers for data collection, cleaned and analysed the data, and drafted the original manuscript. BIGH, EW, and WLL provided guidance on the study design, data analysis, and reviewed the manuscript. HPP and RC provided support on data analysis and reviewed the manuscript. ATM contributed to the 2022 MT analyses and provided the corresponding initial R script. AG provided guidance throughout the writing process.
Funding statement
This research was embedded in the SeZIL project in Zambia, funded jointly by the Deutsche Investitions- und Entwicklungsgesellschaft mbH (DEG) and KWS SAAT SE & Co. KGaA. Nathalie Oberson received her PhD stipend from KWS SAAT SE & Co. KGaA. The last author, BIG Haussmann, received discretionary research funds from the McKnight Foundation Global Collaboration for Resilient Food Systems (CRFS) to support this publication.
Competing interests
The author(s) declare none.
Use of artificial intelligence tools
During the preparation of this manuscript, the first author used ChatGPT to assist with language editing. After using this tool/service, she reviewed and edited the content as needed and takes full responsibility for the content of the publication.



 Open access

