INTRODUCTION
Detailed and near-continuous reconstructions of relative sea level (RSL) change during the late Holocene (past ∼3000 years) offer insight into the response of sea level to climate variability (e.g., Kopp et al. Reference Kopp, Kemp, Bitterman, Horton, Donnelly, Gehrels, Hay, Mitrovica, Morrow and Rahmstorf2016; Kemp et al. Reference Kemp, Wright, Edwards, Brain, Cahill, Kopp, Horton, Charman, Hawkes and Hill2018; Gehrels et al. Reference Gehrels, Dangendorf, Barlow, Saher, Long, Woodworth, Piecuch and Berk2020). These proxy records demonstrated that the centennial-scale rate of regional and global sea-level rise since the late 19th century is consistent with climate trends and without precedent in at least 3000 years (Kopp et al. Reference Kopp, Kemp, Bitterman, Horton, Donnelly, Gehrels, Hay, Mitrovica, Morrow and Rahmstorf2016; Walker et al. Reference Walker, Kopp, Shaw, Cahill, Khan, Barber, Ashe, Brain, Clear and Corbett2021). At mid- to high latitudes, salt marshes are the primary sedimentary archive used to reconstruct late Holocene RSL (e.g., Gerlach et al. Reference Gerlach, Engelhart, Kemp, Moyer, Smoak, Bernhardt and Cahill2017; Gehrels et al. Reference Gehrels, Dangendorf, Barlow, Saher, Long, Woodworth, Piecuch and Berk2020) and there are increasing efforts to utilize mangrove sediments at low latitudes in this capacity (e.g., Woodroffe et al. Reference Woodroffe, Long, Milne, Bryant and Thomas2015a). The history of sediment accumulation is established by an age-depth model that leverages the stratigraphic relationship between dated depths in a single core (Blaauw and Christen Reference Blaauw and Christen2011; Parnell and Gehrels Reference Parnell and Gehrels2015; Wright et al. Reference Wright, Edwards, van de Plassche, Blaauw, Parnell, van der Borg, de Jong, Roe, Selby and Black2017). The organic nature of salt-marsh and mangrove sediment provides ample material for radiocarbon dating of identifiable macrofossils (such as in-situ stems and rhizomes of salt-marsh plants) or bulk sediment (common for mangroves; e.g., Woodroffe et al. Reference Woodroffe, Long, Punwong, Selby, Bryant and Marchant2015b). Radiocarbon dating is often supplemented by historical markers, which are pollution and land-use trends of known age and provenance recognized in downcore profiles of elemental abundance, isotopic activity, and pollen (Marshall Reference Marshall2015). Efforts to increase the temporal resolution of late Holocene RSL reconstructions, coupled with growing recognition that replication within and among sites is a pre-requisite for distinguishing local- and regional-scale RSL trends will require an increased number of radiocarbon dates (and therefore cost).
The National Ocean Sciences Accelerator Mass Spectrometry (NOSAMS) facility recently developed a new “single-step” method (Elder et al. Reference Elder, Roberts, Walther and Xu2019) to convert samples of organic carbon into graphite for subsequent measurement of radiocarbon by accelerator mass spectrometry (AMS). Briefly (see Elder et al. Reference Elder, Roberts, Walther and Xu2019 for a complete description), a sample and catalysts are placed in a tube that is evacuated, sealed, and baked in a furnace (with a capacity of ∼80 tubes). In contrast, the traditional (hydrogen reduction) method of graphitization employed at NOSAMS requires sample combustion and collection of CO2 in a tube on one line followed by manual transfer of each tube to a second line (the graphite reactor; Gagnon et al. Reference Gagnon, McNichol, Donoghue, Stuart, von Reden, Hayes, Schneider, Elder, Bellino and Long2000), resulting in a daily capacity of up to 20 samples per operator. The single-step method requires significantly less handling and fewer materials than the traditional method, resulting in a ∼50% cost reduction to end users and up to a four-fold increase in daily throughput of samples per operator. Previous comparisons of radiocarbon measurements on standard samples such as oxalic acid, historic tree rings of known age, and swipe samples processed using both single-step and traditional graphitization indicated comparable accuracy, but with a modest increase in measurement error for the single-step method (Elder et al. Reference Elder, Roberts, Walther and Xu2019).
We investigate the potential for single-step graphitization to increase the number and resolution of late Holocene RSL reconstructions developed from salt-marsh and mangrove sediment without a corresponding increase in cost. First, we compare radiocarbon measurements from replicate samples processed at NOSAMS using the single-step and traditional graphite reduction methods. The samples analyzed are plant macrofossils from a core of salt-marsh sediment collected in Massachusetts, USA and bulk mangrove sediment from cores collected on two islands in the Federated States of Micronesia with contrasting geomorphologies. Comparison of results for each core quantifies the relative accuracy, precision, and reliability of the single-step method. Second, we simulate chronologies developed with single-step graphitization by building cost-neutral age-depth models from subsets of published dates in six salt-marsh cores with varied accumulation histories. These simulations assume that the ∼50% reduction in cost for each radiocarbon date is reinvested by dating twice as many samples with increased error in radiocarbon measurements. Uncertainties in the simulated age-depth models are compared to threshold values established in our empirical evaluation of radiocarbon ages from samples that underwent single-step and traditional graphitization.
STUDY SITES
The Short Beach salt marsh is located in Winthrop, Massachusetts (at 42°23'24"N, 70°53'24"W) and displays a pattern of vegetation that is characteristic of salt marshes in the northeastern United States (Bertness Reference Bertness1991; Redfield Reference Redfield1972). Tidal flats are unvegetated and the low salt-marsh floral zone is narrow and vegetated by Spartina alterniflora. The expansive high salt-marsh platform is occupied by a peat-forming community of Spartina patens and Distichlis spicata. Great diurnal tidal range (mean lower low water to mean higher high water) is 3.13 m. The core selected for analysis is comprised ∼4 m of high salt-marsh sediment that accumulated under sustained RSL rise driven by ongoing glacio-isostatic adjustment over the late Holocene at a rate of ∼0.9 mm/yr (Peltier Reference Peltier1996; Engelhart and Horton Reference Engelhart and Horton2012; Piecuch et al. Reference Piecuch, Huybers, Hay, Kemp, Little, Mitrovica, Ponte and Tingley2018). These continuous sequences of high salt-marsh peat are ideal for reconstructing RSL because they accumulated in a narrow elevational range and indicate that the salt-marsh surface tracked RSL rise through time. Furthermore, they usually contain abundant and identifiable plant macrofossils for radiocarbon dating (Niering et al. Reference Niering, Warren and Weymouth1977).
Mangrove forests are the dominant ecosystem on low-energy coasts in the Federated States of Micronesia. On the steep-sided, volcanic island of Pohnpei, the estuarine mangrove forest at Nanitipw (at 6°57'00"N, 158°13'48"E) is vegetated by Rhizophora apiculata, Bruguiera gymnorrhiza, Sonneratia alba, and Xylocarpus granatum, with most coastal fringes occupied by Rhizophora stylosa. Great diurnal tidal range is 0.88 m. The stratigraphy beneath the site is estuarine silt overlain by ∼4 m of organic-rich silt (carbonate is rare in this unit) that accumulated in a mangrove forest during the past ∼5000 years (Fujimoto et al. Reference Fujimoto, Miyagi and Kikuchi1995; Athens and Stevenson Reference Athens and Stevenson2012) in response to sustained RSL rise. Kosrae is also a volcanic island and the study site at Pukusruk (at 5°21'00"N, 163°1'12"E) is a mangrove forest on the open coast vegetated by Rhizophora apiculata, Bruguiera gymnorrhiza, and Sonneratia alba. Great diurnal tidal range is 1.17 m. The stratigraphy underlying the site is coral substrate overlain by ∼2 m of organic silt (carbonate is rare in this unit) that accumulated in a mangrove environment during the past ∼2000 years (Kanawa et al. Reference Kanawa, Miyagi, Fujimoto and Kikuchi1995; Fujimoto et al. Reference Fujimoto, Miyagi, Kikuchi and Kawana1996). In both cores, macrofossils are rarely preserved and are usually roots rather than material that could be reliably interpreted as having formed, or been deposited on, a paleo-mangrove surface (e.g., leaves). Published radiocarbon ages from the two study sites are from bulk mangrove sediment. A scarcity or absence of macrofossils with reliable relationships to paleo surfaces is a common characteristic of late Holocene mangrove sediment in many regions (e.g., Ellison Reference Ellison1993; Sefton et al. Reference Sefton, Woodroffe and Ascough2021; Woodroffe et al. Reference Woodroffe, Long, Punwong, Selby, Bryant and Marchant2015b).
METHODS
Sample Selection
The cores of salt-marsh peat and mangrove sediment were recovered in overlapping, 50-cm long sections using a Russian corer to prevent compaction and contamination during collection. They were stored in rigid plastic sleeves and refrigerated until analysis. The Short Beach core was dissected to isolate in-situ and identifiable plant macrofossils (stems and rhizomes of the common high salt-marsh grasses Distichlis spicata and Spartina patens), with known relationships to paleo salt-marsh surfaces (Niering et al. Reference Niering, Warren and Weymouth1977; van de Plassche et al. Reference van de Plassche, van der Borg and de Jong1998; Donnelly Reference Donnelly2006). From this suite of material, we selected depths with large enough samples to generate replicate radiocarbon dates and to provide approximately even coverage of the core from 0.5 m to 4.0 m. After examining cores from Nanitipw and Pukusruk at the time of collection and finding very few macrofossils, we sliced the collected cores into 1-cm thick increments to provide a suite of bulk-sediment samples for radiocarbon dating from which depths were selected to provide an approximately even down-core distribution.
Sample Preparation and Treatment
Identifiable plant macrofossils found in growth position in the Short Beach core were isolated from the sediment matrix and soaked in deionized and organic-free (MilliQ) water to loosen adhered sediment. Under a binocular microscope any remaining sediment was removed along with plant material that was not part of the target macrofossil (e.g., younger ingrowing rootlets; Kemp et al. Reference Kemp, Nelson, Horton and Schroder2013b). Samples underwent acid-base-acid pretreatment by adding 10–15 mL of 10% HCl. They were left to digest for three hours before being washed to neutral pH with MilliQ water. Approximately 20 mL of 2% NaOH solution was added to each sample and heated in a water bath at 70°C for 30 minutes. This step was repeated until the supernatant remained clear upon addition of more NaOH solution, after which the sample was washed to neutral pH with MilliQ water. Approximately 10–15 mL of 10% HCl was added to the samples and left for one hour before washing to neutral pH with MilliQ water. Samples were then oven dried at 40°C.
Bulk mangrove sediment from Nanitipw and Pukusruk was sieved with MilliQ water to retain the fraction <500 μm and remove large root fragments that are likely to be anomalously young (Kemp et al. Reference Kemp, Vane, Khan, Ellison, Engelhart, Horton, Nikitina, Smith, Rodrigues and Moyer2019; Woodroffe et al. Reference Woodroffe, Long, Punwong, Selby, Bryant and Marchant2015b). This step ensured that the retained sediment was well mixed (homogenized). Water added to the sample during sieving was removed under vacuum to concentrate the sediment onto a glass fiber filter. The sediment was oven dried at 40°C and then transferred into a test tube for acid-only pretreatment. Approximately 10–15 mL of 10%, HCl was added to each sample and they were left to digest for three hours. An acidity of <4 pH was typically achieved by the first acid wash, which indicated a complete reaction (and removal of any carbonates). Samples were washed to neutral pH with MilliQ water and then oven dried at 40°C.
After pretreatment, each sample was divided into two subsamples of approximately equal mass. Each subsample was weighed into a pre-ashed silver capsule and submitted to NOSAMS, where one replicate was converted to graphite using the single-step method and one replicate followed the traditional method.
Conversion to Graphite and Radiocarbon Measurement
The pretreated replicate samples for traditional graphitization were combusted at high temperature and the resulting gas was captured and sealed in a quartz tube (Gagnon et al. Reference Gagnon, McNichol, Donoghue, Stuart, von Reden, Hayes, Schneider, Elder, Bellino and Long2000). Each tube was then manually transferred and cracked to release the gas into a vacuum system where CO2 was purified and quantified before being introduced to a reactor for reduction to graphite using Fe catalyst in the presence of excess hydrogen (Vogel et al. Reference Vogel, Southon and Nelson1987). The pretreated, replicate samples for single-step graphitization were loaded into assembled, prebaked Pyrex tubes with reagents (Elder et al. Reference Elder, Roberts, Walther and Xu2019). The assembled tubes were placed in a muffle furnace for three hours at 500°C and a further four hours at 550°C, during this step graphite formed in the tubes. All graphite was pressed into aluminum cathodes and analyzed on the Continuous Flow AMS system (CFAMS; Roberts et al. Reference Roberts, Burton, Elder, Longworth, McIntyre, von Reden, Han, Rosenheim, Jenkins and Galutschek2010). Blank corrections were applied following a formula that fits the observed mass dependency in measured fraction modern carbon of quality control samples (Roberts et al. Reference Roberts, Elder, Jenkins, Gagnon, Xu, Hlavenka and Longworth2019).
Simulated Age-Depth Models
We explore the effect of adopting single-step graphitization by generating age-depth models using published chronological data from six salt marshes in eastern North America that represent a spectrum of late Holocene accumulation histories (Table 1). Each site has downcore chronological data from a relatively high concentration of uncalibrated radiocarbon dates (all generated by converting macrofossils of common salt-marsh plants to graphite using the traditional method at NOSAMS) and recognition of historical trends and events in pollution and land-use. The number and nature of these markers varies among the six sites. We use reported radiocarbon ages and their uncertainties (i.e., 14C yr BP and ± 14C yr rather than fraction modern) because this is the result that end users typically evaluate and employ in age-depth models. Since ages are rounded following the conventions of Stuiver and Polach (Reference Stuiver and Polach1977) before being reported by NOSAMS they are inherently less precise than the underlying radiocarbon measurements. For each core we divided the available radiocarbon dates into two populations (from even and odd numbered depths) under the premise that a radiocarbon determination made following single-step graphitization (currently) costs ∼50% of the traditional method at NOSAMS. For the odd/even populations an age-depth history was generated using Bchron (Haslett and Parnell Reference Haslett and Parnell2008; Parnell et al. Reference Parnell, Haslett, Allen, Buck and Huntley2008). In generating a history of sediment accumulation, Bchron calibrates reported radiocarbon dates; we use the IntCal20 calibration (Reimer et al. Reference Reimer, Austin, Bard, Bayliss, Blackwell, Ramsey, Butzin, Cheng, Edwards and Friedrich2020) in all analyses. The predicted ages and uncertainties (95% credible interval) for each 1-cm thick interval of the core were then averaged across the two (odd/even depths) age-depth models. This step was first performed using only radiocarbon ages as input for the age-depth models and was then repeated with inclusion of all available historical chronological markers. We refer to these results as control chronologies because they represent accumulation histories developed using existing protocols (traditional graphitization).
Cores of salt-marsh sediment used to simulate chronologies. The mean uncertainty for sample age is the 95% credible interval for the control chronologies that included radiocarbon dates and historical age markers.

We next simulated chronologies generated using the single-step method by using all available radiocarbon ages as input for the age-depth models, but we added extra error to each reported radiocarbon age in increments of 5 14C yr from 0 to 75. For every 1-cm thick increment of the core, we calculated the difference in predicted age and age error (number of years spanned by the 95% credible interval for sample age) between each simulation and the corresponding control chronology. These differences measure the effect of adopting a cost-neutral approach to building core chronologies because there are twice as many samples processed using the single-step method, which has greater error than the traditional method (but at approximately half the cost).
RESULTS
Salt-Marsh Macrofossils
Rhizomes and stems of Distichlis spicata or Spartina patens from 16 depths in the core of salt-marsh sediment from Short Beach were prepared for radiocarbon analysis. Following pretreatment, each sample was divided into two replicates for single-step and traditional graphitization (Figure 1; Supporting Table 1 in Supplementary Material). Radiocarbon ages are stratigraphically ordered and range from 0.632 fraction modern (FM) to 0.982 FM for traditional graphitization (equivalent to 3680–145 14C yr BP) and 0.634–0.983 FM for single-step graphitization (equivalent to 3660–135 14C yr BP). There is an excellent agreement between radiocarbon measurements from single-step and traditional graphitization of replicate samples (Figure 1A). For 13 out of 16 depths, replicate radiocarbon measurements are indistinguishable from one another within their 1σ reported errors. Of the three remaining depths, single-step graphitization resulted in two instances of younger ages (at 121 cm and 180 cm) and one older age (at 78 cm) compared to the traditional method. Radiocarbon measurements on samples converted to graphite using the single-step method have systematically larger uncertainties than those from the traditional method. The additional error ranges from 0 to 0.0015 FM (equivalent to 0–12 14C yr) with a mean of 0.0006 FM (∼5 14C yr; Figure 1B).
Replicate radiocarbon ages from a core of salt-marsh peat collected at Short Beach. (A) Correlation of radiocarbon ages from replicate samples processed using the single-step and traditional methods for converting organic samples to graphite. Bi-directional (1σ) uncertainties are smaller than symbols. Symbol color denotes depth in core and demonstrates the stratigraphic ordering of samples. (B) Difference in reported radiocarbon error for samples processed using the single-step and traditional methods for graphitization. Positive values indicate a larger error for the single-step method. The difference expressed in radiocarbon years is a direct conversion of the fraction modern values. (See online version for color figures.)

Bulk Mangrove Sediment
Replicate radiocarbon measurements from four depths in the Nanitipw core follow stratigraphic ordering and the ages ranged from 0.707 to 0.979 FM when processed using the traditional methods (equivalent to 2785–170 14C yr BP) and 0.716 to 0.979 FM under the single-step method (equivalent to 2684–170 14C yr BP; Figure 2A; Supporting Table 1 in Supplementary Material). At two depths (40 cm and 165 cm), replicate measurements were indistinguishable from one another within 1σ errors, but at the two other depths (240 cm and 365 cm) samples that underwent single-step graphitization yielded younger ages. Radiocarbon uncertainties were larger for the single step method by 0.0018–0.0039 FM (equivalent to ∼15–35 14C yr; Figure 2B).
Replicate radiocarbon ages from cores of mangrove sediment in the Federated States of Micronesia collected from Nanitipw on Pohnpei and Pukusruk on Kosrae. (A) Correlation of radiocarbon ages from replicate samples processed using the single-step and traditional methods for converting organic samples to graphite. Bi-directional (1σ) uncertainties are smaller than symbols. Symbol color denotes depth in core and demonstrates the stratigraphic ordering of samples. Symbol shape differentiates results from Nanitipw and Pukusruk. (B) Difference in reported radiocarbon error for samples processed using the single-step and traditional methods for graphitization. Positive values indicate a larger error for the single-step method. The difference expressed in radiocarbon years is a direct conversion of the fraction modern values. (See online version for color figures.)

A further four bulk sediment samples from the mangrove core at Pukusruk were analyzed in the same way (Supporting Table 1 in Supplementary Material). This sequence of sediment is relatively young with ages ranging from 0.955 to 0.984 FM for traditional graphitization (equivalent to 369–132 14C yr BP) and 0.957 to 0.985 for the single-step method (equivalent to 351–121 14C yr BP; Figure 2A). The radiocarbon measurements do not adhere to stratigraphic ordering. At three depths (35 cm, 91 cm, and 119 cm) ages following traditional and single-step graphitization overlap within their 1σ uncertainties, while the remaining sample (at 63 cm) yielded an age that was 0.0062 FM younger for the single-step method (equivalent to ∼50 14C yr). Radiocarbon measurements were more uncertain following single step preparation by 0.0014–0.0018 FM (equivalent to ∼12 14C yr; Figure 2B). Among all samples of bulk mangrove sediment, the mean increase in error during radiocarbon measurement was 0.0023 FM (equivalent to ∼18 14C yr).
DISCUSSION
Reliability and Precision
Single-step graphitization results in radiocarbon measurements that have systematically larger uncertainties than those made on replicate samples prepared using the traditional method. For salt-marsh macrofossils the difference is modest, with a mean of 0.0006 FM and maximum of 0.0015 FM (Figure 2D). The mean/maximum additional error in reported radiocarbon ages for the same samples is 6.25 and 15 14C yr, respectively. In contrast, the additional error for bulk mangrove sediment was greater (mean of 0.0023 FM; maximum of 0.0039 FM), with mean reported errors being 21.25 14C yr greater (range of 15–40 14C yr). For replicate samples of standards and historic wood, Elder et al. (Reference Elder, Roberts, Walther and Xu2019) attributed the larger error to less efficient conversion of organic carbon to graphite by the single-step method, as evidenced by an average 42% reduction in 12C current measured by the AMS. Reduced 12C current causes larger scatter and reduced counting statistics, resulting in larger error. We evaluate measured 12C currents to investigate if and how reduced yields during single-step graphitization influence radiocarbon error and age.
The 12C current measured in the ion source on salt-marsh macrofossil and bulk mangrove sediment samples is systematically reduced for samples that underwent single-step graphitization (Figure 3). For salt-marsh macrofossils, mean measured 12C current was 61.4 μA (range of 42.9–68.3 μA) for the traditional method compared to 35.8 μA (range of 24.5–51.2 μA) for the single-step method. For individual depths, the mean reduction in 12C current was 40.4% (ranging from –8.5% to 58.3%), which is consistent with results reported by Elder et al. (Reference Elder, Roberts, Walther and Xu2019). Among all samples of bulk mangrove sediment, mean 12C current fell from 53.9 μA (range 40.2–61.4 μA) using the traditional method to 12.0 μA (range of 4.3–18.6 μA) for the single-step method. For individual samples, the mean reduction in 12C current was 78.7% (range 67.2–89.3%), which is considerably larger than the change we observed for salt-marsh macrofossils and the materials studied by Elder et al. (Reference Elder, Roberts, Walther and Xu2019).
12C current measured by the accelerator mass spectrometer. Data are grouped by sample type (salt-marsh macrofossils from Short Beach and mangrove sediment from Nanitipw and Pukusruk) and the method used for conversion to graphite (single step or traditional). For clarity of presentation, individual data points are horizontally jittered to reduce overlap. (See online version for color figures.)

The very low 12C current measured on bulk mangrove sediment that underwent single-step graphitization may occur for two reasons. Firstly, the relatively complex and heterogenous composition of bulk sediment compared to macrofossils likely decreases the efficiency and predictability of reactions during graphitization resulting in reduced yields (Elder et al. Reference Elder, Roberts, Walther and Xu2019). Secondly, regardless of the method used to convert organic carbon to graphite, bulk mangrove sediment generates lower 12C current than salt-marsh macrofossils (Figure 3), possibly due to its lower concentration of organic carbon (mean of ∼13%, compared to ∼47% for the salt-marsh macrofossils) (Elder et al. Reference Elder, Roberts, Walther and Xu2019). Given the very low 12C currents, we consider the radiocarbon measurements from bulk mangrove sediment that underwent single-step graphitization to be unreliable. Although these results appear accurate when compared to those from traditional graphitization (Figure 2), such corroborating evidence is unavailable in most circumstances. Further experimentation (e.g., changing the type and amount of catalysts and reagents) is underway at NOSAMS to refine the single-step method to improve yields from graphitization of bulk organic sediment samples (Elder et al. Reference Elder, Roberts, Walther and Xu2019). However, such changes may need to be made on a case-by-case basis given the likely variability in the composition of bulk organic sediment across space and through time.
The error of radiocarbon measurements increases in a non-linear fashion as 12C current decreases (Figure 4A). Across salt-marsh macrofossils and bulk mangrove sediment, current reductions less than ∼40% resulted in uncertainties that were ∼5 14C yr greater, but current reductions greater than ∼75% caused radiocarbon uncertainties to more than double in some instances and to exceed an additional 20 14C yr in three instances. Differences in sample age under single-step and traditional graphitization hint that greater fractionation of carbon isotopes may occur during single-step graphitization if yields are particularly reduced/low (Figure 4B). Of the five samples with current reductions less than 40%, only one generated a mean radiocarbon age that was older using the single-step method than the traditional method. In contrast, single-step graphitization resulted in an older mean radiocarbon age for 18 of the 19 samples with current reductions greater than 40%. However, the magnitude of this effect appears modest even at extremely low yields and in all but two cases is less than the uncertainty in age difference for individual samples. Similarly, Elder et al. (Reference Elder, Roberts, Walther and Xu2019) showed that single-step graphitization of oxalic acid resulted in 13C/12C values 10% more depleted than those from traditional graphitization of replicate samples. Although those measurements agreed within their 2σ uncertainties, samples that underwent single-step graphitization remained ∼0.5 ‰ more enriched in radiocarbon (or younger) than consensus values.
Correlation between 12C current measured by the accelerator mass spectrometer and (A) the additional error of radiocarbon measurements (FM = fraction modern) associated with single-step graphitization in comparison to the traditional method; and (B) difference in age arising from the two different methods. Negative values indicate that the single-step method resulted in an older age than the traditional method. Solid line and shaded envelope are a LOESS best fit. The dashed line represents the 42% average reduction reported by Elder et al. (Reference Elder, Roberts, Walther and Xu2019) because of less efficient conversion of organic carbon to graphite. (See online version for color figures.)

We conclude that single-step graphitization of salt-marsh macrofossils results in radiocarbon measurements that are accurate (or at least as accurate as those from the traditional method) and reliable (reduced, but acceptable yields during graphitization), but slightly more uncertain (additional <15 14C yr). For bulk mangrove sediment, very low yield arising from low organic content and complex composition results in large inflation of uncertainties and renders the dates unreliable despite apparent accuracy (in the absence of the replicate results from the traditional method). We did not prepare any bulk salt-marsh peat (or mangrove macrofossils) for radiocarbon dating and therefore cannot evaluate definitively if the unreliable results arose from the environment of deposition (mangrove vs salt marsh) or sample type (bulk sediment vs macrofossil). However, the likely explanations of relatively low organic content coupled with complex and heterogenous composition suggest that sample type is the cause and that bulk organic sediment from other depositional environments (including salt marshes) may also return unreliable radiocarbon ages when prepared using single-step graphitization. Further optimization of the single-step method is required for future use with bulk sediment from mangroves and other settings.
Building Sediment Chronologies for Near-Continuous Relative Sea-Level Reconstructions
Efforts to produce near-continuous reconstructions of late Holocene RSL change using organic coastal sediment rely on constraining sedimentation histories using age-depth models (e.g., Wright et al. Reference Wright, Edwards, van de Plassche, Blaauw, Parnell, van der Borg, de Jong, Roe, Selby and Black2017; Kemp et al. Reference Kemp, Wright, Edwards, Brain, Cahill, Kopp, Horton, Charman, Hawkes and Hill2018; Gehrels et al. Reference Gehrels, Dangendorf, Barlow, Saher, Long, Woodworth, Piecuch and Berk2020). From an input dataset of uncalibrated radiocarbon ages and marker horizons at discrete depths, the model estimates the age of each depth in the core (usually 1-cm thick intervals) with uncertainty. We investigated if single-step graphitization could decrease uncertainties in age-depth models in a cost-neutral fashion to facilitate more reliable detection of RSL changes on sub-centennial timescales by comparing the control and simulated chronologies from six sites along the North American Atlantic coast (Table 1). Our analysis was restricted to salt-marsh sites where the radiocarbon-dated material was macrofossils since single-step graphitization of bulk sediment may not result in high enough yields for the measurements to be considered independently reliable (Figures 3 and 4). We adopt two thresholds from the empirical comparison of radiocarbon measurements on salt-marsh macrofossils for evaluating the likely effect of adopting single-step graphitization (Figure 1B). These thresholds are the mean (6.25 14C yr) and maximum (15 14C yr) increase in reported error. Output from the age-depth models are sample age and uncertainty in calendar year.
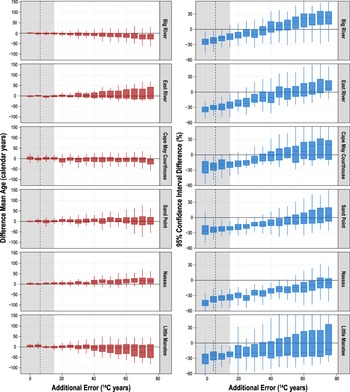
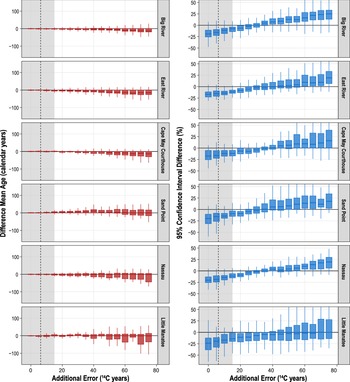
For chronologies developed only from radiocarbon dates on plant macrofossils, there is little difference in the estimated age of 1-cm thick samples between the control and simulated chronologies at all six sites (Figure 5, left column). When the reported radiocarbon error is inflated by 15 14C yr (the maximum difference observed in the empirical data from Short Beach; Figure 1B), the mean difference in sample age between the control and simulated chronologies varies from –2 years (at Big River) to 7 years (at Nassau Landing). One standard deviation of the age difference ranges from 4 years East River to 11 years at Little Manatee. Similarly, for chronologies that also utilize historical age markers, the mean age difference between control and simulated chronologies is small and not systematic (Figure 6, left column). With reported radiocarbon errors inflated by 15 14C yr, the mean difference in sample age ranged from –3 years at East River to 4 years at Sand Point. One standard deviation of the age difference ranged from 4 years at Cape May Courthouse to 11 years at Little Manatee. Across all sites and samples, there is no indication that the mean age of a sample is biased by single-step graphitization when estimated using age-depth models, unless the radiocarbon certainty is inflated by at least 50–60 14C yr (Figure 7A), which our empirical comparison indicates is highly unlikely for salt-marsh macrofossils of late Holocene age (Figure 4A). This result arises because only the error of the radiocarbon age was changed. This presumption is supported by results from Short Beach, which indicate that single-step graphitization does not bias radiocarbon ages on salt-marsh plant macrofossils (Figure 4B).
Difference between control and simulated chronologies at six salt marshes in eastern North America (organized geographically from north to south). The control chronologies included approximately half of the published radiocarbon measurements with their reported uncertainties. The simulated chronologies utilized all radiocarbon measurements, but added additional error at five-year increments. Historical age markers were not used. Left column is the difference in mean sample age, where positive/negative values indicate that age in a simulated chronology is older/younger than age in the corresponding control chronology. Right column is the difference in width of the 95% credible interval expressed as a percentage difference compared to the control chronologies. Negative values indicate that the error is reduced in the simulated chronologies. Dashed vertical line and shaded envelope represent, respectively, the mean (6.25 14C yr) and range (≤15 14C yr) of observed differences in radiocarbon error between single-step and traditional graphitization of salt-marsh plant macrofossils. Box plots represent the median (solid horizontal line), 25th and 75th percentiles (hinges), and the largest value no further than 1.5 times the interquartile range from the hinge (approximately a 95% confidence interval for comparing medians; whiskers). Some 95% confidence intervals extend beyond plot limits for clarity of presentation. (See online version for color figures.)

Difference between control and simulated chronologies at six salt marshes in eastern North America (organized geographically from north to south). The control chronologies included approximately half of the published radiocarbon measurements with their reported uncertainties and all available historical age markers. The simulated chronologies utilized all radiocarbon measurements, but added additional error at five-year increments. All historical age markers were retained and used in the simulated chronologies with their original uncertainties. Left column is the difference in mean sample age, where positive/negative values indicate that age in a simulated chronology is older/younger than age in the corresponding control chronology. Right column is the difference in width of the 95% credible interval expressed as a percentage difference compared to the control chronologies. Negative values indicate that the error is reduced in the simulated chronologies. Dashed vertical line and shaded envelope represent, respectively, the mean (6.25 14C yr) and range (≤15 14C yr) of observed differences in radiocarbon error between single-step and traditional graphitization of salt-marsh plant macrofossils. Box plots represent the median (solid horizontal line), 25th and 75th percentiles (hinges), and the largest value no further than 1.5 times the interquartile range from the hinge (approximately a 95% confidence interval for comparing medians; whiskers). Some 95% confidence intervals extend beyond plot limits for clarity of presentation. (See online version for color figures.)

Comparison of control and simulated chronologies averaged across all sample depths in the six cores of salt-marsh sediment from eastern North America. (A) Difference in age where positive/negative values indicate that age in a simulated chronology is older/younger than age in the corresponding control chronology. (B) Difference in width of the 95% credible interval expressed as a percentage difference compared to the control chronologies. Negative values indicate that the uncertainty is reduced in the simulated chronologies. Series color distinguishes chronologies that did and did not include historical age markers, shaded regions represent the 68% credible interval. Dashed vertical line and shaded envelope represent, respectively, the mean (6.25 14C yr) and range (≤15 14C yr) of observed differences in radiocarbon error between single-step and traditional graphitization of salt-marsh plant macrofossils. (See online version for color figures.)

There is a systematic decrease in the uncertainty of sample ages estimated by age-depth models where twice as many radiocarbon ages are used as input. When only radiocarbon ages (i.e., no historical age markers) constitute the input (Figure 5, right column) and reported radiocarbon error is inflated by 5 14C yr (similar to the mean difference between single-step and traditional ages of 6.25 14C yr observed in the empirical data from Short Beach; Figure 1B), the mean (across all depths in a core) width (number of years) of the 95% credible interval for estimated sample age is reduced by 15.5% (at Little Manatee) to 38.5% (at Nassau Landing). Across all sites and samples, the reduction is 25% (Figure 7B). Inflating the radiocarbon error by 15 14C yr (the maximum difference between single-step and traditional graphitization observed at Short Beach; Figure 1B), results in age-depths models that are 15–34% more precise for single sites (at Big River and Nassau respectively) and 21% across all sites.
A similar pattern occurs in chronologies that include historical markers as input to the age-depth model, but the reduction in the width of the 95% credible interval for sample age is less pronounced. With radiocarbon error increased by 5 14C yr, the improvement in precision was 15–22% for single sites (at East River and Little Manatee respectively; Figure 6, right column) and 16% across all sites and samples (Figure 7B). With radiocarbon error inflated by 15 14C yr, the average improvement in precision was 8–12% for single sites (at Little Manatee and Cape May Courthouse respectively) and 10% across all sites. The smaller improvement for age-models that incorporate historical markers arises because these input ages are usually very precise (a specific calendar year in the case of peak 137Cs activity for example; Corbett and Walsh Reference Corbett and Walsh2015). Despite being restricted to the upper (shallow) section of sediment cores that represent the historical period (Marshall Reference Marshall2015), marker horizons influence age estimates and their uncertainties at lower depths when chronologies (such as those from Bchron) are developed using repeated, equiprobable sampling of stratigraphically ordered samples (Parnell and Gehrels Reference Parnell and Gehrels2015; Wright et al. Reference Wright, Edwards, van de Plassche, Blaauw, Parnell, van der Borg, de Jong, Roe, Selby and Black2017). In effect, the presence of historical markers narrows the pool of plausible age-depth relationships and diminishes the sensitivity of age-depth models to the size of radiocarbon uncertainties at depth.
A convenient measure of when single-step graphitization is likely to cease generating age-depth models with narrower 95% credible intervals for sample age is to identify when the mean change in precision becomes positive. For chronologies developed using only radiocarbon, this occurs when reported radiocarbon errors are inflated by at least 40 14C yr (at Big River) and in the case of Little Manatee and Nassau Landing is at more than 75 14C yr (Figure 5, right column). For chronologies that also include historical markers, this threshold is reached with a smaller increase in radiocarbon error (but at least 30 14C yr; Figure 6, right column). Given that the maximum observed increase in reported radiocarbon error is just 15 14C yr, we conclude that radiocarbon dating twice as many salt-marsh plant macrofossils is likely to result in a more precise age-depth model when compared to chronologies using fewer, more precise radiocarbon ages. Therefore, adopting single-step graphitization for building chronologies of salt-marsh peat accumulation is advantageous over continuing to use the traditional method. This advantage can be delivered at no additional cost to the end user (although additional sample submissions could potentially increase turnaround times at some radiocarbon laboratories).
A caveat to our conclusion is that that the empirical thresholds we established through comparison of radiocarbon ages on replicate samples were derived from macrofossils of Spartina patens and Distichlis spicata. These are the dominant salt-marsh grasses between approximately Delaware and Massachusetts on the Atlantic coast of North America. From Virginia southward, the dominant salt-marsh grass is Juncus roemerianus (Eleuterius Reference Eleuterius1976), although even here Distichlis spicata is often disproportionately radiocarbon dated because of its robust preservation (Kemp et al. Reference Kemp, Kegel, Culver, Barber, Mallinson, Leorri, Bernhardt, Cahill, Riggs and Woodson2017). Salt marshes in Maine and the Canadian Maritimes are often characterized by a more diverse flora that includes Juncus gerardii and Triglochin sp. (Scott et al. Reference Scott, Williamson and Duffett1981; Daly et al. Reference Daly, Belknap, Kelley and Bell2007; Johnson et al. Reference Johnson, Moore, Lehmann, Bohlen and Brown2007). Although it is possible that the increase in radiocarbon error from single-step graphitization is species (and therefore location) dependent, we contend that the relatively high organic content and homogeneity of salt-marsh plant macrofossils regardless of species (Gabriel and de la Cruz Reference Gabriel and de la Cruz1974; Wang et al. Reference Wang, Chen and Berry2003; Kemp et al. Reference Kemp, Vane, Horton and Culver2010) is likely to ensure that the yield from single-step graphitization is sufficiently high to cause only a modest increase in error. Therefore, our results from Short Beach are probably applicable to efforts to establish salt-marsh accumulation histories by radiocarbon dating plant macrofossils across a wide range of salt-marshes in eastern North America (such as those used for simulating chronologies; Table 1, Figures 5 and 6) and other regions (e.g., Gehrels et al. Reference Gehrels, Szkornik, Bartholdy, Kirby, Bradley, Marshall, Heinemeier and Pedersen2006; Long et al. Reference Long, Woodroffe, Milne, Bryant, Simpson and Wake2012) despite their floral diversity. Likewise, paleoenvironment reconstructions from other sedimentary environments (e.g., peatlands) that utilize radiocarbon dating of plant macrofossils to build age-depth models for cores (e.g., Swindles et al. Reference Swindles, Blundell, Roe and Hall2010; Kołaczek et al. Reference Kołaczek, Gałka, Lamentowicz, Marcisz, Kajukało-Drygalska and Karpińska-Kołaczek2019) may achieve improved chronological precision by adopting single-step graphitization.
CONCLUSIONS
A fundamental step in producing near-continuous, late Holocene RSL reconstructions from salt-marsh and mangrove sediment is constraining the history of sedimentation for a core. This task is usually performed by applying an age-depth model to radiocarbon-dated plant macrofossils or bulk sediment and historical age markers from discrete depths with known stratigraphic relationships to one another. Increasing the number and resolution of detailed RSL reconstructions therefore requires more radiocarbon dates. However, adopting single-step graphitization presents an opportunity to increase the precision of age-depth models without a corresponding increase in cost. We compared replicate radiocarbon measurements following single-step and traditional graphitization of salt-marsh macrofossils from a core collected in Massachusetts and bulk mangrove sediment from cores collected on Pohnpei and Kosrae (Federated States of Micronesia). Replicate radiocarbon ages were largely indistinguishable from one another, but single-step graphitization results in larger radiocarbon error (mean increase of 6.25 14C yr for salt-marsh macrofossils) because of reduced yield. For mangrove sediment the yield following single-step graphitization was too low (as evidenced by 12C currents on the ion source) to produce radiocarbon measurements that can be considered independently reliable. This problem is likely to arise in bulk sediment with relatively low organic content and heterogenous composition from other depositional environments (including salt marshes).
We simulated chronologies for six cores of salt-marsh peat at sites in eastern North America (Newfoundland to Florida) to investigate the likely impact of adopting single-step graphitization, which enables researchers to have approximately twice as many radiocarbon-dated depths in a core at no extra cost, but with larger error for each date. This analysis suggests that if the additional error from single-step graphitization of macrofossils does not exceed ∼30 14C yr (for cores with historical age markers), then the resulting age-depth model can be made more precise with no increase in cost over continuing to use traditional graphitization of about half as many samples. Despite regional differences in taxa, the increased radiocarbon error for plant macrofossil samples prepared by single-step graphitization (≤15 14C yr) observed in Massachusetts is likely representative of late Holocene macrofossils from salt marshes in other regions and in other depositional environments (e.g., peatlands and mangroves). We therefore anticipate that age-depth models are likely to be >20% more precise for chronologies constrained only by radiocarbon ages and >10% more precise for chronologies that also include historical age markers. The more modest improvement identified in chronologies that include historical age markers arises from the tight limitations they place on the age of shallow sediment, which subsequently influences sedimentation histories in older, deeper parts of the core.
SUPPLEMENTARY MATERIAL
To view supplementary material for this article, please visit https://doi.org/10.1017/RDC.2022.55.
ACKNOWLEDGMENTS
This work was supported by National Science Foundation (NSF) awards OCE-1831382, OCE-2002431, and OCE-1942563, as well as by NSF NOSAMS cooperative agreement OCE-1755125. Jack Ridge participated in fieldwork at Short Beach and we thank Simon Engelhart (supported by NSF award OCE-1831405), Byron Halavik, Madeline Varney, Maxim, and Yosta for their assistance in collecting the mangrove cores from Pohnpei and Kosrae. Access to Nanitipw was made possible by Saimon Lihpai (Pohnpei Forestry Service). We are grateful to Blair Charley (Kosrae Island Resource Management Authority) for facilitating access to field sites on Kosrae. We thank Robin Edwards and an anonymous reviewer for providing thoughtful comments that helped to improve this manuscript.