



1. Introduction
Sound emitted in flows past a circular cylinder is an important benchmark aeroacoustic problem and is representative of noise generated by bluff-body flows in a wide range of engineering applications, ranging from transportation engineering (e.g. aircraft landing gears, automobile side mirrors and antennae, train pantograph, unmanned aerial vehicles, etc. (Khalighi et al. Reference Khalighi, Snegirev, Shinder, Lupuleac and Chen2012; Thompson et al. Reference Thompson, Latorre Iglesias, Liu, Zhu and Hu2015; Alqash, Dhote & Behdinan Reference Alqash, Dhote and Behdinan2019)) to civil engineering (e.g. fences, cables, towers, buildings, smoke stacks, etc. (Bolduc & Bell Reference Bolduc and Bell2018; Xu & Xu Reference Xu and Xu2018)). In the far field, regarding sound-wave patterns, previous studies (Gerrard Reference Gerrard1955; Etkin, Korbacher & Keefe Reference Etkin, Korbacher and Keefe1957) showed that the sound exhibits a dipole nature, which consists of a predominant fundamental frequency accompanied by several harmonics, and that the fundamental tone radiates most strongly in the direction perpendicular to the free stream direction, while the first harmonic radiates most strongly in the free stream direction. Regarding the sound strength, Inoue & Hatakeyama (Reference Inoue and Hatakeyama2002) found that the fundamental tone is strongly dominant over the first harmonic tone in two-dimensional laminar cylinder flows at  $Re = 150$. Khalighi et al. (Reference Khalighi, Mani, Ham and Moin2010) confirmed the dominant nature of the fundamental tone by studying the sound directivity at the fundamental and three harmonic frequencies in low-Mach-number cylinder flows at
 $Re = 100$ and
 $10\,000$. Regarding the sound propagation angle, Inoue & Hatakeyama (Reference Inoue and Hatakeyama2002) showed that at
 $Ma=0.2$ the acoustic waves propagate at an angle of
 $\theta _p=\pm 79^{\circ }$ with respect to the upstream flow direction, and that the propagation angle varies with the Mach number as
 $\theta _p=\cos ^{-1}(Ma)$. The large eddy simulation (LES) studies of Lysenko, Ertesvåg & Rian (Reference Lysenko, Ertesvåg and Rian2014) confirmed this approximative relation between the propagation angle and Mach number by predicting the propagation angles in a laminar flow at
 $Re=140$,
 $Ma=0.2$ and a turbulent flow at
 $Re=22\,000$,
 $Ma=0.06$.
1.1. Motivation and objective
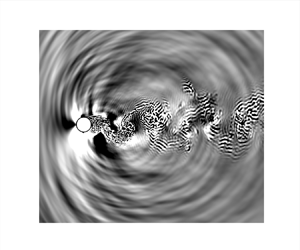
In contrast to the numerous studies on sound wave propagation in the far field of a cylinder, much less attention has been paid to the challenging issue of identifying sound sources in the near field. Figure 1 shows an instantaneous dilatation in both far and near fields for  $Ma=0.4$. Inoue & Hatakeyama (Reference Inoue and Hatakeyama2002) observed that the sound-pressure waves are generated primarily by vortex shedding from the cylinder surface into the wake. A negative pressure pulse is produced on one side when a vortex is shed from that side of the cylinder surface, while a positive pressure pulse is produced on the opposite side. These alternate pressure fluctuations on both sides of the cylinder surface are sound sources. Tamura & Tsutahara (Reference Tamura and Tsutahara2010) performed direct numerical simulations (DNS) on laminar flows at
 $Re=150$ and 200 over a circular cylinder at various Mach numbers ranging from
 $0.2 \leq Ma \leq 0.9$. They qualitatively compared the contours of the sound pressure and the vorticity distribution at
 $Ma=0.3$, and suggested that the oscillating flow just behind the cylinder is a sound source for low Mach number flows.
Instantaneous dilatation field of a circular cylinder at  $Re=3900$ and
 $Ma=0.4$ with contour levels between
 $-0.01 c_{\infty }/D$ and
 $0.01 c_{\infty }/D$: (a) far field; (b) near field.

Recently, the cylinder near-field sound sources have been detected using the cross-correlation method. Using the Poisson equation, Oguma, Yamagata & Fujisawa (Reference Oguma, Yamagata and Fujisawa2013) reconstructed the near-field pressure from the velocity field measured by particle image velocimetry (known as PIV) at  $Re = 40\,000$. They then computed the cross-correlation coefficient between the pressure fluctuation in the cylinder near field and the measured sound pressure fluctuation in the far field. On the cylinder surface, it was found that the cross-correlation magnitude increased downstream along the cylinder surface to the separation point, but then gradually decreased farther downstream, suggesting that the pressure fluctuation generated around the flow-separation point on the cylinder surface is a sound source. In the near wake of the circular cylinder, the cross-correlation magnitude was as large as that on the circular cylinder and gradually decreased with increasing distance from the cylinder downstream near field, which again demonstrated that the oscillating flow just behind the cylinder is a sound source. More recently, Zhang, Moreau & Sanjosé (Reference Zhang, Moreau and Sanjosé2019a) and Zhang, Sanjose & Moreau (Reference Zhang, Sanjose and Moreau2019b) performed a wall-resolved LES of a circular cylinder at a critical Reynolds number of
 $Re = 243\,000$ and a subsonic Mach number of
 $Ma=0.2$. They observed two broadband sound sources in the wake, one at low frequencies caused by the oscillating near wake and the other at high frequencies caused by the Kelvin–Helmholz (known as KH) shear-layer instability.
Although these recent studies have presented a clear picture of the locations of the cylinder sound sources, assessment of the propagating capacity and quantification of the radiating versus non-radiating components of these sound sources, which would go a long way towards unveiling the sound generation mechanisms, are not yet available for this important benchmark aeroacoustic problem. The objective of the present study is therefore to assess the propagating capacity, isolate the radiating components from the non-radiating counterparts, and to quantify the radiating acoustic sound sources versus the non-radiating hydrodynamic pseudo-sounds of these two sound sources above the cylinder surface, and in the region surrounding the oscillating near wake just behind the cylinder itself.
1.2. Previous studies of sound sources and pseudo-sounds
While sound and pseudo-sound generation on and around a circular cylinder remains unclear, much recent progress has been made in understanding sound and pseudo-sound generation in the near field of jets. Tinney et al. (Reference Tinney, Jordan, Hall, Delville and Glauser2007) first emphasized the importance of separating acoustic pressure fluctuations from hydrodynamic perturbations in compressible jets. Taking into account the phase-velocity signature characteristic of the propagating wave field, Tinney & Jordan (Reference Tinney and Jordan2008) applied a Fourier filtering operation to isolate the pressure fluctuation related to the propagating acoustic modes, known as the acoustic component, from the hydrodynamic component, which was also referred to as the pseudo-sound by Ribner (Reference Ribner1962). On the one hand, the hydrodynamic pressure fluctuation attenuates rapidly with distance (Ribner Reference Ribner1962; Suzuki & Colonius Reference Suzuki and Colonius2006) and is almost unaffected by fluid compressibility (Ffowcs Williams Reference Ffowcs Williams1969). It contains local information concerning localized turbulent structures, and therefore is very strongly determined by the turbulence in the flow (Tinney & Jordan Reference Tinney and Jordan2008). On the other hand, the acoustic pressure fluctuation attenuates more slowly with distance. It is associated with sound waves propagating at the speed of sound and is governed by the linear wave equation (Ristorcelli Reference Ristorcelli1997; Mancinelli et al. Reference Mancinelli, Pagliaroli, Di Marco, Camussi and Castelain2017).
Recognizing that Fourier filtering may lead to an incomplete description of near-field sound, Grizzi & Camussi (Reference Grizzi and Camussi2012) developed a wavelet-based method to separate acoustic and hydrodynamic pressure fluctuations. Their method is based on the fact that hydrodynamic pressure fluctuations are localized both in time and in physical space. As such, the hydrodynamic pressure fluctuations compress well on a wavelet basis. Separation between acoustic and hydrodynamic pressure fluctuations is accomplished by selecting a wavelet coefficient threshold whose amplitude is determined on the basis of the propagation velocity of pressure perturbations. The application of such a decomposition technique thus relies on the simultaneous acquisition of pressure fluctuation time series from two near-field positions located sufficiently close to each other.
More recently, Mancinelli et al. (Reference Mancinelli, Pagliaroli, Di Marco, Camussi and Castelain2017) proposed three novel wavelet decomposition approaches to improve the efficiency of the method proposed by Grizzi & Camussi (Reference Grizzi and Camussi2012) and to simplify the experimental set-up required for the practical application of the procedure. In their first decomposition approach, a proper threshold is selected according to the maximum cross-correlation value between the guessed acoustic component of the near-field pressure fluctuation and the far-field pressure fluctuation. The hydrodynamic component of the original near-field pressure fluctuation is extracted by selecting those wavelet coefficients exceeding the selected threshold in absolute value, the remaining part being the acoustic component. In their second approach, the threshold for decomposition is determined based on the closest comparison between the probability density function (p.d.f.) of the guessed acoustic component and a Gaussian distribution. In their third approach, the technique originally developed by Ruppert-Felsot, Farge & Petitjeans (Reference Ruppert-Felsot, Farge and Petitjeans2009) to extract the vorticity field is applied to the pressure fluctuation field to isolate the hydrodynamic pressure fluctuations from the acoustic counterparts since the hydrodynamic pressure fluctuations are related to temporally and spatially localized coherent structures. Iterative processes are necessary in all three approaches to obtain the optimal threshold value for decomposition, and all three approaches result in a very similar separation of near-field pressure fluctuations in compressible jets measured in an anechoic wind tunnel (Mancinelli et al. Reference Mancinelli, Pagliaroli, Di Marco, Camussi and Castelain2017).
1.3. Procedure in the present work
Guided by the overall objective of assessing the propagating capacity and quantifying the radiating versus the non-radiating components of the aforementioned two sound sources in the cylinder near field, and motivated by the recent success in demarcating the acoustic pressure fluctuations from the hydrodynamic counterparts in subsonic jet-noise experiment of Mancinelli et al. (Reference Mancinelli, Pagliaroli, Di Marco, Camussi and Castelain2017), we first performed DNS of sound generation and propagation in subsonic flows over a circular cylinder at  $Re = 3900$,
 $Ma=0.2$ and
 $0.4$. This flow contains features such as a thin laminar boundary layer, transitional separated shear layer and turbulent wake, and is a well-documented benchmark in the subcritical regime (Mani, Wang & Moin Reference Mani, Wang and Moin2008; Mani, Moin & Wang Reference Mani, Moin and Wang2009). It is observed that in a downstream slender region surrounding the oscillating near wake just behind the circular cylinder, the sound pressure levels (SPL) are almost as high as those on the cylinder surface itself. In contrast to the pressure fluctuations generated on the cylinder surface, which radiate strongly to the far field, the pressure fluctuations in this region hardly radiate to the far field. Rather, they decay rapidly with the distance from this region.
Second, to isolate the radiating sound source from the non-radiating counterpart, the wavelet decomposition technique proposed by Mancinelli et al. (Reference Mancinelli, Pagliaroli, Di Marco, Camussi and Castelain2017), previously used in subsonic jet-noise experiments, is applied to decompose the cylinder near-field pressure fluctuations into the radiating acoustic sound source and the non-radiating hydrodynamic pseudo-sound. Rigorous independence and convergence analyses of the wavelet decomposition procedure are performed prior to applying this technique to separate the cylinder near-field pressure fluctuations. We demonstrate that the separation of near-field pressure fluctuations does not depend on the selection of pressure fluctuation at a far-field position as the input for the wavelet procedure, and that the present sampling time series of pressure fluctuations are sufficiently long that the statistical convergence criterion is satisfied. It is found that the radiating acoustic component strongly dominates over the non-radiating hydrodynamic component at near-field locations above and upstream of the cylinder. In the region surrounding the oscillating near wake just behind the cylinder, the non-radiating hydrodynamic component dominates over the radiating acoustic component, except at the vortex shedding frequency where both acoustic and hydrodynamic components exhibit comparable strength. These results thus explain our observation that the high-level pressure fluctuations in the oscillating near-wake region just behind the cylinder hardly radiate but decay rapidly.
Third, we propose replacing the pressure fluctuation input at a far-field position as required by the wavelet technique with pressure fluctuation at a near-field position. This alternative wavelet decomposition yields an essentially similar decomposition between acoustic and hydrodynamic pressure fluctuations in the cylinder near field. An advantage of using pressure fluctuation at a near-field position as the input for the wavelet procedure is that the pressure fluctuation signal in the cylinder far field is not necessary and thus the computational domain size can be greatly reduced for future studies on cylinder near-field sound sources.
Compared with the previous studies on cylinder noise sources, the separation of the acoustic and hydrodynamic pressure fluctuations in the cylinder near field goes a long way towards better characterizing the sound production mechanisms which provide valuable insight into noise control in practical engineering applications. For example, effective noise control techniques can be designed to suppress the radiating acoustic component of pressure fluctuations. With the strongly radiating sound sources identified and localized, an application of noise control techniques to the strongly radiating zones of sound sources, rather than the whole cylinder, is expected to be an economic way to achieve noise reduction.
1.4. Outline
This paper is organized as follows. Section 2 is devoted to a description of the wavelet decomposition technique. The details of the numerical methods, the simulation set-up and the flow field validation against existing references are described in § 3. Results pertaining to the cylinder near-field radiating acoustic and non-radiating hydrodynamic pressure fluctuations are discussed in § 4. More specifically, pressure fluctuations in both the near field and far field are presented and discussed in § 4.1. The independence and convergence analyses of the wavelet decomposition procedure are presented in § 4.2. The characteristics of the acoustic and hydrodynamic pressure fluctuations separated by the wavelet technique are then presented in § 4.3. Radiation of the acoustic pressure fluctuations and decay of the hydrodynamic pressure fluctuations are presented in § 4.4. Wavelet decomposition using a pressure fluctuation at a near-field position in place of the far-field position is shown in § 4.5. Finally, concluding remarks are summarized in § 5.
2. Wavelet-based technique for the decomposition of near-field pressure fluctuations
In recent decades, wavelet analysis has attracted much attention in processing signals obtained from turbulent flows. Compared with Fourier analysis, wavelet analysis is capable of providing localized temporal and scale (frequency) information and thus provides more local details of the signal. The reader may refer to Mallat (Reference Mallat1989), Daubechies (Reference Daubechies1992), Strang & Nguyen (Reference Strang and Nguyen1996), Meneveau (Reference Meneveau1991), Farge (Reference Farge1992) and Schneider & Vasilyev (Reference Schneider and Vasilyev2010) for comprehensive reviews of wavelet theory and its applications in turbulent flows.
The continuous wavelet transform (known as CWT) of a pressure fluctuation time series  $p'(t)$ consists of a projection over a basis of compact support functions obtained by the dilation and translation of the mother wavelet function
 $\varPsi (t)$ which is localized in both temporal and transformed space. According to Meneveau (Reference Meneveau1991) and Camussi & Guj (Reference Camussi and Guj1997), the wavelet coefficient
 $w$, which is a function of the translation time
 $(t)$ and the resolution time scale
 $(s)$, is given by
 \begin{equation} w(s, t) = C_{\varPsi}^{{-}1/2} s^{{-}1/2} \int_{-\infty}^{\infty} {\varPsi}^{*} \left(\frac{\tau-t}{s}\right) p'(\tau)\,\mathrm{d}\tau, \end{equation}
where  ${\varPsi }^{*} ((\tau -t)/s)$ is the complex conjugate of the dilated and translated mother wavelet function
 $\varPsi (t)$ and
 $C_{\varPsi }$ can be obtained from the admissibility condition
 \begin{equation} C_{\varPsi} = \int_{-\infty}^{\infty} |\omega|^{{-}1} |\hat{\varPsi}(\omega)|^2 \,\mathrm{d}\omega<\infty. \end{equation}
Here  $\hat {\varPsi }(\omega )$ is the Fourier transform of
 $\varPsi (t)$,
 \begin{equation} \hat{\varPsi}(\omega) = \int_{-\infty}^{\infty} \varPsi(t) \,\textrm{e}^{{-}j\omega t} \,\mathrm{d}t. \end{equation}
If the wavelet is admissible, that is,  $\varPsi (t)$ satisfies (2.2), the inverse wavelet transform is given by (Grossmann & Morlet Reference Grossmann and Morlet1984; Meneveau Reference Meneveau1991)
 \begin{equation} p'(t) = C_{\varPsi}^{{-}1/2} \int_{0}^{\infty} \int_{-\infty}^{\infty} s^{{-}1/2} {\varPsi} \left(\frac{t-\tau}{s}\right) w(s, \tau) \frac{\mathrm{d}\tau \,\mathrm{d}s}{s^2}. \end{equation}
Due to its finer scale resolution, the continuous wavelet transform is an ideal candidate for studying the unsteady pressure signal and its connection with intermittent hydrodynamic events, see Sanjose et al. (Reference Sanjose, Towne, Jaiswal, Moreau, Lele and Mann2019) for a recent application in airfoil aeroacoustics. In many cases, a discrete wavelet transform (known as DWT) can also be used for the unsteady pressure fluctuation signal processing. The discrete wavelet coefficient is obtained as follows (Meneveau Reference Meneveau1991):
 \begin{equation} w^{(s)}(n) = \sum_{i={-}\infty}^{\infty} g^{(s)}(n-2^si)p'(i), \end{equation}
where  $s$ represents the discretized scale and
 $g^{(s)}(i)$ is the discrete version of
 $\varPsi ^{(s)}(t)$.
The decomposition between acoustic and hydrodynamic components can be achieved by applying a proper threshold to the wavelet coefficients. As pointed out by Mancinelli et al. (Reference Mancinelli, Pagliaroli, Di Marco, Camussi and Castelain2017), their first wavelet technique requires pressure fluctuation signals at two different positions, one in the near field and the other in the far field. The near field refers to the region within a wavelength of sound waves and the far field refers to the region where the distance between the sound source and the observer is greater than the wavelength of sound waves. On the one hand, the amplitude of the hydrodynamic fluctuations decreases very rapidly with the increase in radial distance from the near field (Suzuki & Colonius Reference Suzuki and Colonius2006) so that the near-field acoustic component is the only one to reach the far field and thus correlates well with the far-field sound. On the other hand, according to Grizzi & Camussi (Reference Grizzi and Camussi2012), the hydrodynamic contribution, being related to temporally and spatially localized vortices, compresses well on a wavelet basis. Therefore, it is straightforward to iteratively guess the threshold and compute the cross-correlation between the guessed acoustic component of the near-field pressure fluctuation and the far-field pressure fluctuation to find out the maximum cross-correlation coefficient peak at which the proper threshold is selected for the decomposition of pressure fluctuations. The wavelet coefficients exceeding the selected threshold in magnitude thus correspond to the hydrodynamic component, the remaining part of the pressure fluctuation being the acoustic component. The reasoning behind such a decomposition technique traces back to the signal denoising method developed by Donoho & Johnstone (Reference Donoho and Johnstone1994). In order to make the risk as small as possible, Donoho & Johnstone (Reference Donoho and Johnstone1994) proposed a threshold
 \begin{equation} T_0 = \sqrt{2\langle p'^2 \rangle \log_2 N_s}, \end{equation}
where  $\langle p'^2 \rangle$ is the variance of the pressure fluctuation and
 $N_s$ is the length of the pressure fluctuation time series. The choice of such a threshold gives a minimax solution to the problem of minimizing the ideal mean squared error between the estimator and the signal without noise. For this
 $T_0$, the thresholding rule produces a mean squared error or risk that is always smaller than a constant multiplied by the summation between the noise level squared and the ideal mean squared error (Donoho & Johnstone Reference Donoho and Johnstone1994; Vidakovic Reference Vidakovic1999).
Starting from an initial guess of the threshold  $T_0$, the threshold is changed in each iterative process until the cross-correlation coefficient peak between the separated acoustic pressure fluctuation in the near field and the pressure fluctuation in the far field reaches a maximum value. The threshold corresponding to this maximum value will be selected for the decomposition of the near-field pressure fluctuation. The wavelet filter used in the present work is the Daubechies-12 type as also used by Mancinelli et al. (Reference Mancinelli, Pagliaroli, Di Marco, Camussi and Castelain2017), however, different filter types have no influence on the results. The wavelet analysis procedure is carried out in MATLAB.
To be consistent with Mancinelli et al. (Reference Mancinelli, Pagliaroli, Di Marco, Camussi and Castelain2017), hereinafter, the near-field pressure fluctuation, acoustic pressure fluctuation and hydrodynamic pressure fluctuation in the cylinder near field will be denoted as  $p_{NF}$,
 $p_{A}$ and
 $p_{H}$, respectively, and the pressure fluctuation in the cylinder far field as
 $p_{FF}$.
3. Numerical methods and simulation set-up
3.1. Numerical methods
The three-dimensional unsteady compressible Navier–Stokes equations are solved by the finite difference method. The structured staggered grid is adopted to improve the robustness of the finite difference schemes. Sixth-order compact finite difference schemes (Lele Reference Lele1992) are used for both spatial discretization and interpolation between staggered and collocated grid nodes, except that third-order and fourth-order schemes are used for the nodes at and near the boundaries. For time advancement, a second-order implicit time marching method developed by Beam & Warming (Reference Beam and Warming1976) is used for the region near the wall and a third-order explicit three-step Runge–Kutta scheme is used in the region far away from wall. At the wall, no-penetration, no-slip and adiabatic boundary conditions are applied. Periodic boundary conditions are used in the spanwise direction. In addition, inflow and outflow boundary conditions are required for the simulation of spatially developing flows. The inflow boundary conditions are based on the family of the linearized boundary conditions developed by Giles (Reference Giles1990). The outflow boundary conditions are based on the parabolized Navier–Stokes equations (Collis Reference Collis1997). Additionally, a sponge layer is carefully designed and applied at the outer boundary to silently damp the unsteady flow features and outgoing waves and thus ensures non-reflecting boundary conditions. See Wang, Freund & Lele (Reference Wang, Freund and Lele2006) for a comprehensive discussion of computational aeroacoustic requirements, and Nagarajan, Lele & Ferziger (Reference Nagarajan, Lele and Ferziger2003) for a detailed description of the governing equations and numerical methods.
3.2. Simulation set-up
The computational domain is a cylindrical domain with a diameter of approximately  $91D$ and a spanwise width of
 ${\rm \pi} D$, where
 $D$ is the diameter of the cylinder. In order to be aligned with the dominant radiating acoustic wave fronts, the stationary cylinder is not located at the centre of the computational domain but located at
 $9D$ upstream of the centre of the computational domain. The grid size is
 $640 \times 1151 \times 96$ in the circumferential, radial and spanwise directions, respectively. The wall-normal grid spacing of the first grid point from the wall is
 $\delta _{1st}=0.0003D$ at the leading edge of the cylinder, which expands to
 $\delta _{far}= 0.06D$ in the downstream far wake. The grid resolution for the present simulations is intentionally higher than conventional DNS requirements in order to accurately capture both hydrodynamic features and acoustic waves.
Two high-fidelity DNS of uniform flow without inflow turbulence over a stationary circular cylinder at  $Re=3900$ based on the free stream velocity and diameter of the cylinder, at
 $Ma=0.2$ and
 $0.4$, respectively, are performed. The time step for both cases is
 ${\rm \Delta} t=9.8\times 10^{-3} D/c_\infty$. After the initial transient stages of the simulations, time series of the dimensionless pressure
 $(p/\rho _{\infty }c_{\infty }^2)$ are collected over 100 and 160 shedding cycles, respectively, for analysis. The sampling positions are shown in figure 2 with the circular cylinder located at the origin. The sampling positions are selected along different radial lines ranging from
 $0^{\circ }$ to
 $180^{\circ }$ with an increment of
 $10^{\circ }$, and along different half-circles with their centres gradually moving downstream in order to be consistent with the mesh nodes. The grid resolution at all these sampling positions is sufficient for the high-frequency noise. Given that the sampling positions are located on radial lines at different polar angles, hereinafter, polar coordinate
 $(r, \theta )$ will be used to describe the positions, where
 $r$ is the radial distance from the origin and
 $\theta$ is the angle with the upstream centreline, as shown in figure 3.
Sampling positions from the cylinder near field to its far field.

A uniform flow over a circular cylinder:  $r$ is the radial distance from the origin and
 $\theta$ is the angle with the upstream centreline.

3.3. Flow features and flow validation
Figure 4 shows the instantaneous contours of dilatation and vorticity magnitude around a circular cylinder at  $Re=3900$ and
 $Ma=0.4$. As the flow passes through the upper and lower surfaces of the cylinder, the fluid dilatation remains negative near the flow separation point on both sides of the cylinder surface. This negative-dilatation region around the separation point varies with time due to the interaction between the unsteady separated shear layer and the cylinder surface. According to the vorticity contours, as the vortices are shed alternately into the wake, the angle of the separated shear layer with the horizontal cylinder tangent line varies with time and the separated shear layer interacts with the cylinder surface alternately. The time-dependent variation of dilatation around the flow separation point suggests that the pressure fluctuation around the flow separation point is the sound source previously detected by Oguma et al. (Reference Oguma, Yamagata and Fujisawa2013) and Oguma, Yamagata & Fujisawa (Reference Oguma, Yamagata and Fujisawa2014).
Instantaneous flow fields of a circular cylinder at  $Re=3900$ and
 $Ma=0.4$: (a–c) vorticity magnitude with contour levels between
 $2 c_{\infty }/D$ and
 $50 c_{\infty }/D$; (d–f) dilatation with contour levels between
 $-0.01 c_{\infty }/D$ and
 $0.01 c_{\infty }/D$ at
 $tc_{\infty }/D=210$,
 $581$ and
 $983$, respectively. The arrows point to the negative-dilatation region around the flow separation point.

To validate the flow field, we compare the major flow statistics in the cylinder near field from the present simulations with existing references. Figure 5 shows the mean velocity and normal components of Reynolds stress in the streamwise and cross-flow directions in comparison with previous studies. The present results at  $Ma=0.2$ are similar to the LES results of Mani (Reference Mani2009) but get closer to the hot-wire measurements of Ong & Wallace (Reference Ong and Wallace1996) in mean velocities, especially at the station of
 $x=3D$ in the wake of the cylinder. Figure 6 shows the comparison of mean streamwise velocity on the centreline in the wake of the cylinder with the LES result of Kravchenko & Moin (Reference Kravchenko and Moin2000) and hot-wire measurements of Ong & Wallace (Reference Ong and Wallace1996). Compared with the experimental result, the present DNS at
 $Ma=0.2$ has a similar valley in magnitude, but its location is slightly farther downstream, because the experiment suffered from some external disturbances that led to an earlier transition in the separated shear layers which in turn affected the size of the recirculation region, as mentioned in Kravchenko & Moin (Reference Kravchenko and Moin2000). After the valley at approximately
 $1.5D$ downstream of the cylinder, the present DNS shows a similar result as the LES, which agrees reasonably well with the experimental results. Figure 7 shows the pressure coefficient on the cylinder surface for
 $Ma=0.2$ in comparison with the LES and experimental results shown in Kravchenko & Moin (Reference Kravchenko and Moin2000). It is evident that the present DNS agrees well with the experimental result whereas the LES slightly underpredicts the pressure coefficient on the downstream cylinder surface. Figure 8 shows the normalized power spectral density (PSD) of the fluid density of the present higher Mach case at
 $x=2D$ on the cylinder wake centreline in comparison with the LES result of Mani (Reference Mani2009). The present DNS accurately predicts the frequencies of both the first and second peaks, and they occur at twice and four times the shedding frequency, respectively. The fundamental frequency occurs at twice the shedding frequency, because the probe is located on the wake centreline and therefore the dominant frequency is the frequency of drag which is twice the frequency of lift. Overall, the PSD of the present DNS and the LES agree reasonably well with each other at low frequencies up to eight times the shedding frequency, beyond which the PSD of the DNS has slightly higher values due to the fact that the DNS resolves finer scales and therefore captures more energy than the LES. Table 1 shows some of the flow parameters in comparison with previous experimental and LES studies. The drag coefficients and Strouhal numbers of the vortex shedding of the present two DNS cases match very well with previous experimental and LES results. It is also apparent that the drag coefficients of the higher-Mach DNS and LES cases are notably larger than those of the lower-Mach DNS/LES and incompressible experiments due to the compressibility effect. The base pressure coefficients of the present DNS cases are also close to those of the previous LES and experimental studies. Nevertheless, both present DNS cases predict a higher minimum averaged streamwise velocity in magnitude, again because the experiment suffers from some external disturbances that contribute to an earlier transition in the separating shear layers and the LES resolves less scales than DNS and thus captures less energy.
Statistics of the flow field at three stations in the wake of the cylinder. (a) Mean velocity in the streamwise direction, (b) mean velocity in the cross-flow direction, (c) variance of velocity in the streamwise direction, (d) variance of velocity in the cross-flow direction. Solid line, present DNS at  $Ma=0.2$; dash-dotted line, LES of Mani (Reference Mani2009);
 $\diamond$, hot-wire measurements of Ong & Wallace (Reference Ong and Wallace1996).

Streamwise velocity on the centreline in the wake of the cylinder. Solid line, present DNS at  $Ma=0.2$; dash-dotted line, LES of Kravchenko & Moin (Reference Kravchenko and Moin2000);
 $\diamond$, hot-wire measurements of Ong & Wallace (Reference Ong and Wallace1996).

Pressure coefficient on the cylinder surface. Solid line, present DNS at  $Ma=0.2$; dash-dotted line, LES of Kravchenko & Moin (Reference Kravchenko and Moin2000);
 $\diamond$, previous experimental result referenced in Kravchenko & Moin (Reference Kravchenko and Moin2000).

The PSD of density fluctuation normalized by the free stream flow density and the diameter of the cylinder at location  $x=2D$ on the wake centreline. Solid line, present DNS at
 $Ma=0.4$; line with circles, LES of Mani (Reference Mani2009) at
 $Ma=0.4$.

Comparison of flow statistics with existing references. The statistics from left to right are the drag coefficient, base pressure coefficient, Strouhal number of vortex shedding and minimum averaged streamwise velocity. The errors shown in the experimental and LES cases are based on a  $95\,\%$ confidence interval. Experiments are from different incompressible studies referenced in Mani (Reference Mani2009); the LESs are results of Mani (Reference Mani2009); the DNSs are present results. For all cases, the Reynolds numbers are
 $3900$ except that the Reynolds number of
 $-C_{pbase}$ from the experiments is
 $4020$.

4. Results and discussions
In this section, we first get some general insights about the cylinder near-field and far-field acoustics. Prior to applying the technique of Mancinelli et al. (Reference Mancinelli, Pagliaroli, Di Marco, Camussi and Castelain2017) to separate the cylinder near-field pressure fluctuations, we perform independence and convergence analyses of the wavelet decomposition procedure to demonstrate the reliability of such a wavelet-based technique on the separation between acoustic and hydrodynamic pressure fluctuations in the present study. The separation and quantification of the radiating acoustic pressure fluctuations and the non-radiating hydrodynamic counterparts on and around the cylinder are then presented, followed by an assessment of the radiating behaviour of the acoustic component and the decaying behaviour of the hydrodynamic component. Finally, the different strength of the near-field acoustic and hydrodynamic components along the angular direction inspires the use of pressure fluctuation time series at a near-field position in place of a far-field position to carry out the wavelet decomposition procedure.
4.1. The near-field and far-field pressure fluctuations
In order to better characterize the level of pressure fluctuations, the SPL is used as an indicator of the acoustic wave strength. One of the indicators is the sound pressure spectrum level (SPSL) which describes the strength of sound at different frequencies. This indicator is especially useful when the sound field is dominant at a certain frequency. According to Mancinelli et al. (Reference Mancinelli, Pagliaroli, Di Marco, Camussi and Castelain2017), the SPSL is defined as follows:
 \begin{equation} SPSL = 10 \log_{10} \left( \frac{\varPhi_{pp} {\rm \Delta} f_{ref}}{p^2_{ref}} \right), \end{equation}
where  $\varPhi _{pp}$ is the PSD of the dimensional pressure fluctuation. Here
 ${\rm \Delta} f_{ref} = 1$ Hz and
 $p_{ref}=2 \times 10^{-5}$ Pa are the reference frequency and the reference pressure, respectively. The standard atmospheric pressure is used to dimensionalize the dimensionless pressure obtained from DNS. Figure 9 shows the contours of the SPSL from the cylinder near field to the far field for both
 $Ma=0.2$ and
 $Ma=0.4$. Here, the SPSL is computed from the spanwise-averaged PSD of the pressure fluctuation. An interesting acoustical phenomenon is observed: the pressure fluctuation on the cylinder surface, especially around
 $90^{\circ }$, is of the highest level, which is known to be a sound source due to the separation point (Oguma et al. Reference Oguma, Yamagata and Fujisawa2013, Reference Oguma, Yamagata and Fujisawa2014). In a downstream slender region surrounding the oscillating near wake just behind the circular cylinder, the SPLs are found to be almost as high as those on the cylinder surface itself. In contrast to the pressure fluctuations generated on the cylinder surface, which radiate strongly to the far field, the pressure fluctuations in this oscillating near-wake region hardly radiate to the far field. Rather, they decay rapidly with the increase of distance in the crosswise direction from this near-wake region.
Contour of the SPSL in decibel at the vortex shedding frequency with a close-up around the cylinder. Here (a)  $Ma=0.2$ and (b)
 $Ma=0.4$. For the two contours, different colour scales are used.

Figure 10 shows the near-field directivity plots of root mean square pressure fluctuations in the cylinder midspan plane. On the cylinder surface, the pressure fluctuation levels are higher above the cylinder surface and lower on the upstream and downstream surfaces of the cylinder. However, along the circle centred at  $(0.338D, 180^{\circ })$ with a radius of
 $2.19D$, the contribution from the oscillating near wake just behind the cylinder is significant and thus makes the pressure fluctuation levels much higher in the region where
 $150^{\circ }< \theta < 180^{\circ }$. This again confirms the high-level pressure fluctuation in the oscillating near-wake just behind the circular cylinder. It is also worth noting that, at Mach numbers of
 $0.2$ and
 $0.4$, the normalized root mean square values of the wall pressure fluctuations increase from the front stagnation point to a position where a peak value is achieved, and then decay gradually on the leeward side of the cylinder. These peak values occur around the flow separation point (Xia et al. Reference Xia, Xiao, Shi and Chen2016). As the Mach number exceeds a subcritical Mach number, the root mean square wall pressure fluctuation exhibits different behaviours. Xia et al. (Reference Xia, Xiao, Shi and Chen2016) observed that the root mean square wall pressure fluctuation remains nearly zero before an intensive rise occurs around the flow separation point, and then decreases quickly to a nearly constant value on the downstream side of the cylinder. Such a subcritical Mach number is between
 $0.7$ and
 $0.75$ for
 $Re = 4 \times 10^4$, and 0.65–0.7 for
 $Re \ge 5 \times 10^5$ (Xia et al. Reference Xia, Xiao, Shi and Chen2016).
Near-field directivity plot of the normalized root mean square pressure fluctuation  $p'_{rms}/\rho _{\infty }c_{\infty }^2$ in the cylinder midspan plane. Dotted line, along cylinder surface for
 $Ma=0.2$; dash-dotted line, along cylinder surface for
 $Ma=0.4$; solid line, along a circle centred at
 $(0.338D, 180^{\circ })$ with a radius of
 $2.19D$ for
 $Ma=0.2$; dashed line, along a circle centred at
 $(0.338D, 180^{\circ })$ with a radius of
 $2.19D$ for
 $Ma=0.4$.

In the present study, the Reynolds numbers are relatively low. As the Reynolds number increases, the fundamental frequency, the peak SPL of the aeolian tone and the cylinder wall pressure fluctuation vary. In the moderate-to-high Reynolds number range, the flow over a circular cylinder can be categorized into three main regimes according to the location of transition where the shear/boundary layer changes from laminar to turbulent: the subcritical ( $350\text {--}400 \leq Re \leq 10^5\text {--}2 \times 10^5$); supercritical (
 $5 \times 10^5\text {--}10^6 \leq Re \leq 3.4 \times 10^6\text {--}6 \times 10^6$); and postcritical regimes (
 $Re \ge 3.4 \times 10^6\text {--}6 \times 10^6$) (Zdravkovich Reference Zdravkovich1997). In the subcritical regime, the fundamental frequency slightly decreases with increasing Reynolds numbers (
 $St = 0.215$ for
 $Re \approx 7000$ and
 $St = 0.19$ for
 $Re \approx 75\,000$) (Hutcheson & Brooks Reference Hutcheson and Brooks2012). The fundamental frequency remains around
 $St=0.2$ in the subcritical regime, increases to a maximum of approximately
 $0.45$ in the supercritical regime, and then returns back to
 $0.2$ in the postcritical regime (Fujita Reference Fujita2010). In terms of the peak SPL, there is a sharp decrease from the subcritical to the supercritical regime, and a sharp increase with the Reynolds number in the postcritical regime (Fujita Reference Fujita2010). The level of the surface pressure fluctuation remains high in the subcritical regime, drops sharply from the subcritical to the supercritical regime, and then increases from the supercritical to the postcritical regime (Fujita Reference Fujita2010).
4.2. The independence and convergence analyses of wavelet decomposition of the near-field pressure fluctuations
Far-field pressure fluctuations at different polar angles ranging from  $50^{\circ }$ to
 $130^{\circ }$ along the outer half-circle (see figure 2) are selected to compute the cross-correlation coefficient peak between the near-field separated acoustic (or hydrodynamic) component at
 $(2.50D, 160^{\circ })$ and the far-field pressure fluctuation. Figures 11(a) and 11(c) show the variation of the peak of the cross-correlation coefficient between either the near-field separated acoustic or hydrodynamic component and the far-field pressure fluctuation at
 $(23.06D, 50^{\circ })$ for
 $Ma=0.2$ or
 $(27.17D, 100^{\circ })$ for
 $Ma=0.4$. It is observed that the cross-correlation coefficient peak between the acoustic and the far-field pressure fluctuation is always much larger than that between the hydrodynamic and the far-field pressure fluctuation, due to the fact that the acoustic pressure fluctuation radiates to the far field and thus correlates well with the far-field sound, whereas the hydrodynamic pressure fluctuation does not radiate to the far field. Starting from the initial threshold
 $T_0$, as the threshold decreases by
 $1\,\%$ after each iteration, the acoustic cross-correlation coefficient peak increases gradually until it reaches the maximum value after which it decreases. Theoretically speaking, when the cross-correlation coefficient peak between the near-field acoustic component and the far-field pressure fluctuation reaches the maximum value, the cross-correlation coefficient peak between the near-field hydrodynamic component and the far-field pressure fluctuation should reach the minimum value simultaneously due to the extraction of the most correlated (acoustic) component from the original near-field pressure fluctuation signal. In practice, as long as the cross-correlation coefficient peak between the near-field hydrodynamic component and the far-field pressure fluctuation remains at a very low level at the maximum value of the cross-correlation coefficient peak between the near-field acoustic component and the far-field pressure fluctuation, the acoustic and hydrodynamic components are successfully separated. Figures 11(b) and 11(d) show the variation of the peak of cross-correlation coefficient between the near-field separated acoustic component and the far-field pressure fluctuation at different polar angles ranging from
 $50^{\circ }$ to
 $130^{\circ }$. It is observed that the trend of cross-correlation coefficient peak goes consistently at different polar angles, and the maximum value of cross-correlation coefficient peak is reached around the 92nd (
 $Ma=0.2$) or 90th (
 $Ma=0.4$) iteration at which the thresholds are selected for the wavelet separation procedure. Thus, it is apparent that such a wavelet decomposition procedure does not depend on the selection of the position of the far-field pressure fluctuation. Although it does not affect the selection of the threshold value for decomposition, it is recommended to use the far-field position that produces the highest correlation level. For example, at
 $Ma=0.4$, the correlation level at
 $80^{\circ }$,
 $90^{\circ }$ and
 $100^{\circ }$ is slightly higher than the those at other polar angles with the one at
 $100^{\circ }$ being highest, and therefore the far-field position at
 $100^{\circ }$ for
 $Ma=0.4$ (or
 $50^{\circ }$ for
 $Ma=0.2$) is selected for the wavelet decomposition in this paper.
Cross-correlation coefficient peak between the near-field separated acoustic (or hydrodynamic) component at  $(2.50D, 160^{\circ })$ and the far-field pressure fluctuation at different polar angles. (a) Acoustic and hydrodynamic cross-correlation coefficient peak with the far-field pressure fluctuation selected at a polar angle of
 $50^{\circ }$ for
 $Ma=0.2$. Here
 $\circ$, acoustic component;
 $\vartriangle$, hydrodynamic component. (b) Acoustic cross-correlation coefficient peak with the far-field pressure fluctuation selected at different polar angles for
 $Ma=0.2$. Here
 $\diamond \ \theta =130^{\circ }$;
 $\cdot \ \theta =120^{\circ }$;
 $\times \ \theta =110^{\circ }$;
 $\circ \ \theta =100^{\circ }$;
 $\triangledown \ \theta =90^{\circ }$;
 $\square \ \theta =80^{\circ }$;
 $+\ \theta =70^{\circ }$;
 $\vartriangle \ \theta =60^{\circ }$;
 $\ast \ \theta =50^{\circ }$. (c) The same as panel (a) but at a polar angle of
 $100^{\circ }$ for
 $Ma=0.4$. (d) The same as panel (b) but for
 $Ma=0.4$. The iteration at which the threshold is selected for the wavelet separation procedure is highlighted with a vertical dashed line.

Figure 12 shows the PSD of the near-field pressure fluctuation at  $(2.05D, 70^{\circ })$ and
 $(2.50D, 160^{\circ })$ as well as its separated acoustic and hydrodynamic components for sampling time series over 100 and 160 shedding cycles, respectively. Hereinafter, the pressure fluctuations used for computing PSDs are dimensionless pressure fluctuations
 $(p'/\rho _{\infty }c_{\infty }^2)$. As can be seen, the PSD curves of the near-field pressure fluctuation and its acoustic and hydrodynamic components of time series over 100 shedding cycles are in good agreement with those of time series over 160 shedding cycles, except that the curves oscillate differently at lower frequencies. This is because the PSD curves are sparse at lower frequencies, and the different length of the sampling time series results in a different frequency increment which further leads to different central frequencies of the 1/6 octave bands when the bin averaging is applied over 1/6 octave to smooth the spectra. Overall, the sampling data is statistically convergent for the wavelet decomposition of the near-field pressure fluctuation.
The PSD of the near-field pressure fluctuation and its separated acoustic and hydrodynamic components for sampling time series of 100 and 160 shedding cycles, respectively, for  $Ma=0.4$ at two different positions: position A
 $(2.05D, 70^{\circ })$ and B
 $(2.50D, 160^{\circ })$. (a) Near-field pressure fluctuation at position A, (b) near-field pressure fluctuation at position B, (c) acoustic pressure fluctuation at position A, (d) acoustic pressure fluctuation at position B, (e) hydrodynamic pressure fluctuation at position A, (f) hydrodynamic pressure fluctuation at position B. Dashed lines, 160 shedding cycles; dotted lines, 100 shedding cycle. The spectra are bin-averaged over 1/6 octave. A Hann window is applied to avoid spectral leakage.

The p.d.f. of the near-field pressure fluctuation and its separated acoustic and hydrodynamic components are shown in figure 13. On the one hand, it is observed that the normalized acoustic pressure fluctuation has more concentrated distribution around  $-1.4$ and
 $1.0$ which correspond to two peaks in the p.d.f. These peaks in the p.d.f. are related to the dominant tone at the vortex shedding frequency. The stronger the tone is, the farther from the origin these peaks will be. It should be noted that the p.d.f. of acoustic pressure fluctuations in cylinder flows does not obey a Gaussian distribution as that in subsonic jet flows of Mancinelli et al. (Reference Mancinelli, Pagliaroli, Di Marco, Camussi and Castelain2017), because the dominant sound field is dipole rather than quadrupole. Such a kind of dipole sound is produced by the alternate positive and negative pressure pulses generated on both sides of the cylinder surface (Inoue & Hatakeyama Reference Inoue and Hatakeyama2002). Therefore, two corresponding dominant peaks, one negative and the other positive, are observed in the p.d.f. of acoustic pressure fluctuations. On the other hand, the normalized hydrodynamic pressure fluctuation is most concentrated around
 $0.1$ (slightly biased from the origin point) which corresponds to a peak in the p.d.f. of the hydrodynamic pressure fluctuation. Such a peak of the hydrodynamic component at (near) zero demonstrates the intermittent nature of hydrodynamic pressure fluctuations. This is because the largest possibility at (near) zero means the hydrodynamic pressure fluctuation does not occur at most of the time steps. Furthermore, the skewness and kurtosis are computed to study the shape of the distributions. The skewness of hydrodynamic pressure fluctuations sampled over 100 and 160 shedding cycles are
 $-3.94$ and
 $-3.75$, respectively, suggesting that the distribution of hydrodynamic pressure fluctuations is highly skewed and has a much flatter tail on the left-hand side. The kurtosis of the hydrodynamic pressure fluctuations sampled over 100 and 160 shedding cycles are
 $27.58$ and
 $25.20$, respectively. This means that the distributions of the hydrodynamic pressure fluctuation have heavier tails than a normal distribution, demonstrating that the hydrodynamic pressure fluctuation exhibits an intermittent nature and is characterized by intermittent high-energy events. Overall, it is apparent that the results of time series over 100 shedding cycles are similar to those over 160 shedding cycles with only minor differences at the peaks of the acoustic and hydrodynamic components, demonstrating that the length of the sampling time series is sufficiently long and the statistical convergence is satisfied. Hereinafter, unless otherwise stated, the time series over 160 shedding cycles are used for the case of
 $Ma=0.4$.
The p.d.f. of the near-field pressure fluctuation at  $(2.50D, 160^{\circ })$ and its separated acoustic and hydrodynamic components for sampling time series over 100 and 160 shedding cycles, respectively, at
 $Ma=0.4$. Red lines, 160 shedding cycles; blue lines, 100 shedding cycles. Solid lines, near-field pressure fluctuation; dash-dotted lines, acoustic pressure fluctuation; dashed lines, hydrodynamic pressure fluctuation.

The independence analysis demonstrates that the wavelet decomposition procedure does not depend on the selection of pressure fluctuation at a far-field position and the convergence analysis shows that the time series of pressure fluctuation sampled in this study are long enough to achieve statistical convergence, which further confirms the feasibility of applying such a wavelet decomposition technique to separate the cylinder near-field pressure fluctuations and to study the characteristics of the separated acoustic and hydrodynamic pressure fluctuations.
4.3. Characteristics of the near-field acoustic and hydrodynamic pressure fluctuations
The instantaneous pressure fluctuation time series in the midspan cylinder near field are used for the decomposition. Figure 14 shows the contours of the acoustic and hydrodynamic cross-correlation coefficient peak for  $Ma=0.2$ and
 $Ma=0.4$. Overall, the level of the acoustic cross-correlation coefficient peak is significantly higher than that of the hydrodynamic cross-correlation coefficient peak, which is quite reasonable since the acoustic pressure fluctuation propagates to the far field yet the hydrodynamic pressure fluctuation does not. Except in the cylinder upstream and downstream regions close to the cylinder centreline, the acoustic cross-correlation level is very high in most parts of the cylinder near field, especially in the region directly above the cylinder upper surface, suggesting that the pressure fluctuations on the cylinder upper surface propagate most strongly to the far field. This is consistent with the viewpoint of Inoue & Hatakeyama (Reference Inoue and Hatakeyama2002) that acoustic pressure waves are produced by the alternative pressure pulses generated on both sides of the cylinder surface. The hydrodynamic cross-correlation level is very low in most regions of the cylinder near field, except that an unexpected high cross-correlation level (still much lower than the acoustic cross-correlation level) is observed especially for the higher-Mach case. As we will see below, this is mainly because the hydrodynamic pressure fluctuations in those regions with unexpected relatively high cross-correlation levels are hundreds or thousands of times smaller than the acoustic pressure fluctuations in magnitude. As a result, separation of pressure fluctuations with high accuracy in such an extreme situation requires high resolution in finding the optimal threshold value. Starting from the initial threshold, the decrement of the threshold lacks resolution for such an extreme situation although the resolution is sufficient for the separation of pressure fluctuations in the oscillating near wake just behind the cylinder where the disparity between
 $p_A$ and
 $p_H$ is not so large, as suggested by the reasonably successful decomposition results below. Such an issue is more obvious for the higher-Mach case due to a lack of resolution, which is also observed in jet flows (Kerhervé et al. Reference Kerhervé, Guitton, Jordan, Delville, Fortuné, Gervais and Tinney2008; Mancinelli et al. Reference Mancinelli, Pagliaroli, Di Marco, Camussi and Castelain2017).
Contours of the cross-correlation coefficient peak between the near-field separated acoustic (or hydrodynamic) component and the near-field pressure fluctuation for  $Ma=0.2$ and
 $Ma=0.4$. (a) Hydrodynamic cross-correlation coefficient peak,
 $Ma=0.2$, (b) acoustic cross-correlation coefficient peak,
 $Ma=0.2$, (c) hydrodynamic cross-correlation coefficient peak,
 $Ma=0.4$, (d) acoustic cross-correlation coefficient peak,
 $Ma=0.4$.

Figure 15 shows the PSD of the near-field pressure fluctuation and its separated acoustic and hydrodynamic components for  $Ma=0.2$ and
 $Ma=0.4$ at
 $(1.96D, 50^{\circ })$ and
 $(2.50D, 160^{\circ })$. At the cylinder near-field upstream position
 $(1.96D, 50^{\circ })$, the hydrodynamic pressure fluctuations are nearly negligible compared with the acoustic pressure fluctuations for both cases. At the position in the oscillating near-wake region just behind the cylinder
 $(2.50D, 160^{\circ })$, the hydrodynamic pressure fluctuation dominates over the acoustic pressure fluctuation at most frequencies except at the vortex shedding frequency where the PSD of the hydrodynamic and acoustic components show comparable strength, with the hydrodynamic pressure fluctuation being slightly stronger for
 $Ma=0.2$. At higher frequencies, the PSD of the hydrodynamic component is several times larger than that of the acoustic component. Therefore, in the oscillating near-wake region just behind the cylinder, the pressure fluctuation mainly consists of hydrodynamic pressure fluctuation or pseudo-sound that does not radiate to the far field. This is the reason why the high-level pressure fluctuation in the oscillating near-wake region does not propagate to the far field as strongly as that generated on the cylinder upper surface, as shown in figure 9. Besides, it is also interesting to note that although hydrodynamic pressure fluctuation dominates in the oscillating near wake just behind the cylinder, the portion of acoustic pressure fluctuation for
 $Ma=0.4$ is higher than that for
 $Ma=0.2$, which confirms the role of compressibility in sound generation and propagation.
The PSD of the near-field pressure fluctuation and its separated acoustic and hydrodynamic components for  $Ma=0.2$ and
 $Ma=0.4$ at two different positions. (a) For
 $Ma=0.2$ at
 $(1.96D, 50^{\circ })$, (b) for
 $Ma=0.2$ at
 $(2.50D, 160^{\circ })$, (c) for
 $Ma=0.4$ at
 $(1.96D, 50^{\circ })$, (d) for
 $Ma=0.4$ at
 $(2.50D, 160^{\circ })$. Dashed line: near-field pressure fluctuation, dotted lines: acoustic component, solid line: hydrodynamic component. The spectra are bin-averaged over 1/6 octave. A Hann window is applied to avoid spectral leakage.

Figure 16 shows a comparison of the p.d.f. of the near-field pressure fluctuation and its separated acoustic and hydrodynamic components at  $(2.50D, 160^{\circ })$ between
 $Ma=0.2$ and
 $Ma=0.4$. It is observed that the lower-Mach case has higher acoustic peaks than the higher-Mach case while the situation is inverse for the hydrodynamic peak. The kurtosis of hydrodynamic pressure fluctuations is
 $40.04$ and
 $27.58$ for
 $Ma=0.2$ and
 $Ma=0.4$, respectively, suggesting that the distribution of the hydrodynamic pressure fluctuation at
 $Ma=0.2$ has a heavier tail while that of
 $Ma=0.4$ has a flatter tail, as also shown in figure 16. Due to the intermittent nature of the hydrodynamic pressure fluctuation, for the case of
 $Ma=0.4$ in comparison with
 $Ma=0.2$, a higher hydrodynamic peak located at (near) zero means less occurrence of hydrodynamic pressure fluctuations while flatter distribution of hydrodynamic p.d.f. away from the peak suggests weaker strength of the hydrodynamic pressure fluctuation. This can explain why the portion of hydrodynamic pressure fluctuation for
 $Ma=0.4$ is less than that for
 $Ma=0.2$ although in both cases the hydrodynamic components are dominant, as shown in figure 15. In addition, the acoustic peak on the negative side is somewhat translated to the left for
 $Ma=0.4$ compared with
 $Ma=0.2$. That is, the negative acoustic pressure fluctuation is mostly concentrated at
 $-1.4\langle p'^2\rangle ^{1/2}$ for
 $Ma=0.4$ but
 $-1.2\langle p'^2\rangle ^{1/2}$ for
 $Ma=0.2$. This is because the PSD magnitude of acoustic pressure fluctuation is higher for
 $Ma=0.4$ than
 $Ma=0.2$.
The p.d.f. of the near-field pressure fluctuation at  $(2.50D, 160^{\circ })$ and its separated acoustic and hydrodynamic components for sampling time series over 100 shedding cycles for both
 $Ma=0.2$ and
 $Ma=0.4$. Red lines,
 $Ma=0.2$; blue lines,
 $Ma=0.4$. Solid lines, near-field pressure fluctuation; dash-dotted lines, acoustic pressure fluctuation; dashed lines, hydrodynamic pressure fluctuation.

Figure 17 shows the changes of PSD of the near-field pressure fluctuation and its separated acoustic and hydrodynamic components for  $Ma=0.4$ at four near-field positions at different polar angles ranging from
 $10^{\circ }$ to
 $150^{\circ }$. The hydrodynamic pressure fluctuations are always negligibly small components in the cylinder upstream region (
 $10^{\circ }$ and
 $70^{\circ }$). In the downstream at
 $110^{\circ }$, the acoustic pressure fluctuation still dominates but the hydrodynamic pressure fluctuation begins to play a role in the original near-field pressure fluctuation. At
 $150^{\circ }$, the hydrodynamic pressure fluctuation has a similar magnitude as the acoustic pressure fluctuation at low frequencies up to the vortex shedding frequency beyond which the hydrodynamic component exceeds the acoustic component. Such evolution of acoustic and hydrodynamic pressure fluctuations thus inspires the use of a near-field position that has negligible hydrodynamic pressure fluctuations in place of a far-field position for the decomposition procedure, which will be presented in § 4.5.
The PSD of the near-field pressure fluctuation and its separated acoustic and hydrodynamic components for  $Ma=0.4$ at four near-field positions of different polar angles: (a)
 $(1.86D, 10^{\circ })$; (b)
 $(2.05D, 70^{\circ })$; (c)
 $(2.28D, 110^{\circ })$; (d)
 $(2.48D, 150^{\circ })$. Dashed line, near-field pressure fluctuation; dotted lines, acoustic component; solid line, hydrodynamic component. The spectra are bin-averaged over 1/6 octave. A Hann window is applied to avoid spectral leakage.

Figure 18 shows a contour of the SPSL of the separated acoustic and hydrodynamic components at the vortex shedding frequency in the midspan cylinder near field for  $Ma=0.4$. It is apparent that the hydrodynamic pressure fluctuation in the upstream near field is negligibly weak when compared with the acoustic pressure fluctuation. In the contour of the hydrodynamic SPSL, it is observed that there is a low-level SPSL region which is farther away from
 $y=4D$ directly above the cylinder. Again, this is because in such a region far away from the cylinder surface and away from the downstream turbulent region, the hydrodynamic pressure fluctuation is significantly smaller than the acoustic pressure fluctuation in magnitude, separation of pressure fluctuations with high accuracy in such extreme situation can easily suffer from lack of resolution when finding the optimal threshold value, which is the limitation of the present thresholding procedure. Future improvement of such thresholding and decomposition techniques in distinguishing extreme components is promising.
Contour of the SPSL of the separated hydrodynamic and acoustic components at the vortex shedding frequency in the midspan cylinder near field for  $Ma=0.4$: (a) hydrodynamic component; (b) acoustic component. The solid lines separate the cylinder near field into three sectorial zones. The vertical dashed lines show the locations where the acoustic and hydrodynamic SPSLs are extracted to study how they decay, they are along
 $x=0$ and
 $x=2.48D$, respectively. For the two contours, different colour scales are used.

According to the contour of the acoustic pressure fluctuation in figure 18(b), the cylinder near field can be reasonably divided into three sectorial zones based on the evolution of the acoustic and hydrodynamic pressure fluctuations in the angular direction, as separated by the solid lines in the contour. In the zone less than approximately  $25^{\circ }$ from the upstream centreline (zone I), the acoustic pressure fluctuation dominates over the hydrodynamic pressure fluctuation but they are both very weak. Therefore, it is a zone of ‘silence’ at the vortex shedding frequency, as also suggested by the low PSD in figure 17(a). In the zone from
 $25^{\circ }$ to
 $155^{\circ }$ approximately (zone II), the acoustic pressure fluctuation strongly dominates yet the hydrodynamic pressure fluctuation is still negligibly weak. This is a strongly radiating zone and the pressure fluctuation generated on the cylinder surface in this zone is an important sound source. Nevertheless, it should be noted that, as pointed out by Goldstein (Reference Goldstein1976), solid boundaries affect the sound field in two ways. First, the sound produced by the volume distribution of quadrupoles in Lighthill's theory can be diffracted by solid boundaries. Second, there may be a distribution of dipole sound sources which correspond to externally applied forces. This is especially true when considering the pressure fluctuation generated on a circular cylinder. On the one hand, the pressure fluctuation on the cylinder surface is caused by the diffraction of quadrupole noise sources in the oscillating near wake (Gloerfelt et al. Reference Gloerfelt, Pérot, Bailly and Juvé2005), which causes an equivalent sound source. On the other hand, the pressure fluctuation generated around the flow separation point on the cylinder surface is an important sound source in the cylinder near field, which has been previously identified by Oguma et al. (Reference Oguma, Yamagata and Fujisawa2013, Reference Oguma, Yamagata and Fujisawa2014) and is also observed from the time-dependent variation of dilatation around the flow separation point in figure 4. In the zone from
 $155^{\circ }$ to the downstream centreline (zone III), the level of pressure fluctuation is almost as high as that on the cylinder surface in zone II. The pressure fluctuation in this zone consists of both acoustic and hydrodynamic components, yet the non-radiating hydrodynamic pressure fluctuation plays a more important role. Therefore, this zone consists more of non-radiating pseudo-sound and less of radiating acoustic pressure fluctuation and thus is not the most important zone for sound emission. Such sectorial division of the cylinder near field can also be reasonably made according to the contours of the cross-correlation coefficient peak.
To further confirm that zone II and zone III are approximately separated by the  $155^{\circ }$ radial line, we show the overall sound pressure level (OASPL) of acoustic and hydrodynamic pressure fluctuations on both sides of the
 $155^{\circ }$ radial line. The OASPL is defined as
 \begin{equation} OASPL = 20 \log_{10} \left( \frac{p'_{rms}}{p_{ref}} \right), \end{equation}
where  $p'_{rms}$ is the root mean square of a pressure fluctuation and
 $p_{ref}$ is the reference pressure. Figure 19 shows the difference between the acoustic OASPL (
 $OASPL_A$) and hydrodynamic OASPL (
 $OASPL_H$) at sampling positions on the
 $150^{\circ }$ and
 $160^{\circ }$ radial lines in the cylinder near field. It is clear that the acoustic pressure fluctuations are stronger than the hydrodynamic pressure fluctuations at all three sampling positions on the
 $150^{\circ }$ radial line while the hydrodynamic pressure fluctuations are stronger than the acoustic pressure fluctuations at sampling positions on the
 $160^{\circ }$ radial line, suggesting that zone II and zone III are separated around
 $155^{\circ }$, approximately.
The difference between the acoustic and hydrodynamic OASPLs at sampling probes on two radial lines. Here  $\circ$,
 $150^{\circ }$;
 $\vartriangle$,
 $160^{\circ }$.

4.4. Radiation of acoustic pressure fluctuations and decay of hydrodynamic pressure fluctuations in the cylinder near field
In order to study how the acoustic and hydrodynamic pressure fluctuation generated in the oscillating near-wake region decays, figure 20 shows the SPSL of acoustic pressure fluctuation along  $x=0$ and
 $x=2.48D$ and that of hydrodynamic pressure fluctuation along
 $x=2.48D$, with the original pressure fluctuations. The decay of the negligibly small hydrodynamic pressure fluctuation along
 $x=0$ is not of interest and therefore is not shown here. In the region surrounding the oscillating near wake just behind the cylinder
 $(y/D<1)$, the acoustic and hydrodynamic pressure fluctuations have similar SPSLs, with the acoustic pressure fluctuations being slightly stronger, at the vortex shedding frequency. Beyond this region
 $(y/D>1)$, the acoustic pressure fluctuation decays much more slowly than the hydrodynamic pressure fluctuation which decays dramatically to a low level. This supports the point of view that the hydrodynamic fluctuations decay rapidly with the increase in radial distance from the near field (Suzuki & Colonius Reference Suzuki and Colonius2006). Within
 $y/D<3$, the decay of the acoustic SPSL along
 $x=2.48D$ is almost parallel to the decay of the acoustic SPSL along
 $x=0$. Beyond
 $y/D=3$, the acoustic SPSL along
 $x=2.48D$ decays more slowly than the acoustic SPSL along
 $x=0$, because the propagating acoustic wave from the oscillating near wake just behind the cylinder is influenced and strengthened by the propagating acoustic wave coming from the cylinder surface in zone II.
The SPSL decay of the acoustic and hydrodynamic pressure fluctuations for  $Ma=0.4$ in the cylinder midspan plane. Red dashed line, original pressure fluctuation along
 $x=0$; black solid line, acoustic pressure fluctuation along
 $x=0$; black dotted line, original pressure fluctuation along
 $x=2.48D$; black dashed line, acoustic pressure fluctuation along
 $x=2.48D$; black dash-dotted line, hydrodynamic pressure fluctuation along
 $x=2.48D$.

The decaying behaviour described above is also confirmed by the decay of the OASPL of the acoustic and hydrodynamic pressure fluctuations, as shown in figure 21. The hydrodynamic OASPL clearly dominates over the acoustic OASPL in the region surrounding the oscillating near wake just behind the cylinder, although the acoustic SPSL is slightly higher than the hydrodynamic SPSL at the vortex shedding frequency  $f_{shedding}$, as has been seen in figure 20. This is because, in contrast to the SPSL showing the information of the signal at a specific frequency
 $f_{shedding}$, the OASPL is computed from the root mean square pressure fluctuation and is not limited at
 $f_{shedding}$, thus it contains all the information of the pressure fluctuation signal, not just the information at a specific frequency. Similar to the SPSL decay in figure 20, the hydrodynamic OASPL along
 $x=2.48D$ decays dramatically with the distance from the oscillating near-wake region, due to the non-radiating nature of the hydrodynamic pressure fluctuation. The decay of acoustic OASPL along
 $x=2.48D$ is also parallel to the decay of the acoustic SPSL along
 $x=0$ within
 $y/D<3$. Similarly, in the range
 $y/D>3$, the acoustic OASPL along
 $x=2.48D$ decays more slowly than the acoustic OASPL along
 $x=0$, because the propagating acoustic wave from the oscillating near wake just behind the cylinder is influenced and strengthened by the propagating acoustic wave coming from the cylinder surface in zone II. This is exactly the same situation as the SPSL. Again, from figure 21, we see the radiating nature of the acoustic pressure fluctuation and the non-radiating nature of the hydrodynamic pressure fluctuations, and that the hydrodynamic pressure fluctuation is dominant over the acoustic pressure fluctuation in the region surrounding the oscillating near wake just behind the circular cylinder. This again explains why very high-level pressure fluctuations are observed in this region but does not radiate to the far field as strongly as the high-level pressure fluctuations generated on the cylinder surface.
The OASPL decay of the acoustic and hydrodynamic pressure fluctuations for  $Ma=0.4$ in the cylinder midspan plane. Same line styles as figure 20.

4.5. Wavelet decomposition using a near-field position in place of the far-field position
Using the first of the three wavelet decomposition techniques proposed by Mancinelli et al. (Reference Mancinelli, Pagliaroli, Di Marco, Camussi and Castelain2017), it is necessary to use pressure fluctuation at a far-field position where no hydrodynamic pressure fluctuation exists. Interestingly, it has been observed in figure 17 that the hydrodynamic pressure fluctuations are negligibly small compared with the acoustic pressure fluctuations in zones I and II. However, the level of acoustic pressure fluctuations in zone I is also very low. Therefore, it is natural to suggest using pressure fluctuation at a near-field position in zone II where the acoustic pressure fluctuations have strongest radiation, while at the same time the level of hydrodynamic pressure fluctuations remains very low, to take the place of the far-field position for the wavelet decomposition. Compared with Grizzi & Camussi (Reference Grizzi and Camussi2012) in which two near-field positions were also used, simultaneous acquisition of pressure fluctuation time series from two positions located sufficiently close to each other is not required in the present proposition. The advantage of using a near-field position in place of a far-field position is that the pressure fluctuation signal in the cylinder far field is not necessary and thus the computational domain size can be greatly reduced for future studies on cylinder near-field sound sources.
Figure 22 shows the acoustic and hydrodynamic cross-correlation coefficient peak for both  $Ma=0.2$ and
 $Ma=0.4$ in a comparison between using a near-field position in zone II and using a far-field position for the decomposition procedure. The near-field position at
 $(2.16D, 90^{\circ })$ produces consistent acoustic and hydrodynamic cross-correlation with the previous selected far-field positions for both
 $Ma=0.2$ and
 $Ma=0.4$. All the three selected near-field positions produce very close thresholds for the wavelet decomposition, although the cross-correlation level at
 $(2.28D,110^{\circ })$ is lower than those at
 $(2.05D, 70^{\circ })$ and
 $(2.16D, 90^{\circ })$.
Cross-correlation coefficient peak between the near-field separated acoustic (or hydrodynamic) component at  $(2.50D, 160^{\circ })$ and the selected near-field pressure fluctuation at different polar angles or the selected far-field pressure fluctuation at
 $(23.06D, 50^{\circ })$ for
 $Ma=0.2$ and
 $(27.17D,100^{\circ })$ for
 $Ma=0.4$. Here (a)
 $Ma=0.2$:
 $\circ$, acoustic component when far-field position is selected;
 $\vartriangle$, hydrodynamic component when far-field position is selected;
 $+$, acoustic component when near-field position at
 $(2.16D, 90^{\circ })$ is selected;
 $\ast$, hydrodynamic component when near-field position at
 $(2.16D, 90^{\circ })$ is selected. Here (b)
 $Ma=0.2$:
 $\circ$, acoustic component when far-field position is selected;
 $\cdot$, acoustic component when near-field position at
 $(2.05D, 70^{\circ })$ is selected;
 $\triangledown$, acoustic component when near-field position at
 $(2.16D, 90^{\circ })$ is selected;
 $\times$, acoustic component when near-field position at
 $(2.28D,110^{\circ })$ is selected. Here (c)
 $Ma=0.4$, with same symbol styles as panel (a). Here (d)
 $Ma=0.4$, with same symbol styles as panel (b). The iteration at which the threshold is selected for the wavelet separation procedure is highlighted with a vertical dashed line.

Figure 23 shows the contours of the acoustic and hydrodynamic cross-correlation coefficient peak for  $Ma=0.4$ for a comparison between using a near-field position at
 $(2.16D, 90^{\circ })$ and using a far-field position at
 $(27.17D,100^{\circ })$ for the decomposition. It is observed that, although the acoustic cross-correlation level is slightly lower in zone II as a result of using a near-field position for the decomposition, the two contours of the acoustic cross-correlation coefficient peak look reasonably alike and have higher cross-correlation levels than those of the hydrodynamic cross-correlation coefficient peak. The contours of the hydrodynamic cross-correlation coefficient peak are somewhat different in zone II, again due to the extreme disparity between the acoustic and hydrodynamic components and the lack of resolution which has been discussed previously. It has to be pointed out that, at approximately
 $y/D=2$ directly above the cylinder, the acoustic cross-correlation level is highest, while inversely the hydrodynamic cross-correlation level is lowest. This is because the pressure fluctuation at that position was used in place of the far-field position for the wavelet decomposition. As a result, the separated acoustic component is the original pressure fluctuation itself and the hydrodynamic component is zero. Thus the decomposition at this position is meaningless.
Contour of the cross-correlation coefficient peak between the near-field separated acoustic (or hydrodynamic) component and the pressure fluctuation at a far-field position  $(27.17D,100^{\circ })$ or near-field position
 $(2.16D, 90^{\circ })$ for
 $Ma=0.4$. (a) Hydrodynamic cross-correlation coefficient peak, using the far-field position, (b) acoustic cross-correlation coefficient peak, using the far-field position, (c) hydrodynamic cross-correlation coefficient peak, using the near-field position, (d) acoustic cross-correlation coefficient peak, using the near-field position.

Figure 24 shows the PSD of the separated acoustic and hydrodynamic pressure fluctuations at  $(2.50D,160^{\circ })$ in the oscillating near-wake region just behind the cylinder using near-field positions at different polar angles for
 $Ma=0.4$. Only minor differences in both acoustic and hydrodynamic components are observed, suggesting that using a near-field position in zone II with a very low-level hydrodynamic pressure fluctuation to take the place of a far-field position is a feasible approach for the wavelet decomposition procedure. By using a near-field position instead of a far-field position, a reduction of
 $34\,\%$ can be achieved in the present computational domain for future studies of near-field cylinder sound sources. The comparable results obtained by using the near-field positions in zone II for the decomposition procedure in return provide further proof to support the discovery in § 4.3 that the hydrodynamic pressure fluctuation in zone II is negligible.
The PSD of the separated acoustic and hydrodynamic pressure fluctuation at  $(2.50D, 160^{\circ })$ for
 $Ma=0.4$ using a far-field position and three near-field positions at different polar angles. Here
 $\vartriangle$, acoustic pressure fluctuation using a far-field position at
 $(27.17D,100^{\circ })$;
 $\circ$, hydrodynamic pressure fluctuation using a far-field position at
 $(27.17D,100^{\circ })$. Black solid line, acoustic pressure fluctuation using a near-field position at
 $(2.05D, 70^{\circ })$; black dashed line, hydrodynamic pressure fluctuation using a near-field position at
 $(2.05D, 70^{\circ })$; red solid line, acoustic pressure fluctuation using a near-field position at
 $(2.16D, 90^{\circ })$; red dashed line, hydrodynamic pressure fluctuation using a near-field position at
 $(2.16D, 90^{\circ })$; blue solid line, acoustic pressure fluctuation using a near-field position at
 $(2.28D,110^{\circ })$; blue dashed line, hydrodynamic pressure fluctuation using a near-field position at
 $(2.28D,110^{\circ })$. The spectra are bin-averaged over 1/6 octave. A Hann window is applied to avoid spectral leakage.

5. Concluding remarks
It has been established that the pressure fluctuations generated on both sides of a circular cylinder and those generated in the near wake just behind a cylinder are both sound sources (Inoue & Hatakeyama Reference Inoue and Hatakeyama2002; Tamura & Tsutahara Reference Tamura and Tsutahara2010; Oguma et al. Reference Oguma, Yamagata and Fujisawa2013; Zhang et al. Reference Zhang, Moreau and Sanjosé2019a,Reference Zhang, Sanjose and Moreaub). In this paper, we assess the propagating capacity, isolate the radiating components from the non-radiating counterparts, and quantify the radiating acoustic sound sources versus the non-radiating hydrodynamic pseudo-sounds of these two sound sources above the cylinder surface and in its oscillating near wake just behind the cylinder. Here, DNS of sound generation and propagation in subsonic flows past a circular cylinder at  $Re=3900$,
 $Ma=0.2$ and
 $0.4$ are performed. We report on observations that in a slender region surrounding the oscillating near wake just behind the circular cylinder, the SPLs are found to be almost as high as those on the cylinder surface itself. In contrast to the pressure fluctuations generated on the cylinder surface, the pressure fluctuations in this oscillating near-wake region hardly radiate to the far field. Rather, they decay rapidly with the distance from the near-wake region. In order to assess the propagating capacity of each sound source and quantify the radiating components in these sound sources on and around the cylinder, we apply the wavelet decomposition method proposed by Mancinelli et al. (Reference Mancinelli, Pagliaroli, Di Marco, Camussi and Castelain2017), previously used in subsonic jet-noise experiments, to decompose the cylinder near-field pressure fluctuations into the radiating acoustic sound sources and the non-radiating hydrodynamic pseudo-sounds. Quantitative analysis of the sound source and pseudo-sound in the oscillating near wake just behind the cylinder explains why the high-level pressure fluctuations in the near-wake region hardly radiate to the far field but decay rapidly with the distance from this near-wake region.
Prior to applying the technique of Mancinelli et al. (Reference Mancinelli, Pagliaroli, Di Marco, Camussi and Castelain2017) to separate the cylinder near-field pressure fluctuations, rigorous independence and convergence analyses of the wavelet decomposition procedure are performed. We demonstrate that separation of near-field pressure fluctuations does not depend on the selection of pressure fluctuation at a far-field position as the input for the wavelet procedure, and that the present sampling time series of pressure fluctuations are sufficiently long that the statistical convergence criterion is satisfied. This confirms the reliability of applying such a wavelet-based technique to the separation between acoustic and hydrodynamic pressure fluctuations in the present study. Conclusions relating to sound sources and pseudo-sounds above the cylinder surface and in the oscillating near wake just behind the cylinder are summarized below.
(i) At near-field locations above and upstream of the cylinder, the hydrodynamic pressure fluctuations are negligibly weak compared with acoustic pressure fluctuations. In the oscillating near wake just behind the cylinder, however, the hydrodynamic pressure fluctuation dominates over the acoustic pressure fluctuation at most frequencies, except at the vortex shedding frequency where they exhibit comparable strengths. Thus, the oscillating near wake just behind the cylinder consists more of the non-radiating pseudo-sound and less of the radiating sound source, which explains why very high-level pressure fluctuations are observed in the near-wake region just behind the cylinder but do not radiate as strongly as the high-level pressure fluctuations generated on the cylinder surface itself.
(ii) Along the angular direction, the cylinder near field can be divided into three sectorial zones according to the changes in the acoustic and hydrodynamic pressure fluctuation levels. The zone less than approximately
 $25^{\circ }$ from the upstream centreline (zone I) is a zone of ‘silence’ at the vortex shedding frequency, because the levels of both pressure fluctuations are significantly low. The zone from $25^{\circ }$ to approximately $155^{\circ }$ (zone II) is a strongly radiating zone and the pressure fluctuation generated on the cylinder surface in this zone is one of the important sound sources. The zone from $155^{\circ }$ to the downstream centreline (zone III), including the oscillating near wake just behind the cylinder, consists more of non-radiating pseudo-sound and less of radiating acoustic pressure fluctuation. Such sectorial division of the near-field sound field draws a clearer picture of the cylinder near-field acoustics.
(iii) Within the region surrounding the oscillating near wake just behind the cylinder, the OASPL of the hydrodynamic pressure fluctuations exceeds that of the acoustic pressure fluctuations. Away from this near-wake region, however, the hydrodynamic pressure fluctuations decrease dramatically while the acoustic counterparts decay slowly as the distance increases, suggesting that the hydrodynamic pressure fluctuation does not propagate to the far field, and that the acoustic pressure fluctuation is the only component to propagate to the far field. The decay of the OASPL thus also explains why high-level pressure fluctuations are observed in the oscillating near wake just behind the cylinder but hardly propagate to the far field.
(iv) The non-radiating hydrodynamic pressure fluctuations are also intermittent, as suggested by the near-zero peak of the p.d.f. of the hydrodynamic component and the kurtosis of the distribution.
(v) The dominant acoustic pressure fluctuations and nearly negligible hydrodynamic counterparts in zone II inspire the use of pressure fluctuation time series at a near-field position in place of a far-field position to carry out the wavelet decomposition procedure. The essentially identical results between using pressure fluctuation at a near-field position in zone II and at a far-field position suggest that the pressure fluctuation signal in the cylinder far field is not necessary and thus the computational domain size can be greatly reduced for future studies on cylinder near-field sound sources. The successful separation between acoustic and hydrodynamic pressure fluctuations using a near-field position in zone II in return verifies our observation that the hydrodynamic pressure fluctuation is negligibly small in this zone II.


The success in separating near-field pressure fluctuations obtained from DNS rather than microphone measurements shows the generality of the wavelet decomposition technique in both experiments and numerical simulations and in both jets and cylinder flows. The investigation of the acoustic and hydrodynamic pressure fluctuations in the cylinder near field helps to identify, localize and quantify radiating sound sources and non-radiating pseudo-sounds. The separation between acoustic and hydrodynamic pressure fluctuations and the division of the cylinder near field into three sectorial zones provides valuable insight into future noise control in practical engineering applications. This way focus can be given to the radiating acoustic component of pressure fluctuation and the strongly radiating zones of sound sources. For example, new techniques to suppress the radiating component, and at the same time not to cause dominant sources in other regions, are effective methods for noise control. The control of radiating acoustic pressure fluctuations generated by cylinder flows is left for future study.
The DNS limits the Reynolds number used in the present study. As the Reynolds number increases, the location of transition moves from the shear layer to the boundary layer, which can possibly induce some hydrodynamic pressure fluctuations on the cylinder surface. If the boundary layers are turbulent, the near-wall region of zone II may not be a purely acoustic region anymore. Future studies concerning the Reynolds number effect on the sound and pseudo-sound generation are meaningful, especially when the Reynolds numbers are high enough to have fully turbulent boundary layers before the separation.
Acknowledgements
Dr M. Mancinelli is gratefully acknowledged for helpful discussions. The Natural Sciences and Engineering Research Council (NSERC) of Canada and Compute Canada are greatly acknowledged for their support in this project as well.
Declaration of interests
The authors report no conflict of interest.



