Introduction
Bentonites are valuable mineral resources of great industrial interest due to their unique physicochemical properties, which are derived from clay minerals of the smectite group (Eisenhour and Brown, Reference Eisenhour and Brown2009; Wolters et al., Reference Wolters, Lagaly, Kahr, Nueesch and Emmerich2009). These properties, including varied layer charge (0.2–0.6 per half unit cell), high plasticity, swelling capacity, water uptake (absorption and adsorption), rheological behavior, and cation exchange capacity, among others, stem primarily from their complex chemistry and small particle size (e.g. Drits, Reference Drits2003; Emmerich et al., Reference Emmerich, Wolters, Kahr and Lagaly2009; Wolters et al., Reference Wolters, Lagaly, Kahr, Nueesch and Emmerich2009; Kaufhold et al., Reference Kaufhold, Stucki, Finck, Steininger, Zimina, Dohrmann, Ufer, Pentrák and Pentráková2017). Smectites are phyllosilicates with a layered structure composed of one octahedral sheet (O) and two tetrahedral silicate sheets (T), forming a TOT layer. These layers are held together by van der Waals forces and electrostatic interactions. Heterogeneous isomorphic substitutions in the tetrahedral (Al3+ by Si4+) and/or octahedral sheets (Mg2+ and/or Fe3+ for Al3+) induce a permanent negative layer charge, which is compensated by hydrated cations in the interlayer space (Ca2+, Na+, K+, Mg2+). Such substitutions generate a wide chemical and structural variety of smectites (e.g. Lagaly, Reference Lagaly1994; Petit et al., Reference Petit, Caillaud, Righi, Madejová, Elsass and Köster2002; Decarreau and Petit, Reference Decarreau and Petit2014).
In most dioctahedral smectites, the predominant tetrahedral isomorphic substitution is Si for Al, leading to the beidellite and nontronite end-members (with dominant octahedral Al and Fe3+, respectively) (e.g. Ross and Hendricks, Reference Ross and Hendricks1945), while montmorillonite is the end-member with dominant octahedral Al/Mg substitutions (e.g. Petit et al., Reference Petit, Caillaud, Righi, Madejová, Elsass and Köster2002). The existence of intermediate smectites in the Al-Fe3+-Mg system has been demonstrated and documented well (e.g. Brigatti, Reference Brigatti1983; Petit et al., Reference Petit, Caillaud, Righi, Madejová, Elsass and Köster2002; Gaudin et al., Reference Gaudin, Petit, Rose, Martin, Decarreau, Noack and Borschneck2004; Meunier et al., Reference Meunier, Lanson and Velde2004; Emmerich et al., Reference Emmerich, Wolters, Kahr and Lagaly2009; Wolters et al., Reference Wolters, Lagaly, Kahr, Nueesch and Emmerich2009).
In Brazil, according to the National Mining Agency (ANM, 2018), the largest bentonite deposits are found in the municipality of Boa Vista, Paraíba State, in the northeastern region, which accounts for >70% of national production. The bentonites from this area, first characterized by Souza-Santos (Reference Souza-Santos1968) as montmorillonites, have been exploited extensively and studied for several decades, with most subsequent works of characterization and application reporting results broadly consistent with the findings of Souza-Santos (Reference Souza-Santos1968) (e.g. Amorim et al., Reference Amorim, Gomes, Lira, França and Ferreira2004; Aranha et al., Reference Aranha, Oliveira, Neumann, Neto, Munayco, Scorzelli and San Gil2007). However, due to the growing demand for this resource, new deposits are being explored elsewhere in the Brazilian northeast, as some high-quality varieties from the Paraíba region are nearly depleted. Among these, the Formosa bentonite deposit, in the municipality of Formosa da Serra Negra, Maranhão State, stands out as a relatively recent discovery, first reported and described by Paz et al. (Reference Paz, Angélica, Neves, Neumann and da Costa2011, Reference Paz, Angélica and Freitas Neves2012) as montmorillonite based on the Hofmann–Klemen test. Nonetheless, to date, this bentonite remains largely unexplored.
Despite the extensive literature on Boa Vista bentonites and a few focused studies on Formosa bentonite (e.g. Cavalcante et al., Reference Cavalcante, Paz, Angélica, Ito and Neves2016; Carmo et al., Reference Carmo, Angélica and Paz2021), the crystal chemistry of these smectites has not yet been fully elucidated. In particular, the distribution of layer charge has not been addressed in detail, despite its importance in smectite classification and behavior. This limited understanding arises not only from their typical crystal chemical heterogeneity, but mainly from their intimate association with accessory minerals, which makes it challenging to concentrate pure smectite phases (Brigatti, Reference Brigatti1983). To our knowledge, available studies of these bentonites have focused on clay fractions (<2 μm), which often include non-smectitic phases and do not necessarily reflect the actual stoichiometry of the smectites.
To overcome these limitations, this study focuses on the detailed crystal chemistry of the Formosa smectite and three commercial smectites from the Boa Vista Region by studying and comparing the <0.1 μm clay fractions, which concentrate smectite and minimize the interference of accessory minerals. The characterization was carried out using a combination of analytical techniques, with the aim of resolving the distribution of layer charge between tetrahedral and octahedral sheets and evaluating its implications for swelling behavior, thereby contributing to the understanding of structure-reactivity relationships in dioctahedral smectites.
Materials and methods
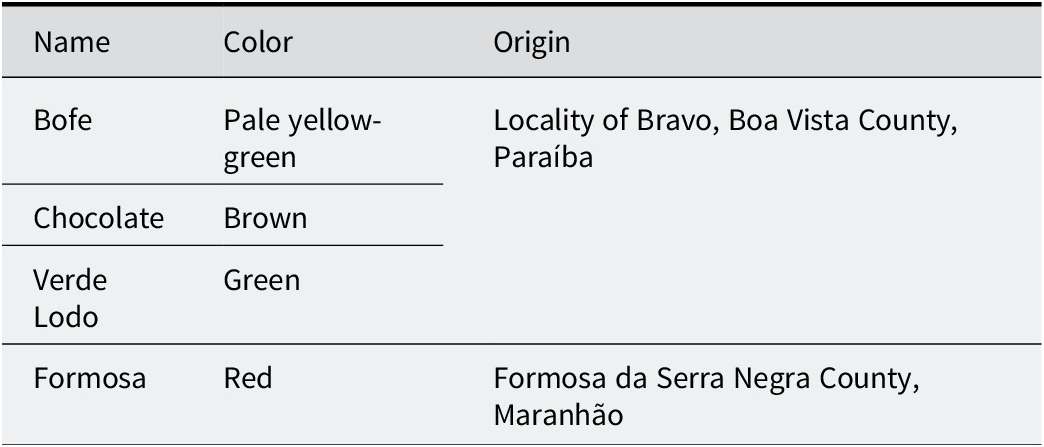
Four Brazilian bentonites were used: Formosa, Bofe, Chocolate, and Verde Lodo (Table 1). The Formosa bentonite is a reddish clay collected by Paz et al. (Reference Paz, Angélica and Freitas Neves2012) along the MA-006 highway (coordinates 06°25′12′′S, 46°10′52′′W) in Formosa da Serra Negra County, Maranhão State. It derives from the saprolite of altered amygdaloidal basalts of the Mosquito Formation (Upper Triassic–Lower Jurassic), which crops out in the western portion of the sedimentary Parnaíba Basin and is associated with continental flood basalt (CFB) volcanism related to the Central Atlantic Magmatic Province (CAMP) (Góes and Feijó, Reference Góes and Feijó1994; Vaz et al., Reference Vaz, Rezende, das, de, da, Wanderley Filho and Travassos2007; Merle et al., Reference Merle, Marzoli, Bertrand, Reisberg, Verati, Zimmermann, Chiaradia, Bellieni and Ernesto2011; Oliveira et al., Reference Oliveira, Pimentel, Fuck, Oliveira, Daly, Fuck, Julià, MacDonald and Watts2018). Paz et al. (Reference Paz, Angélica and Freitas Neves2012) described the sampled outcrop as a ~2 m thick road cut exposing altered basalt, with an homogeneous clayey horizon extending down to ~5 m depth. The sample was collected from different portions of the outcrop, homogenized, and quartered to obtain a representative bulk sample.
Name and origins of the four bentonites studied

Table 1. Long description
The table consists of three columns titled Name, Color, and Origin.
- Row 1: Bofe, Pale yellow-green, Locality of Bravo, Boa Vista County, Paraíba.
- Row 2: Chocolate, Brown, Locality of Bravo, Boa Vista County, Paraíba.
- Row 3: Verde Lodo, Green, Locality of Bravo, Boa Vista County, Paraíba.
- Row 4: Formosa, Red, Formosa da Serra Negra County, Maranhão.
The Bofe, Chocolate, and Verde Lodo samples are commercial varieties of bentonites from the locality of Bravo, Boa Vista region, Paraíba State. The samples were obtained as raw commercial products, without laboratory beneficiation or chemical activation. These bentonites have been used in several Brazilian studies (e.g. Amorim et al., Reference Amorim, Gomes, Lira, França and Ferreira2004; Carmo et al., Reference Carmo, Angélica and Paz2021; Cótica et al., Reference Cótica, Freitas, Santos, Barabach, Anaissi, Miyahara and Sarvezuk2011; Paz et al., Reference Paz, Angélica, Neves, Neumann and da Costa2011; Rodrigues et al., Reference Carmo, Angélica and Paz2021; Silva et al., Reference Silva, Fernandes, Silva, Santos Filho, Rodrigues, Menezes and Neves2024) and were selected here as reference materials. The various names correspond to commercial names based on their macroscopic color (Table 1).
The <0.1 μm fine-clay fraction was extracted from the <2 μm clay fraction, obtained previously by sieving (>63 μm) and gravimetric centrifugation (Sigma 6-15, 399×g, 5 min). First, 6 g of the <2 μm fraction was dispersed in ultrapure water (Milli-Q, 18.2 MΩ cm–1) and acidified to pH 5 using 0.01 M HCl to remove carbonate phases. The suspension was then saturated with 1 M NaCl. Subsequently, the <0.1 μm fraction was extracted by centrifugation using a Beckman Coulter J-30I centrifuge equipped with a continuous flow rotor JS-24-38 at 28,175 xg for 15 min. The centrifugation cycles were repeated until the supernatant (<0.1 μm fraction) became clear.
Both coarse (2–0.1 μm) and fine (<0.1 μm) clay fractions were subsequently saturated three times with Ca2+ using a 1 M CaCl2 solution. Excess salt was removed carefully by dialysis with distilled water until a negative reaction with AgNO3. Finally, the fractions were dried at 60°C and ground manually in an agate mortar.
The cation exchange capacity (CEC) was determined through NH4+ saturation at pH=7 (Schollenberger and Simon, Reference Schollenberger and Simon1945). For this measurement, 150 mg of each Ca-saturated sample was suspended in 15 mL of a 1 M ammonium acetate solution (CH3COONH4), shaken for 2 days, and then centrifuged to recover the exchange solution (supernatant). The process was repeated three times to ensure complete NH4+ exchange. The CEC was calculated based on the Ca2+ concentration in the supernatant measured by atomic absorption spectroscopy (AAS) in a Varian AA240FS flame spectrometer.
The predominant layer charge location (tetrahedral versus octahedral) was determined through the Hofmann-Klemen (H-K) treatment (Hofmann and Klemen, Reference Hofmann and Klemen1950). The H-K treatment, largely used to distinguish montmorillonite from beidellite (Greene-Kelly, Reference Greene-Kelly1953; Greene-Kelly, Reference Greene-Kelly1955) consists of the neutralization of octahedral charges in dioctahedral smectites through saturation with Li+ and subsequent migration of this cation to the octahedral vacancies through heating. For this procedure, 150 mg of each Ca-saturated <0.1 μm fraction was mixed with 15 mL of a 1 M LiCl solution, stirred for 24 h, centrifuged, and washed carefully by dialysis in distilled water to eliminate excess salt. The process was repeated three times to ensure complete Li+ saturation. The material was then heated at 300°C for 12 h to obtain Li+-fixed smectite (H-K sample).
The layer charge distribution between the octahedral and tetrahedral sheets was quantified by Fourier transform infrared spectroscopy (FTIR) following the NH4+ method of Petit et al. (Reference Petit, Righi, Madejová and Decarreau1998, Reference Petit, Righi, Madejová and Decarreau1999, Reference Petit, Righi and Madejová2006). This method involves measuring the normalized integrated intensity of the ν4NH4+ deformation band at 1400–1440 cm–1 in NH4+-saturated smectites before and after Li+ fixation by the H-K treatment (Hofmann and Klemen, Reference Hofmann and Klemen1950). The integrated intensity of the ν4NH4+ band before Li+ fixation corresponds to the total charge, i.e. CEC, while the integrated intensity after Li+ fixation corresponds to the remaining charge, i.e. tetrahedral plus variable charge. The difference between them corresponds to the neutralized charge, i.e. octahedral charge (Petit et al., Reference Petit, Righi and Madejová2006). For this method, both NH4+-saturated samples prepared for the CEC measurements and H-K treated samples saturated with NH4+ were used. The samples were dialyzed to eliminate excess salt until testing negative with Nessler’s reagent.
The proportion of swelling and non-swelling layers after H-K treatment was quantified by modeling the experimental XRD patterns on oriented preparation using the algorithms of Drits and coworkers (Sakharov and Drits, Reference Sakharov and Drits1973; Drits and Sakharov, Reference Drits, Sakharov and Nauka1976; Drits et al., Reference Drits, Środoń and Eberl1997; Sakharov et al., Reference Sakharov, Lindgreen, Salyn and Drits1999). During the modeling exercise, the atomic position of Li-saturated interlayers with either zero, one or two layers of ethylene glycol molecules (i.e. 0EG, 1EG, and 2EG, respectively) were taken from Sakharov et al. (Reference Sakharov, Lindgreen, Salyn and Drits1999). The d spacings of these layer types were ~9.7, ~13.5 and ~17 Å, respectively. The number of layers N in the coherent scattering domain sizes was adjusted during the fitting procedure.
X-ray diffraction (XRD) measurements were performed using a Bruker AXS D8 ADVANCE diffractometer operating at 40 kV and 40 mA and equipped with a Cu X-ray tube (Kα1 = 1.54 Å) together with a LynxEYE XE-T linear detector. The <0.1 μm fractions were analyzed as oriented mounts (1 mL of clay suspension deposited on a glass slide) in the air-dried state (AD), after ethylene glycol (EG) solvation, and after H-K treatment. Randomly oriented mounts (front loading mounting mode) were also prepared to study the d 06-33 reflections. Scanning conditions were as follows: for oriented samples, scan range from 2 to 35°2θ, step size of 0.026°2θ and 20.1 s time per step in continuous scanning mode, automatic divergence slit, 2.5° soller slits, irradiated sample size of 10 mm, and automatic beam knife. Random scans were recorded from 55 to 65°2θ with a step size of 0.02°2θ and 20.1 s time per step.
Additional randomly oriented measurements (back-loading mode) of the 0.1–2 μm and <0.1 μm fractions were conducted on a PANalytical Empyrean diffractometer, operating at 40 kV and 35 mA, Co X-ray tube (Kα1 = 1.78901 Å), Fe Kβ filter, and a PIXcel3D-Medpix 3×1 area detector. Mineralogical identification was performed using the PANalytical X’Pert HighScore Plus 3.0 software, along with the Crystallography Open Database (COD) (Gražulis et al., Reference Gražulis, Chateigner, Downs, Yokochi, Quirós, Lutterotti, Manakova, Butkus, Moeck and Le Bail2009).
Infrared spectra were recorded in transmission mode using a Thermo Scientific Nicolet iS50 FTIR spectrometer, in the spectral range 4000–400 cm–1 (mid-infrared, MIR), with a resolution of 4 cm–1 and 100 scans. The spectrometer was purged continuously with dry air during scanning. KBr pellets were prepared by mixing 1 mg of sample (<0.1 μm fraction) with 150 mg of KBr and pressing at 8 tons cm–2 for 5 min; the pellets were then dried overnight at 110°C. Data were acquired and interpreted using OMNIC 9.4 software (Nicolet instrument).
Morphological analyses by transmission electron microscopy (TEM) and chemical composition by energy dispersive X-ray spectroscopy (EDX) of the individual smectite particles were conducted using a JEOL JEM 2010 STEM microscope equipped with a LaB6 filament, a GATAN ultrascan 1000XP (2K×2K) camera, and a Bruker QUANTAX EDX system with an Xflash detector. The microscope operated at an acceleration voltage of 200 kV and 0.23 nm point-to-point resolution. Data acquisition and processing were performed using Digital Micrograph software (Gatan Inc.). Atomic percentages were calculated following the Cliff-Lorimer criterion (Cliff and Lorimer, Reference Cliff and Lorimer1975), using Si as the k calibration factor. To avoid structural modifications and loss of light elements arising from the electron beam damage, analyses were conducted at a magnification of ×50,000 with a 4L spot size and an acquisition time of 30 s. For TEM-EDX analysis, each Ca-saturated <0.1 μm fraction was dispersed in ultrapure water by vortexing, and a droplet of the suspension was deposited and dried on a copper grid coated with carbon and collodion.
Results and Discussion
Analysis of size fractionations and mineralogical composition
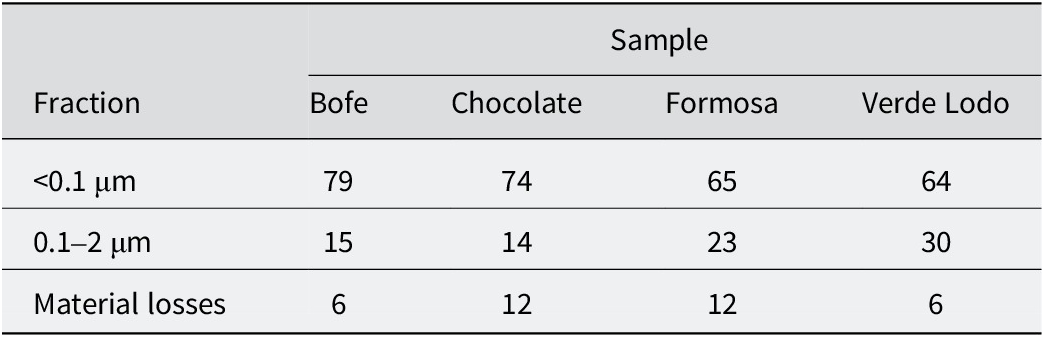
The relative mass distribution of the separated fractions, referenced to the initial mass of the <2 μm fraction prior to size separation, is shown in Table 2. The results indicate that all samples are predominantly composed of the fine <0.1 μm fraction, which accounts for >64 wt.%. Material losses include operational losses during centrifugation and sample handling, as well as minor mass loss during chemical pretreatment with HCl.
Mass distribution after size fractionation of the <2 μm fraction (wt.%)

Table 2. Long description
The table consists of five columns and four rows of data. The columns are labeled Fraction, Bofe, Chocolate, Formosa, and Verde Lodo.
* The first data row for the fraction less than 0.1 micrometers shows values of 79 for Bofe, 74 for Chocolate, 65 for Formosa, and 64 for Verde Lodo.
* The second data row for the fraction between 0.1 and 2 micrometers shows values of 15 for Bofe, 14 for Chocolate, 23 for Formosa, and 30 for Verde Lodo.
* The third data row for Material losses shows values of 6 for Bofe, 12 for Chocolate, 12 for Formosa, and 6 for Verde Lodo.
All values are expressed in weight percent. Material losses refer to mass lost during centrifugation, sample handling, and chemical pre-treatment with H C l.
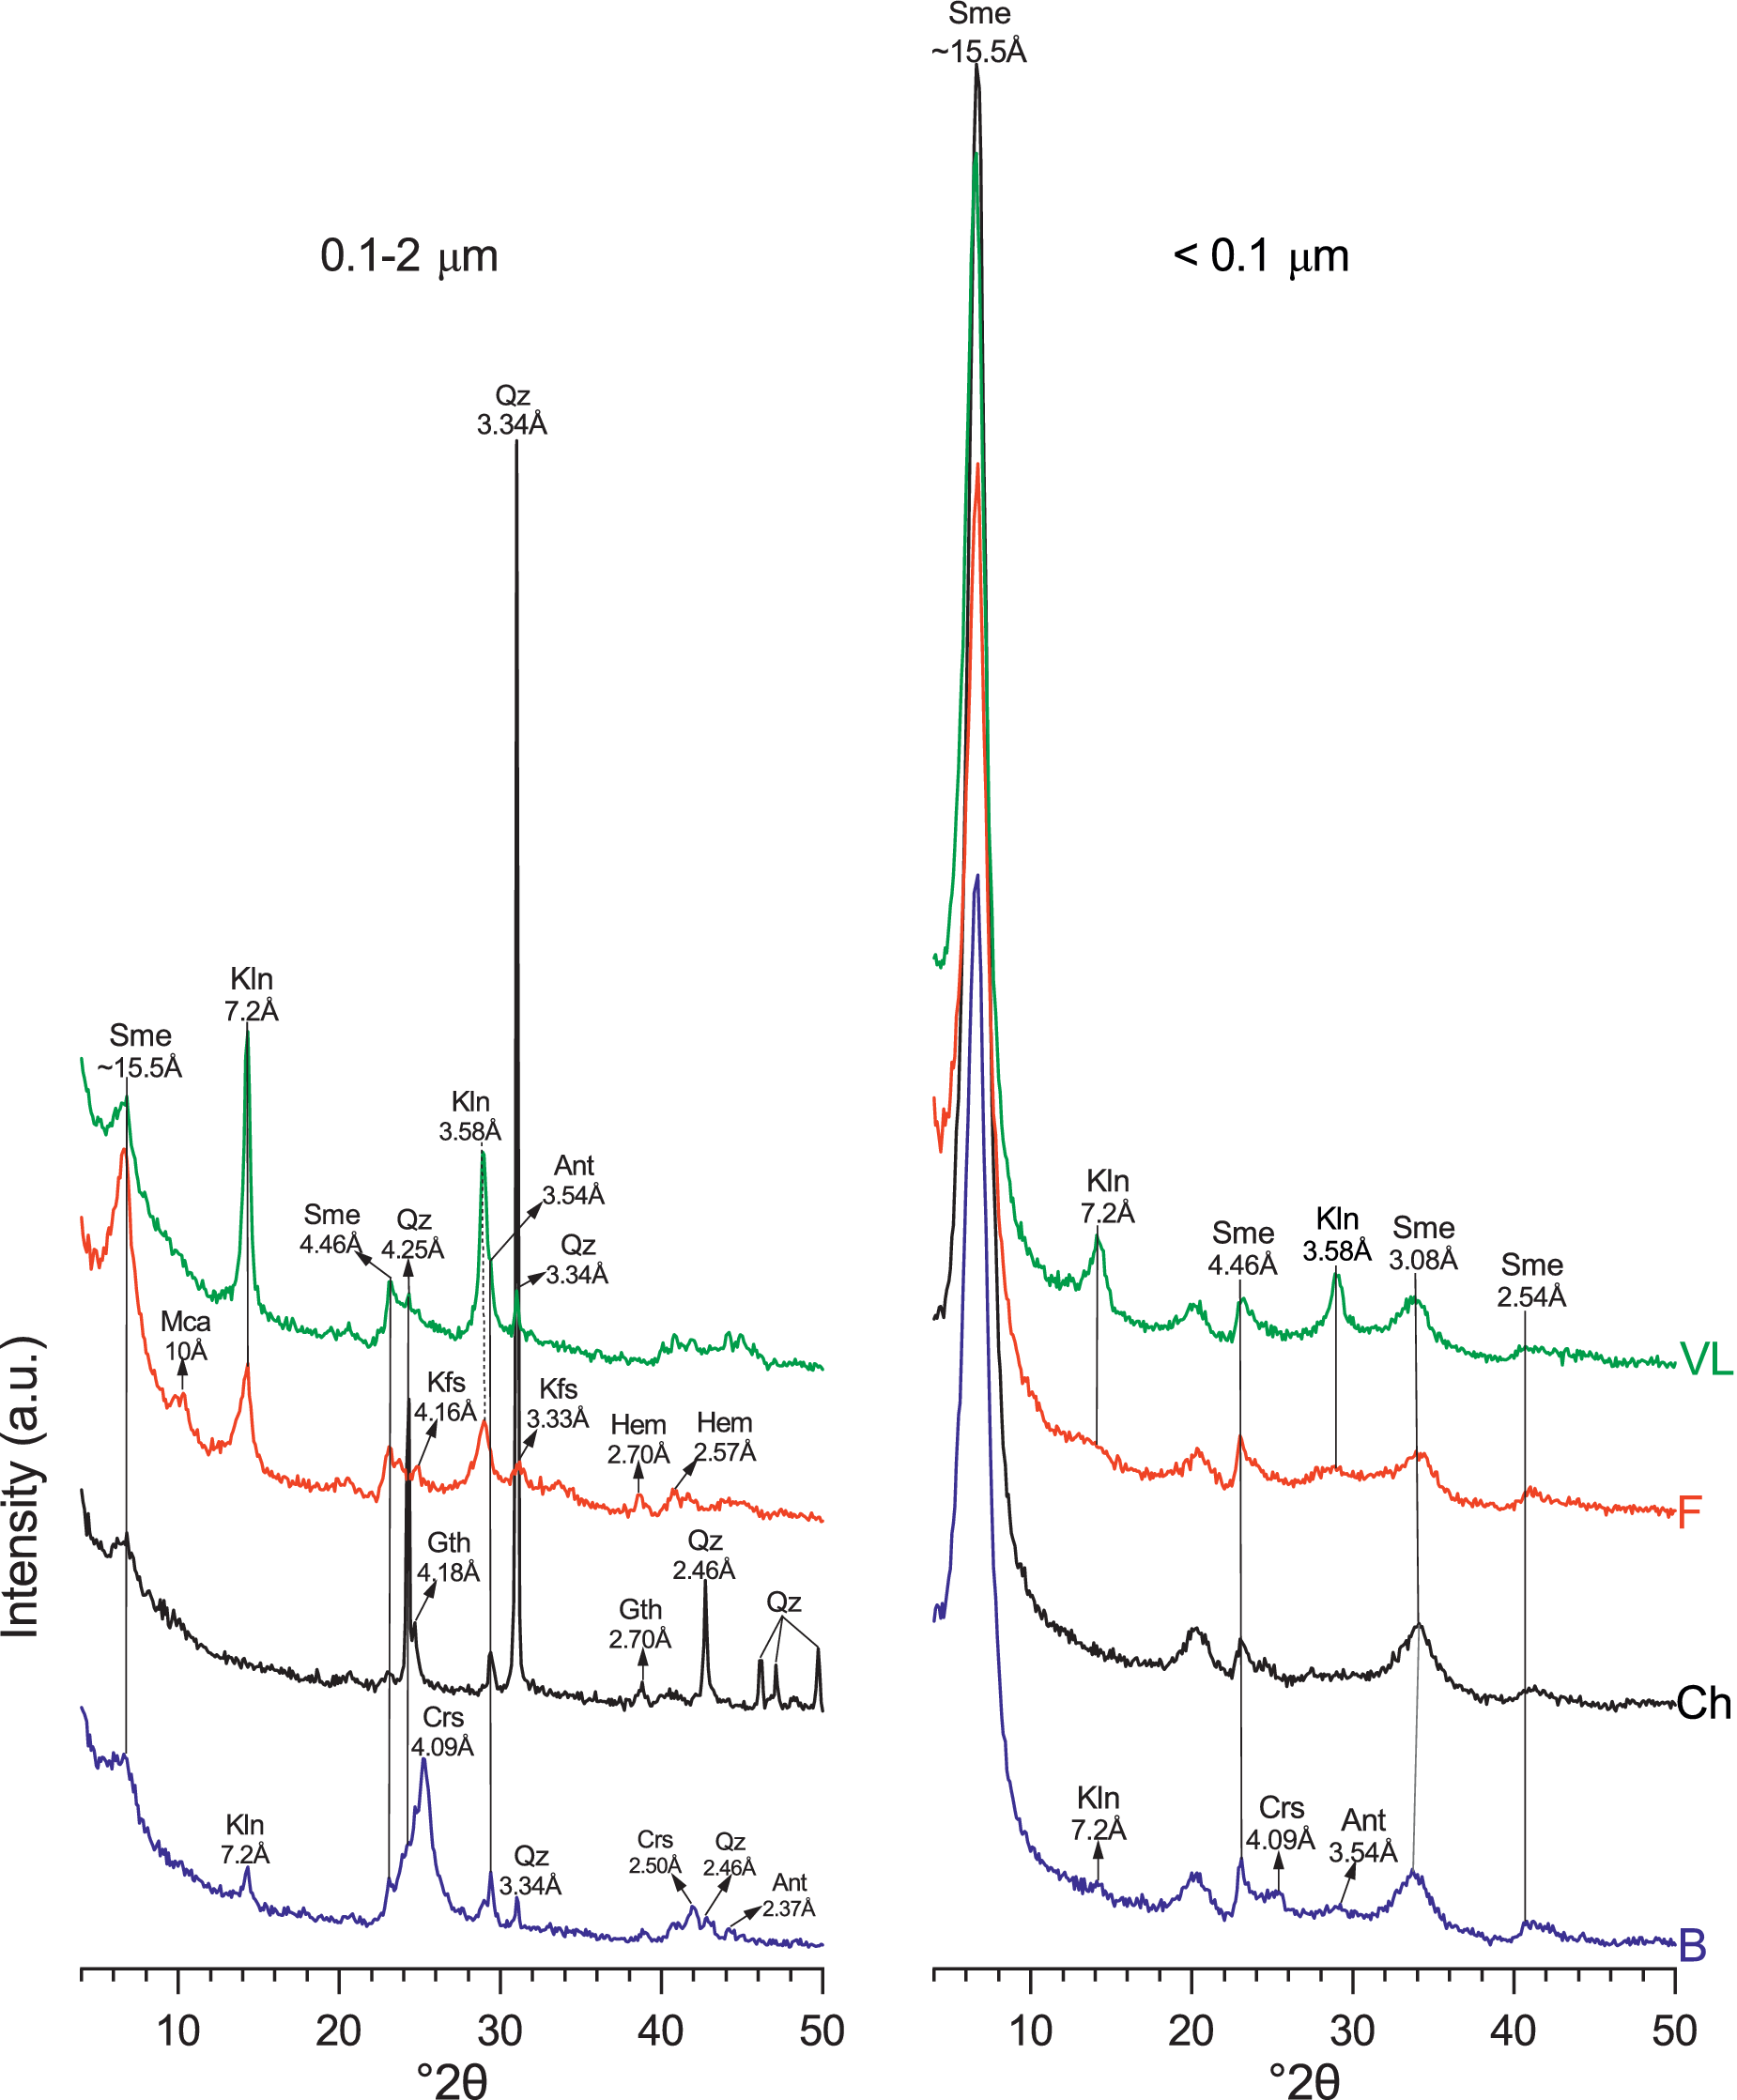
The XRD patterns of randomly oriented powder revealed that the size-fractionation procedure led to an enrichment of accessory minerals such as kaolinite, feldspars, anatase, quartz, cristobalite, and iron oxides (hematite and goethite) in the coarsest 0.1–2 μm fraction (Fig. 1).
XRD patterns of the 0.1–2 μm (left) and the <0.1 μm (right) fractions of the four Ca-saturated samples. B = Bofe, Ch = Chocolate, F = Formosa, VL = Verde Lodo, Sme = smectite, Kln = kaolinite, Ant = anatase, Qz = quartz, Gth = goethite, Hem = hematite, Crs = cristobalite, Kfs = K-feldspar, Mca = mica.

Figure 1. Long description
Two side-by-side line graphs plot Intensity in arbitrary units on the y-axis against degrees 2 theta from 0 to 50 on the x-axis. Each graph contains four vertically stacked colored lines labeled V L (green), F (red), Ch (black), and B (blue).
Left Panel (0.1 to 2 micrometers):
* Sme at approximately 15.5 Angstroms appears as a broad peak near 6 degrees 2 theta.
* Mca at 10 Angstroms is a small peak on the Ch and F lines.
* Kln at 7.2 Angstroms and 3.58 Angstroms shows sharp peaks across all samples.
* Qz at 3.34 Angstroms is the most prominent, sharp vertical peak extending through all samples at approximately 27 degrees 2 theta.
* Other identified peaks include Kfs at 4.16 and 3.33 Angstroms, Gth at 4.18 and 2.70 Angstroms, Crs at 4.09 Angstroms, Ant at 3.54 Angstroms, and Hem at 2.70 and 2.57 Angstroms.
Right Panel (less than 0.1 micrometers):
* Sme at approximately 15.5 Angstroms is the dominant feature, showing a very high intensity, sharp peak at approximately 6 degrees 2 theta for all samples.
* Secondary Sme peaks are labeled at 4.46, 3.08, and 2.54 Angstroms.
* Kln peaks at 7.2 and 3.58 Angstroms are present but significantly lower in intensity compared to the left panel.
* Minor peaks for Crs at 4.09 Angstroms and Ant at 3.54 Angstroms are visible on the bottom blue line B.
The <0.1 μm fractions predominantly consisted of smectite, identified by the main d 001 reflection at ~15.5 Å in all samples. The shapes of the diffraction bands at ~4.5 and ~2.5 Å, also attributed to smectite, are characteristic of its typical turbostratic disorder. Among the samples, a nearly exclusive concentration of smectite in this fraction was noticed only in Chocolate. In the other three samples, kaolinite (~7.2 Å), cristobalite (~4.1 Å), and anatase (~3.5 Å) were still present in minor amounts.
Structural characterization of samples (<0.1 μm fraction)
XRD analysis of oriented preparations
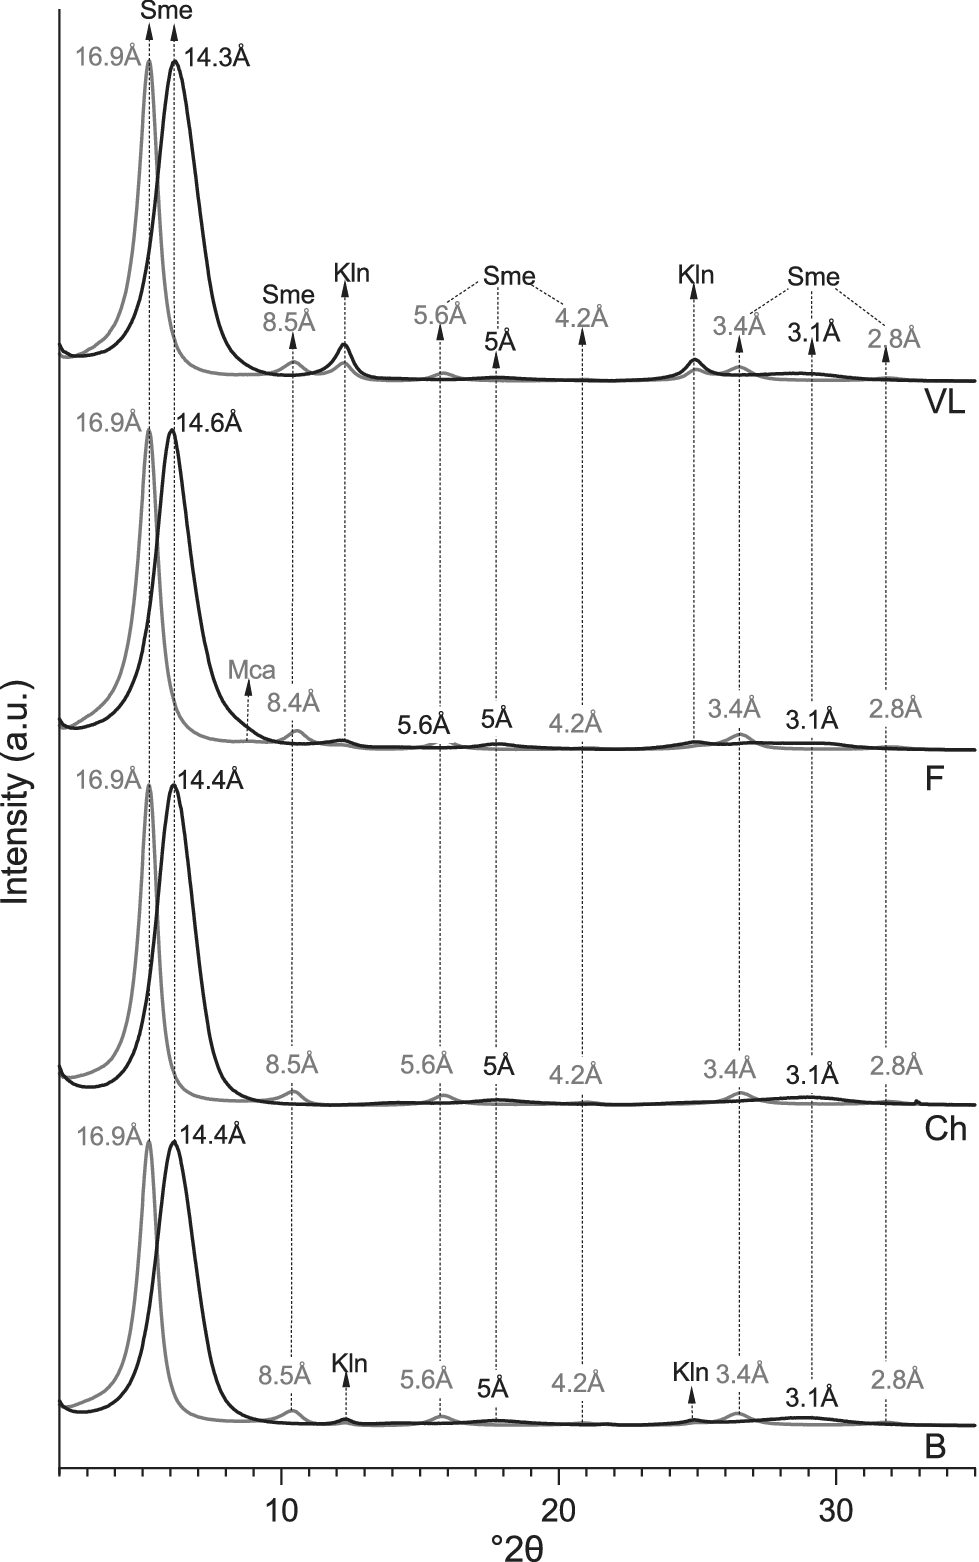
A detailed analysis of the XRD patterns from oriented mounts in the air-dried (AD) and glycolated states (EG) (Fig. 2) revealed similar behaviors across all samples. Smectite dominated in all cases, with a d 001 reflection at ~14 Å in the AD state that expanded to ~17 Å upon EG solvation. This expansion was accompanied by symmetrical and harmonic reflections: d 002 at ~8.4–8.5 Å and d 003 at ~5.6 Å. The symmetrical shape of these reflections in both states indicates the presence of pure swelling smectite crystals (e.g. Suquet et al., Reference Suquet, Malard, Copin and Pezerat1981) and the negligible presence of interstratified illite-like layers.
XRD oriented patterns of the <0.1 μm fractions (Ca-saturated). Black lines: air-dried (AD), gray lines: ethylene glycol-treated (EG); B = Bofe, Ch = Chocolate, F = Formosa, VL = Verde Lodo, Sme = smectite, Kln = kaolinite, Mca = mica.

Figure 2. Long description
The diagram consists of four vertically stacked panels representing X R D oriented patterns. The x-axis is labeled degrees 2 theta ranging from approximately 2 to 35. The y-axis represents Intensity in arbitrary units. Each panel contains two line plots: a thick black line for air-dried (A D) samples and a thin gray line for ethylene glycol-treated (E G) samples.
From top to bottom, the panels are labeled V L, F, Ch, and B.
* Panel V L (Top): Shows a dominant A D peak at 14.3 Angstroms which shifts to 16.9 Angstroms in the E G treatment, both labeled Sme. Smaller peaks are noted at 8.5 Angstroms (Sme), 7.1 Angstroms (Kln), 5.6 Angstroms (Sme), 5 Angstroms (Sme), 4.2 Angstroms, 3.5 Angstroms (Kln), 3.4 Angstroms (Sme), 3.1 Angstroms (Sme), and 2.8 Angstroms.
* Panel F: Displays a similar shift from a 14.6 Angstrom A D peak to a 16.9 Angstrom E G peak. A small Mca peak is visible near 10 Angstroms. Minor peaks at 8.4, 5.6, 5, 4.2, 3.4, 3.1, and 2.8 Angstroms follow the same pattern as V L.
* Panel Ch: Shows the primary A D peak at 14.4 Angstroms shifting to 16.9 Angstroms for E G. Secondary peaks are labeled at 8.5, 5.6, 5, 4.2, 3.4, 3.1, and 2.8 Angstroms.
* Panel B (Bottom): Shows the primary A D peak at 14.4 Angstroms shifting to 16.9 Angstroms for E G. Distinct Kln peaks are labeled at 7.1 Angstroms and 3.5 Angstroms. Other minor peaks at 8.5, 5.6, 5, 4.2, 3.4, 3.1, and 2.8 Angstroms are present.
Vertical dashed lines align the peaks across all four panels to demonstrate the consistency of the mineral signatures (Sme, Kln, and Mca) across the different samples.
In Formosa, and to a lesser extent in Verde Lodo, small shoulders at 10 Å and 5 Å in the EG state were attributed to the d 001 and d 002 reflections, respectively, of mica with a small coherent scattering domain size. In addition, the ~7.2 and ~3.6 Å symmetric reflections in Formosa, Bofe and Verde Lodo in both AD and EG states were attributed to the rational 00l reflections of kaolinite.
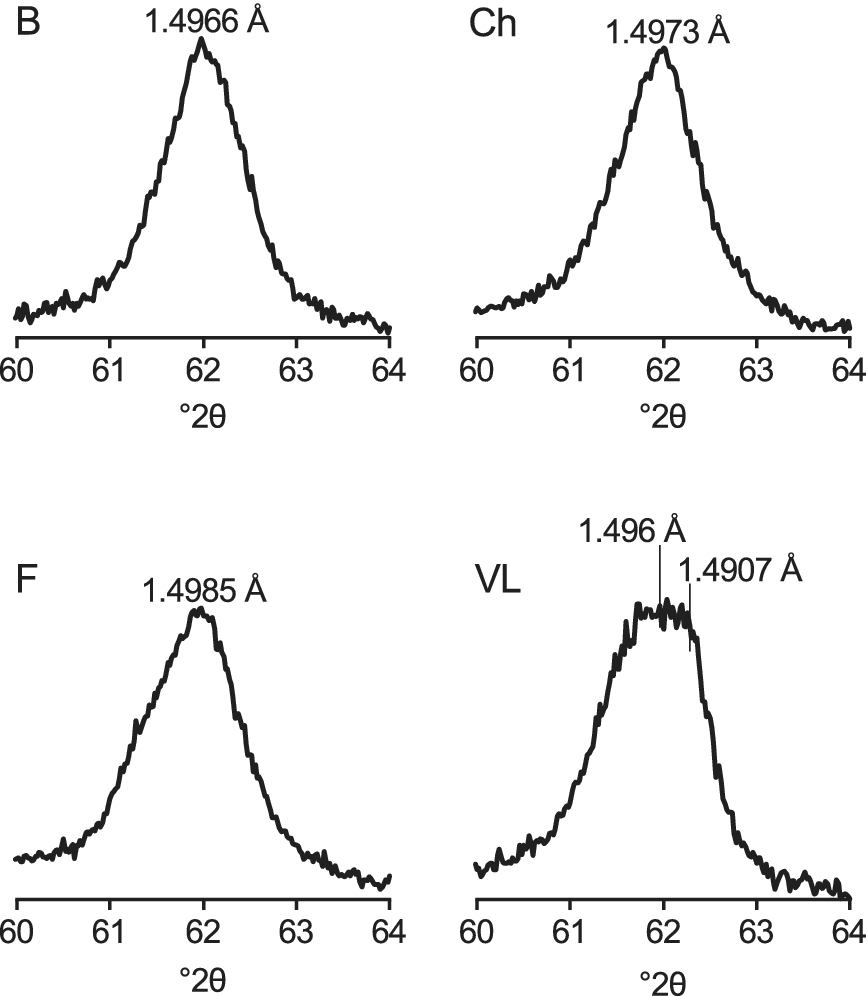
The d 06-33 reflections ranging from 1.49 to 1.50 Å in all samples, are typical of dioctahedral smectites (e.g. Emmerich et al., Reference Emmerich, Wolters, Kahr and Lagaly2009; Kaufhold et al., Reference Kaufhold, Chryssikos, Kacandes, Gionis, Ufer and Dohrmann2019; Petit et al., Reference Petit, Decarreau, Grégoire and Ferrage2023), (Fig. 3). In Formosa, this reflection appears asymmetrically toward low angles, due to the contribution of mica rather than to the occurrence of particles with more structural octahedral Fe3+ content compared with the other samples (Petit et al., Reference Petit, Decarreau, Grégoire and Ferrage2023). In Bofe and Chocolate, the reflection is symmetrical, while in Verde Lodo it appears broader due to overlap with kaolinite at 1.4907 Å.
d 06-33 reflections of the four smectites (<0.1 μm fractions). VL shows a broad peak attributed to the combined contributions of smectite (1.496 Å) and kaolinite (1.4907 Å). B = Bofe, Ch = Chocolate, F = Formosa, VL = Verde Lodo.

Figure 3. Long description
The figure consists of four separate line graphs, each showing intensity on the Y-axis (unlabeled) against degrees 2 theta on the X-axis, ranging from 60 to 64.
* Top-left panel B: Shows a single sharp peak centered at approximately 62 degrees 2 theta, labeled with a value of 1.4966 Angstroms.
* Top-right panel Ch: Shows a single sharp peak centered at approximately 62 degrees 2 theta, labeled with a value of 1.4973 Angstroms.
* Bottom-left panel F: Shows a single sharp peak centered at approximately 62 degrees 2 theta, labeled with a value of 1.4985 Angstroms.
* Bottom-right panel V L: Shows a broader, plateau-like peak centered around 62 degrees 2 theta. Two vertical lines indicate specific sub-peaks within this broad feature, labeled 1.496 Angstroms and 1.4907 Angstroms respectively.
Fourier transform infrared spectroscopy
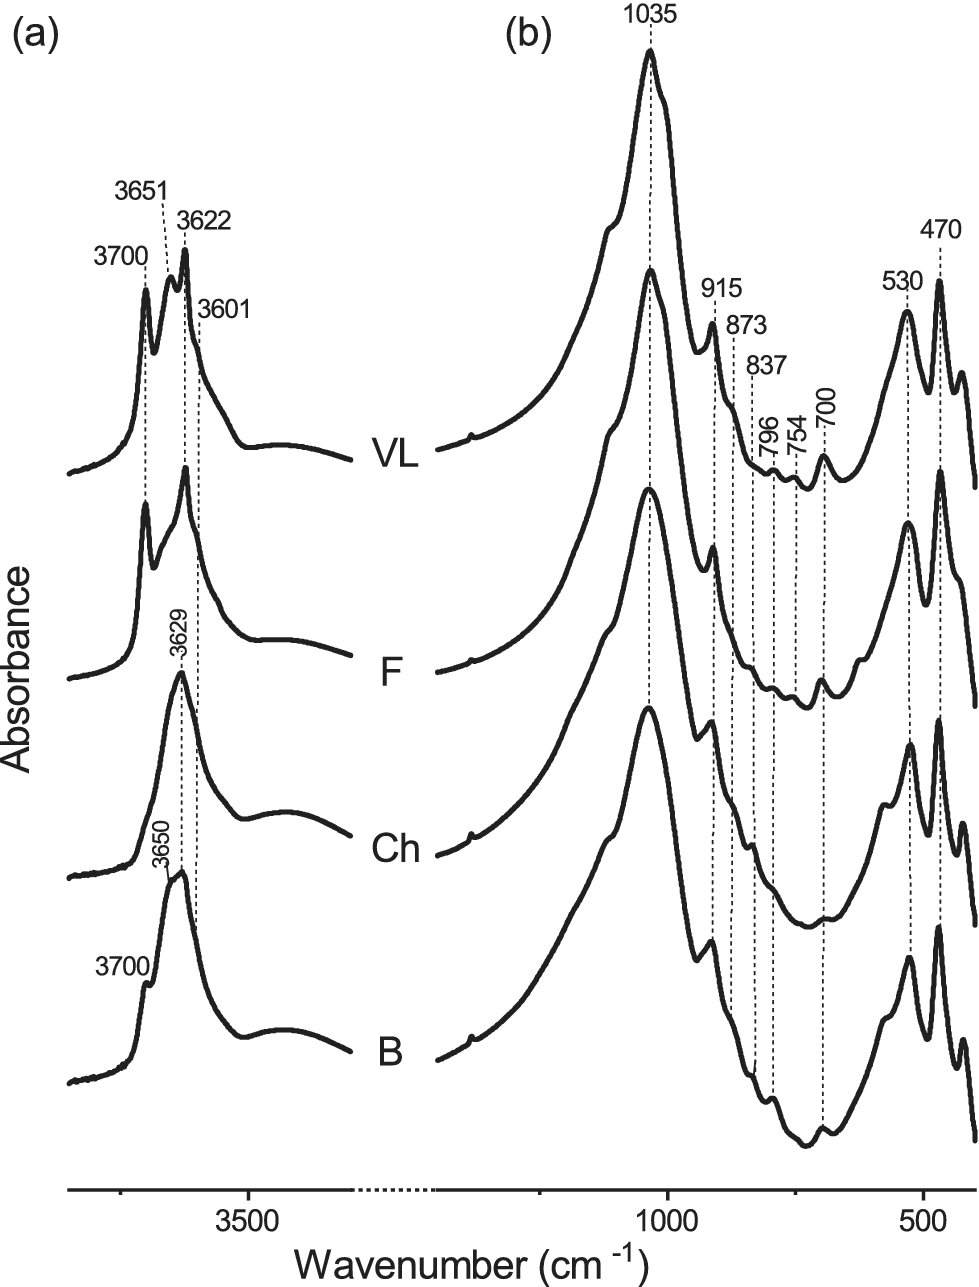
The infrared spectra (Fig. 4) of all samples exhibited typical features of Al-rich dioctahedral smectites. However, consistent with the XRD data, kaolinite-related features with the two characteristic vibration bands at ~3700 and 3622 cm–1 were observed in the Formosa and Verde Lodo samples, and to a lesser extent in Bofe.
FTIR-MIR spectra of the <0.1 μm fractions (Ca-saturated). (a) OH-stretching region; (b) OH-bending region. B = Bofe, Ch = Chocolate, F = Formosa, VL = Verde Lodo.

Figure 4. Long description
A multi-panel attribute space diagram with two panels labeled a and b. The horizontal x-axis represents Wavenumber in centimeters super minus 1, and the vertical y-axis represents Absorbance. Both panels contain four vertically stacked spectral lines labeled from top to bottom as V L, F, Ch, and B.
Panel a, the O H stretching region, covers the range from approximately 3800 to 3400. Vertical dashed lines mark specific peaks. For V L and F, peaks are identified at 3700, 3651, 3622, and 3601. For Ch and B, the peaks shift or merge, with labels at 3700, 3650, and 3629.
Panel b, the O H bending region, covers the range from approximately 1200 to 400. A dominant peak is marked at 1035 for all samples. To the right of this main peak, a series of smaller inflection points are marked with dashed lines at 915, 873, 837, 796, 754, and 700. At the far right of the spectrum, two distinct peaks are marked at 530 and 470. The spectral signatures are most defined in the top V L sample and become broader or less distinct in the bottom B sample.
In the OH-stretching region (Fig. 4a), the broad band at ~3630–3650 cm–1 is mainly attributed to ν(Al2OH) in smectite (e.g. Farmer, Reference Farmer and Farmer1974; Russell and Fraser, Reference Russell, Fraser and Wilson1994; Madejová et al., Reference Madejová, Bujdák, Petit and Komadel2000; Madejová et al., Reference Madejová, Gates and Petit2017). In Verde Lodo, the band at 3650 cm–1 is particularly intense due to overlap with the νOH band of kaolinite, which is most abundant in this sample. A weak shoulder at ~3601 cm–1 is attributed to ν(AlFe3+OH), indicating a small amount of structural octahedral Fe3+ in all samples.
In the OH-bending region (Fig. 4b), the band at ~914 cm–1 is assigned to δ(Al2OH) in smectite and kaolinite. This band appears broader in Bofe and Chocolate, reflecting a predominant smectite contribution. Conversely, in Formosa and Verde Lodo, the greater kaolinite content contributes to the narrowing of this band. Kaolinite is further identified in the Formosa and Verde Lodo samples through the shoulders at ~1010, 790, 755, and 697 cm–1 (e.g. Madejová et al., Reference Madejová, Balan, Petit and Christidis2011). In Bofe, the broad band at 794 cm–1 is attributed here to cristobalite as identified by XRD.
Shoulders at ~873 cm–1 and ~837 cm–1 present in all samples, are attributed to δ(AlFe3+OH) and δ(AlMgOH) in smectite, respectively (e.g. Farmer, Reference Farmer and Farmer1974; Bishop et al., Reference Bishop, Madejová, Komadel and Fröschl2002; Petit et al., Reference Petit, Caillaud, Righi, Madejová, Elsass and Köster2002; Madejová et al., Reference Madejová, Gates and Petit2017; Kaufhold et al., Reference Kaufhold, Chryssikos, Kacandes, Gionis, Ufer and Dohrmann2019). The bands at 533 cm–1 and 469 cm–1 further confirm that the smectites are Al-rich (e.g. Gaudin et al., Reference Gaudin, Petit, Rose, Martin, Decarreau, Noack and Borschneck2004; Madejová et al., Reference Madejová, Balan, Petit and Christidis2011, Reference Madejová, Gates and Petit2017).
Transmission electron microscopy
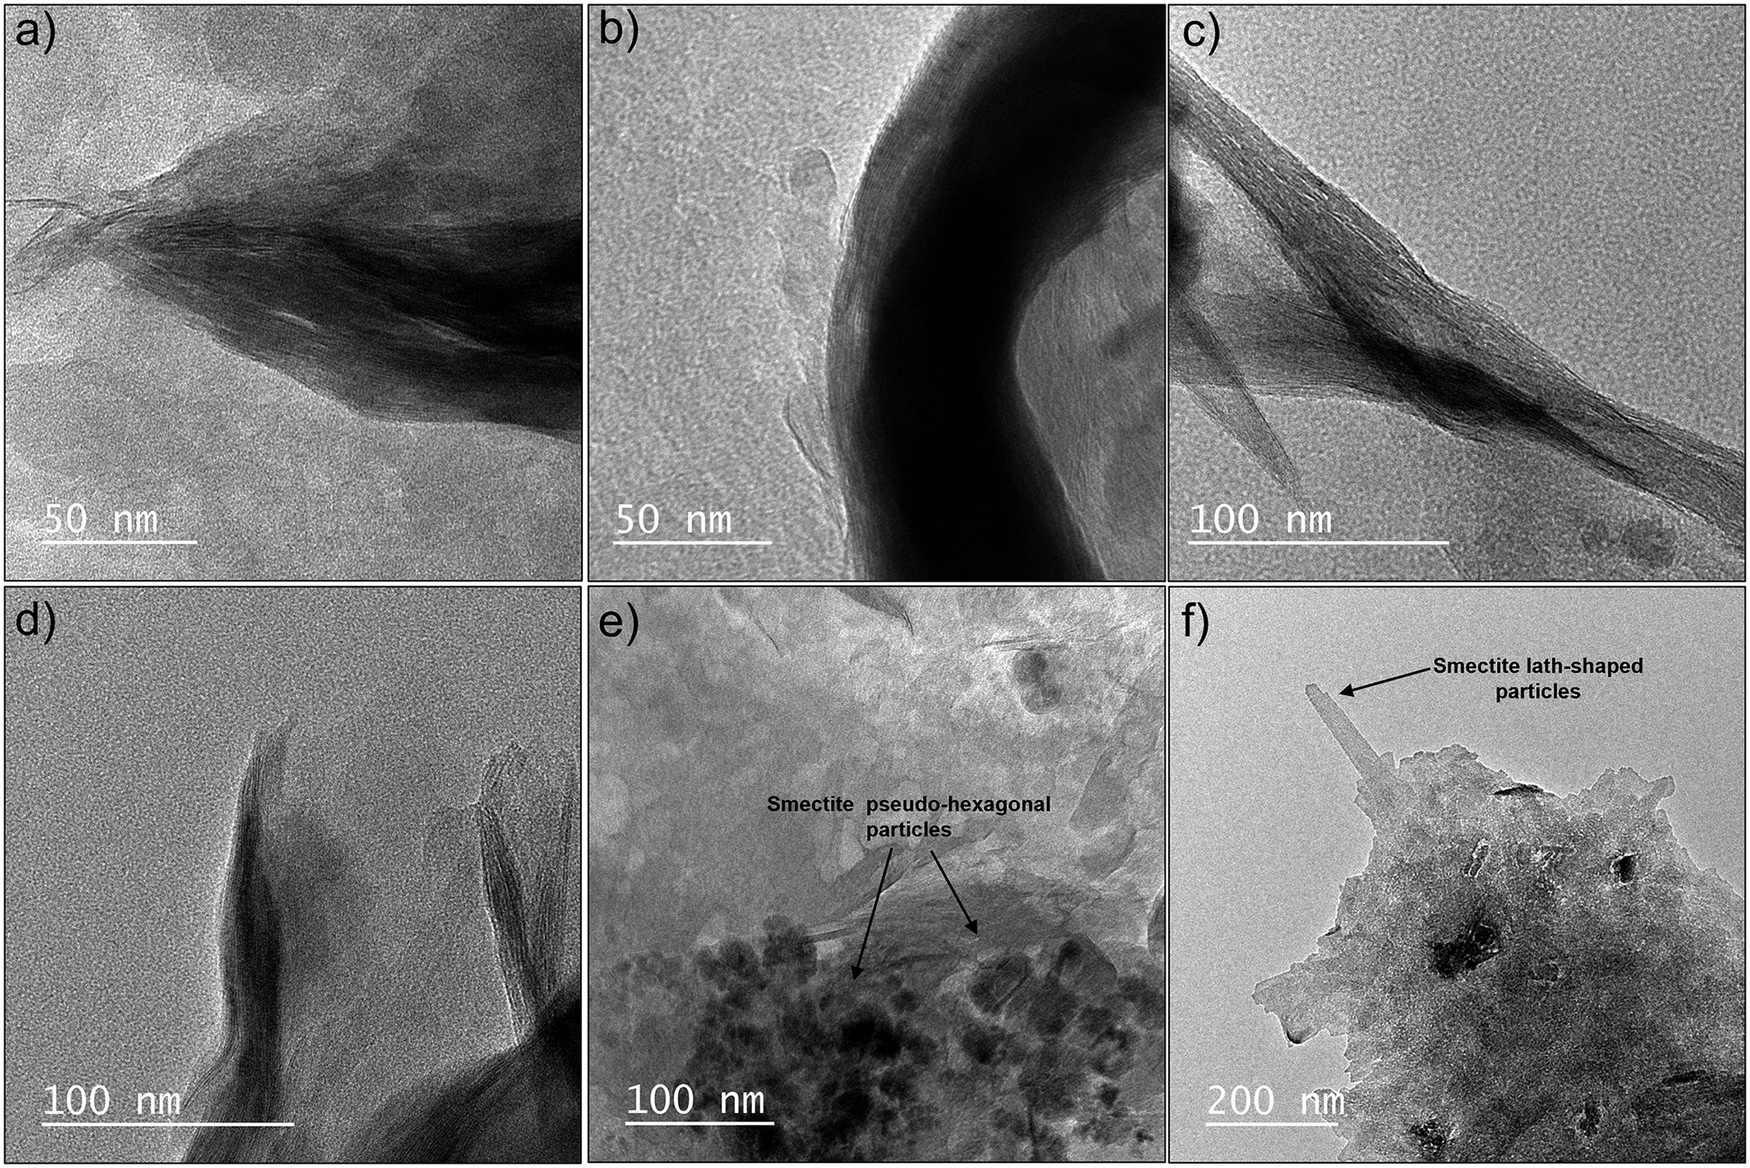
The TEM images of the four samples showed the typical tactoid morphology of smectites, characterized by long flexuous layers (Fig. 5a–d). In addition, small pseudo-hexagonal particles within larger aggregates of smectite were observed in all samples (Fig. 5e), whereas lath-shaped particles were also identified in Chocolate (Fig. 5f). Both morphologies are related to crystal growth, while the occurrence of very small hexagonal crystallites is consistent with nucleation on the surfaces of larger aggregates (e.g. Warr et al., Reference Warr, Thombare, Sudheer Kumar, Peltz, Podlech and Grathoff2024).
TEM images of the four smectites (<0.1 μm fractions) displaying tactoid (a–d), pseudohexagonal (e), and lath-shaped (f) morphologies. (a) Verde Lodo; (b) Bofe; (c,f) Chocolate; (d,e) Formosa.

Figure 5. Long description
A six-panel T E M micrograph display.
* Panel a. Verde Lodo smectite showing a dense tactoid morphology with a 50 nanometer scale bar.
* Panel b. Bofe smectite showing a curved, thick tactoid structure with a 50 nanometer scale bar.
* Panel c. Chocolate smectite showing elongated, fibrous tactoid bundles with a 100 nanometer scale bar.
* Panel d. Formosa smectite showing thin, layered tactoid edges with a 100 nanometer scale bar.
* Panel e. Formosa smectite showing pseudo-hexagonal particles. Three arrows point to thin, plate-like structures labeled Smectite pseudo-hexagonal particles. Includes a 100 nanometer scale bar.
* Panel f. Chocolate smectite showing a large aggregate with a protruding lath. An arrow points to the protrusion labeled Smectite lath-shaped particles. Includes a 200 nanometer scale bar.
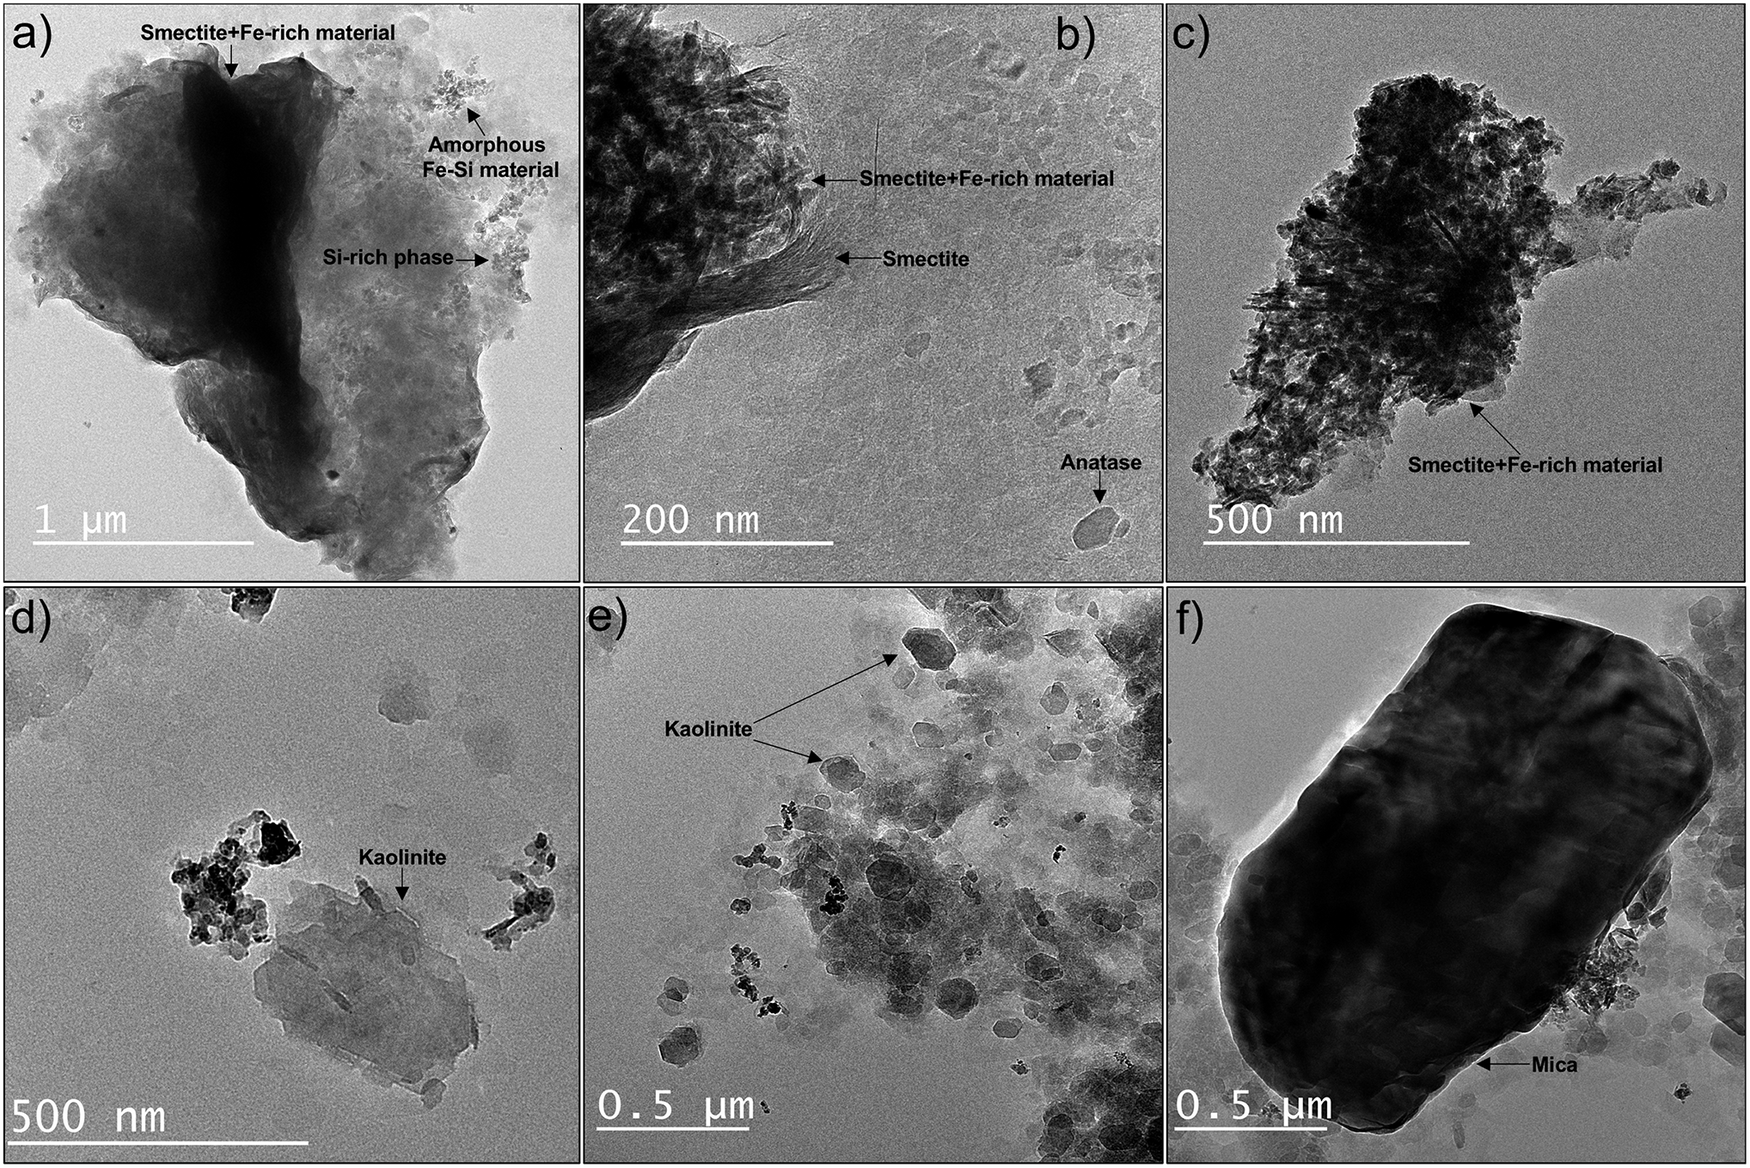
Small iron oxides and/or amorphous-like Fe-rich particles mixed intimately with smectite were also observed as fluffy aggregates without well-defined edges in all samples (Fig. 6a–c). Kaolinite was identified in all samples (Fig. 6d,e) except Chocolate, and was particularly abundant in Verde Lodo, as confirmed by XRD and FTIR. Kaolinite and smectite were distinguished by EDX analyses. Consistent with XRD, other admixtures were also observed, including mica in Verde Lodo (Fig. 6f) and a Si-rich phase in Bofe (Fig. 6a). Anatase was identified in both the Bofe and Verde Lodo samples.
TEM images of impurities in the <0.1 μm fractions. (a,b) Bofe, (c) Chocolate, (d) Formosa, (e,f) Verde Lodo. In panel (a), Si-rich particles were distinguished from Si-Fe particles by EDX analysis.

Figure 6. Long description
A six-panel T E M micrograph series labeled a through f.
* Panel a: A large dark cluster with a 1 micrometer scale bar. Arrows point to Smectite plus F e-rich material at the top, Amorphous F e-S i material at the top right, and a S i-rich phase on the right edge.
* Panel b: A high-magnification view with a 200 nanometer scale bar. Labels identify Smectite plus F e-rich material, a layered Smectite structure, and a small Anatase crystal at the bottom right.
* Panel c: A jagged dark mineral mass with a 500 nanometer scale bar. An arrow at the bottom points to Smectite plus F e-rich material.
* Panel d: Scattered hexagonal and irregular plates with a 500 nanometer scale bar. An arrow identifies a Kaolinite plate.
* Panel e: A cluster of small particles with a 0.5 micrometer scale bar. Two arrows point to distinct hexagonal Kaolinite crystals.
* Panel f: A large, dense, dark oval-shaped mineral grain with a 0.5 micrometer scale bar. An arrow at the bottom identifies it as Mica.
Cation exchange capacity
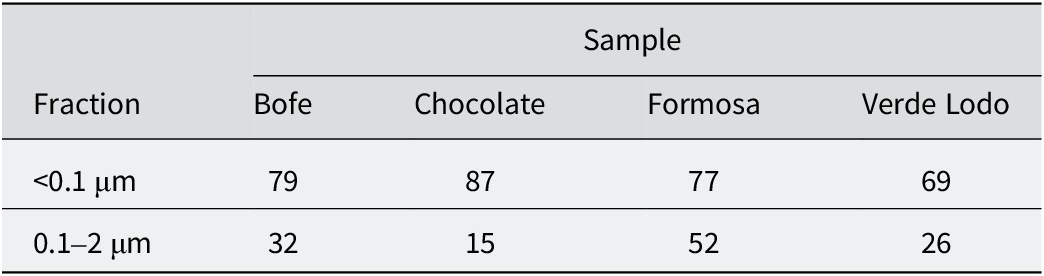
The CEC of samples ranged from 69 to 87 cmolc kg–1 (Table 3), indicating low-charge smectites (e.g. Amorim et al., Reference Amorim, Gomes, Lira, França and Ferreira2004; Emmerich et al., Reference Emmerich, Wolters, Kahr and Lagaly2009; Paz et al., Reference Paz, Angélica and Freitas Neves2012). The CEC variations are related to differences in the distribution of smectite among the size fractions analyzed, with larger CEC values linked with smectite-richer fractions (e.g. Righi et al., Reference Righi, Petit and Bouchet1993; Christidis, Reference Christidis2008; Wolters et al., Reference Wolters, Lagaly, Kahr, Nueesch and Emmerich2009).
Measured cation exchange capacity (CEC, cmolc kg–1)

Table 3. Long description
The table is organized with a header row identifying the four samples: Bofe, Chocolate, Formosa, and Verde Lodo. The rows are categorized by particle size fraction.
* The first data row for the fraction less than 0.1 micrometers shows C E C values of 79 for Bofe, 87 for Chocolate, 77 for Formosa, and 69 for Verde Lodo.
* The second data row for the fraction between 0.1 and 2 micrometers shows C E C values of 32 for Bofe, 15 for Chocolate, 52 for Formosa, and 26 for Verde Lodo.
The 0.1–2 μm fraction of the Formosa sample exhibited a large CEC value, in agreement with the smectite distribution observed by XRD (Fig. 1). Conversely, the 0.1–2 μm fraction of Chocolate showed the smallest CEC, whereas the <0.1 μm fraction exhibited the largest CEC, reflecting the exclusive presence of smectite in the finest fraction. Similarly, the low CEC values of the 0.1–2 μm fractions of the Bofe and Verde Lodo samples were attributed to their lower relative contribution of smectite.
Smectite properties
Layer-charge distribution
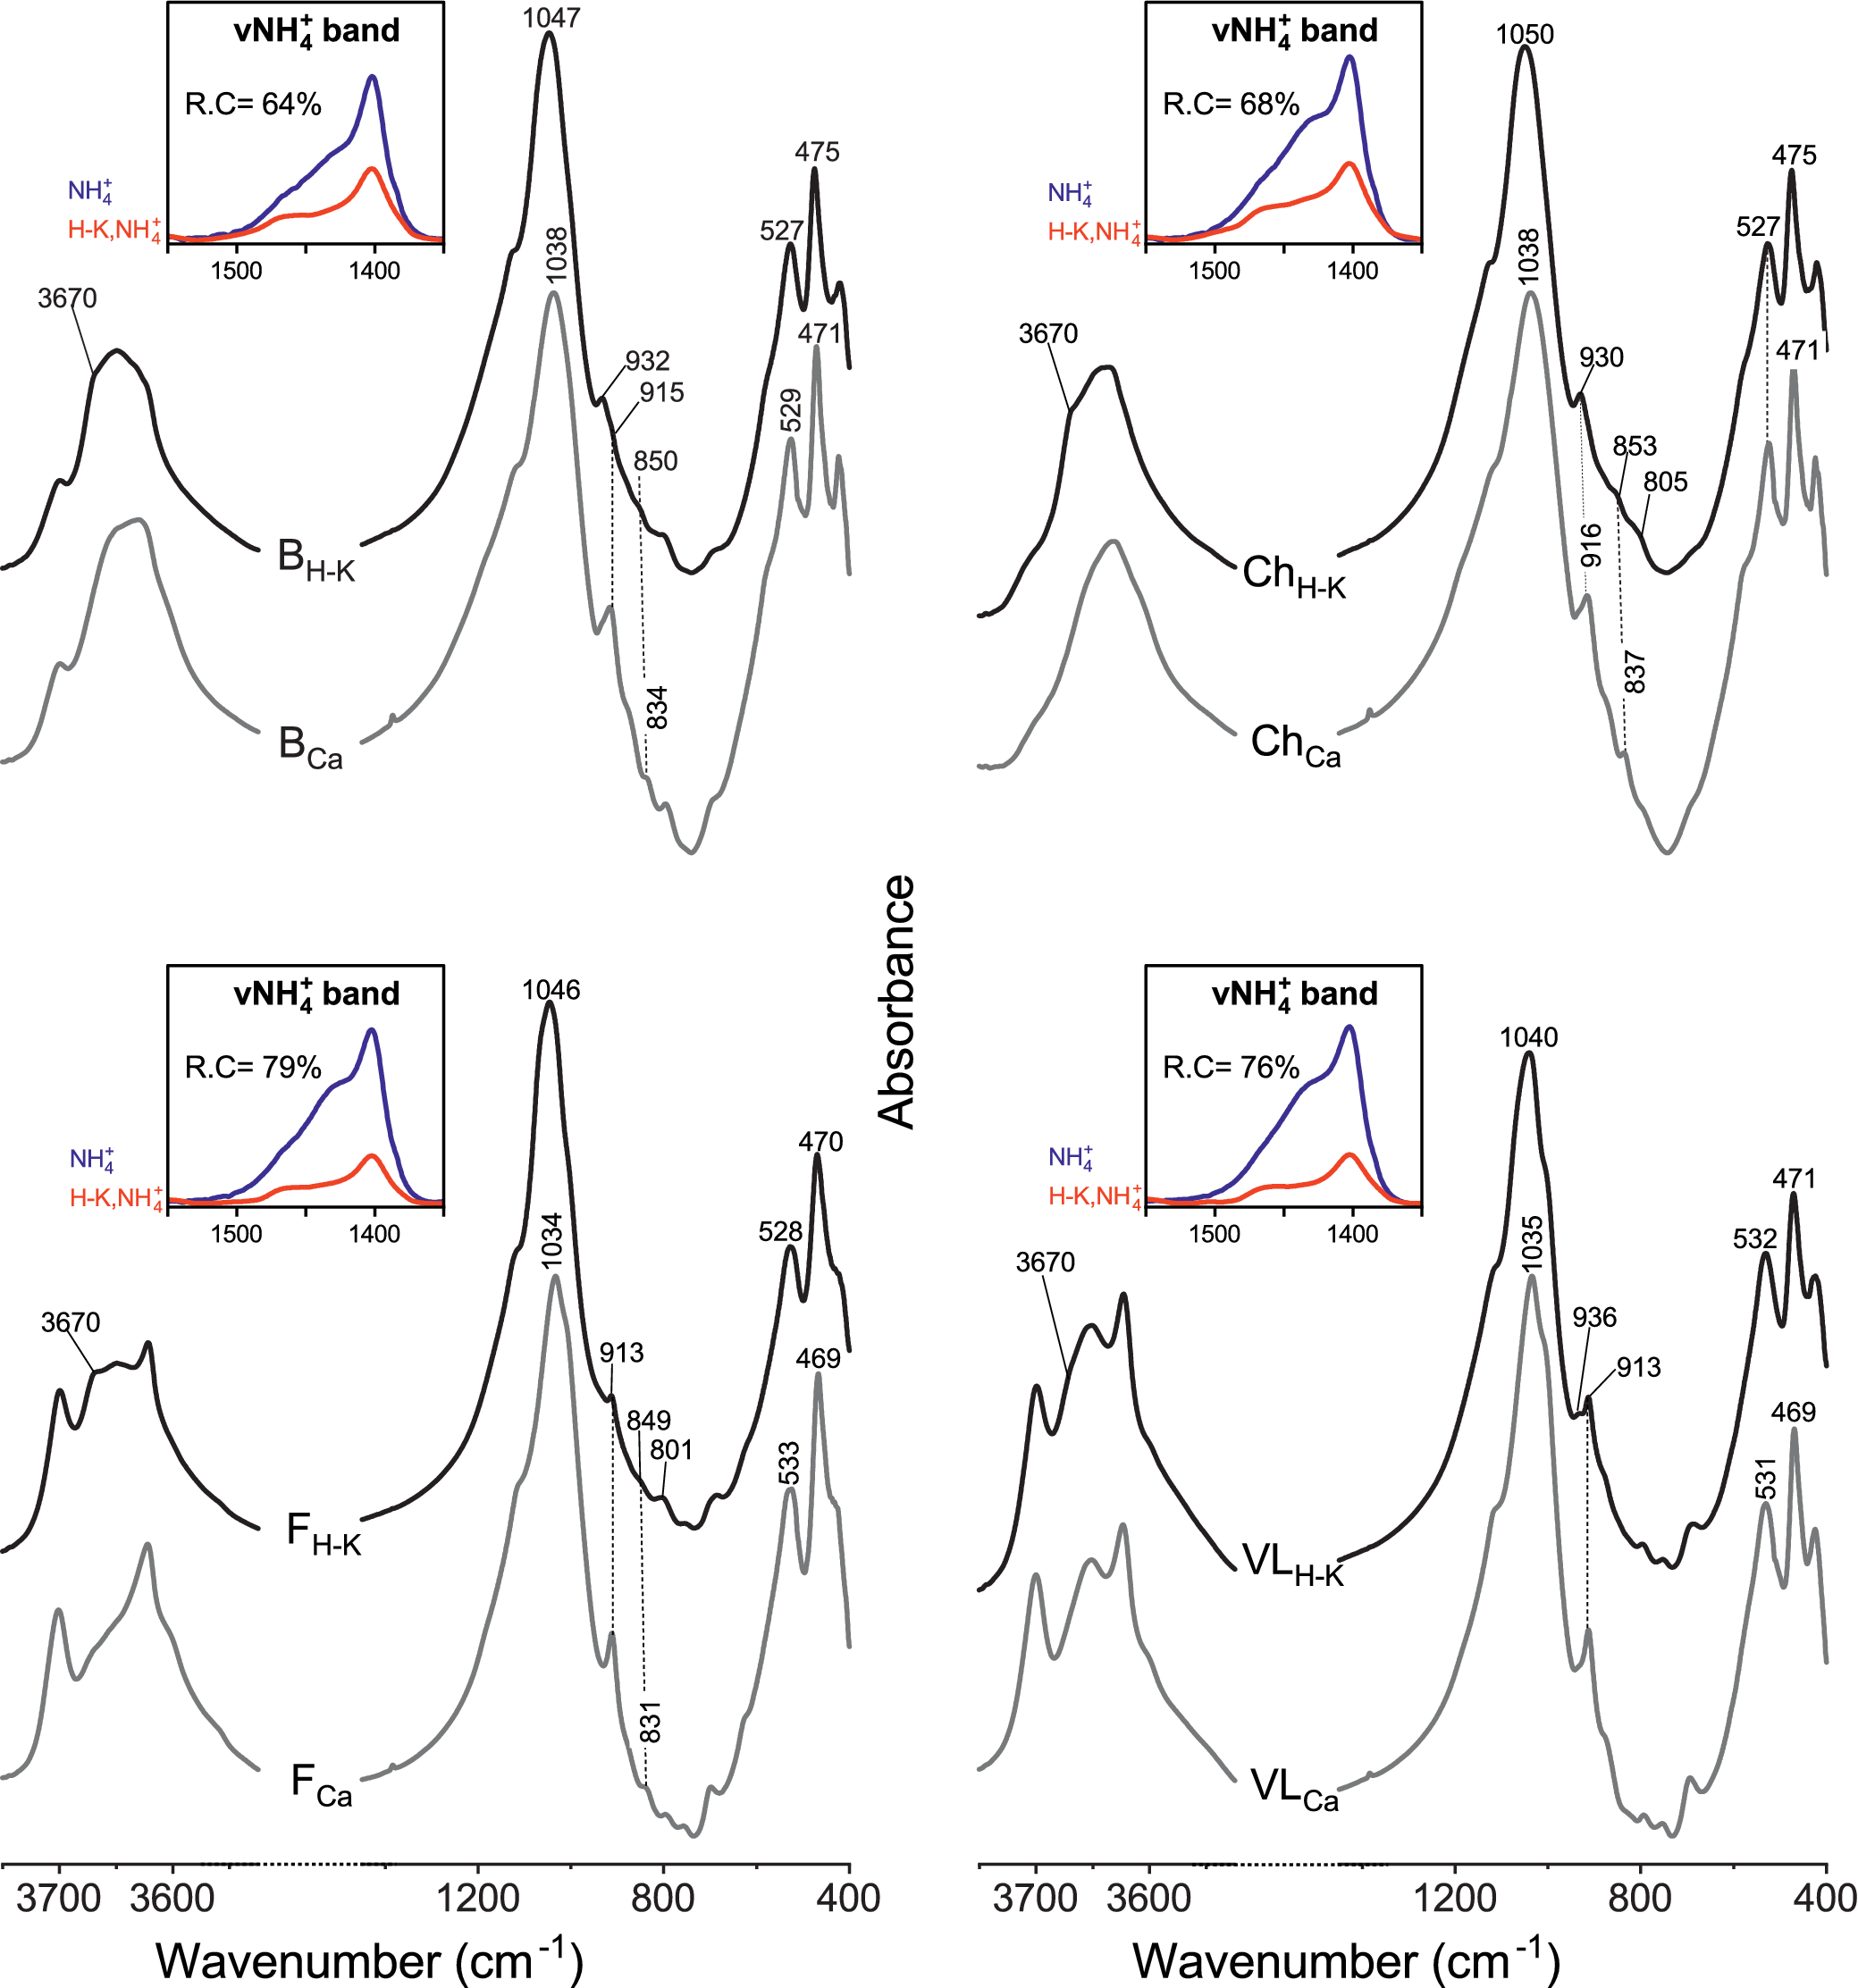
To determine the layer-charge distribution between octahedral and tetrahedral sheets, the H-K samples were investigated. The FTIR spectra revealed significant changes between the H-K and untreated Ca-samples (Fig. 7), attributed to the migration of Li+ into the formerly vacant octahedral sites in octahedrally charged smectites (i.e. montmorillonites), the so-called Greene-Kelly or Hofmann-Klemen effect (Hofmann and Klemen, Reference Hofmann and Klemen1950; Greene-Kelly, Reference Greene-Kelly1953).
FTIR-MIR spectra of the Ca-saturated samples (<0.1 μm fractions) before (gray) and after Hofmann-Klemen treatment (black). The νNH4+ deformation band (1400–1500 cm–1 region) before (blue) and after (red) Hofmann-Klemen treatment shows the percentage of reduced charge (R.C.). B = Bofe, Ch = Chocolate, F = Formosa, VL = Verde Lodo.

Figure 7. Long description
A multi-panel line graph with four quadrants labeled B, Ch, F, and V L. Each panel plots Absorbance on the y-axis against Wavenumber in inverse centimeters on the x-axis, ranging from 400 to 3700.
* Top-Left Panel (B): Shows two main spectral lines. The top black line is labeled B sub H-K and the bottom gray line is B sub Ca. Key peaks are noted at 3670, 1047, 1038, 932, 915, 850, 834, 527, 529, 475, and 471. An inset graph titled nu N H sub 4 super plus band shows a blue curve (N H sub 4 super plus) and a red curve (H-K, N H sub 4 super plus) with a reduced charge (R.C.) of 64 percent.
* Top-Right Panel (Ch): Features black line Ch sub H-K and gray line Ch sub Ca. Peaks are identified at 3670, 1050, 1038, 930, 916, 853, 837, 805, 527, 475, and 471. The inset shows an R.C. of 68 percent.
* Bottom-Left Panel (F): Features black line F sub H-K and gray line F sub Ca. Peaks are identified at 3670, 1046, 1034, 913, 849, 831, 801, 528, 533, 470, and 469. The inset shows an R.C. of 79 percent.
* Bottom-Right Panel (V L): Features black line V L sub H-K and gray line V L sub Ca. Peaks are identified at 3670, 1040, 1035, 936, 913, 532, 531, 471, and 469. The inset shows an R.C. of 76 percent.
In all panels, the Hofmann-Klemen treatment (black lines) shows higher absorbance peaks compared to the calcium-saturated samples (gray lines), particularly in the 1000 to 1100 wavenumber region.
For the more smectite-rich samples, Chocolate and Bofe, all the spectral changes after H-K treatment are mostly described in literature and are typical of montmorillonitic samples, i.e. smectites with predominant octahedral charge (e.g. Calvet and Prost, Reference Calvet and Prost1971; Madejová et al., Reference Madejová, Bujdák, Gates and Komadel1996; Petit et al., Reference Petit, Righi, Madejová and Decarreau1998; Madejová et al., Reference Madejová, Bujdák, Petit and Komadel2000; Petit et al., Reference Petit, Caillaud, Righi, Madejová, Elsass and Köster2002). The appearance of a shoulder at 3670 cm–1 was attributed to the νAlMgLiOH stretching band, issued from the local trioctahedral domains forming due to Li+ migration within the octahedral sheet of smectite. The appearance of this 3670 cm–1 band was observed in the four samples, indicating that all of the smectites possess an octahedral charge. According to the literature, the appearance of the 3670 cm–1 band after H-K treatment is accompanied by the shift of the main Si–O band from ~1035 to ~1050 cm–1, and of the bending bands δ(Al2OH) and δ(AlMgOH) from ~914 to ~930 cm–1 and from 836 to 850 cm–1, respectively. The δ(AlMgOH) band was not detected in Verde Lodo due to kaolinite overlap. In all samples except Chocolate, the remaining band at ~914 cm–1 after H-K treatment corresponded to kaolinite.
The percentage of charge reduction after H-K treatment was quantified following Petit et al. (Reference Petit, Righi, Madejová and Decarreau1998, Reference Petit, Righi, Madejová and Decarreau1999, Reference Petit, Righi and Madejová2006), using the integrated intensity of the νNH4+ bands at 1400–1440 cm–1 measured before and after H-K treatment. The νNH4+ bands were normalized to the main Si–O stretching band at 1020 cm–1. The results showed that the percentage charge reduction was 64–79% of the total charge (Fig. 7). Due to the significant kaolinite spectral contribution affecting spectral normalization, the results obtained for Verde Lodo and Formosa were far less robust compared with Chocolate, the smectite-richest sample. These results indicated that all smectites possess a dominant octahedral charge but also a significant amount of tetrahedral charge.
Swelling behavior
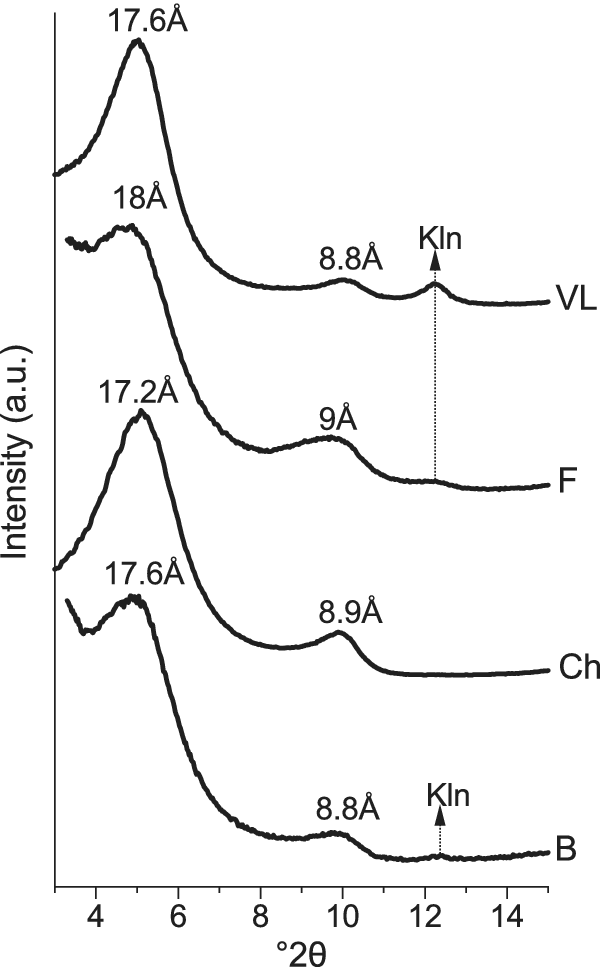
To relate the layer charge distribution to smectite reactivity, the swelling behavior after H-K treatment and EG solvation was analyzed by modeling the XRD patterns with the algorithms of Drits and co-workers (Sakharov and Drits, Reference Sakharov and Drits1973; Drits and Sakharov, Reference Drits, Sakharov and Nauka1976; Drits et al., Reference Drits, Środoń and Eberl1997; Sakharov et al., Reference Sakharov, Lindgreen, Salyn and Drits1999) (Fig. 8).
XRD oriented patterns of the <0.1 μm fractions after Hofmann-Klemen treatment (Li-saturated and heated to 300°C) and subsequent solvation with EG. B = Bofe, Ch = Chocolate, F = Formosa, VL = Verde Lodo, Kln = kaolinite.

Figure 8. Long description
A stacked line graph with Intensity in arbitrary units on the Y-axis and degrees 2-theta on the X-axis ranging from 4 to 14. Four patterns are stacked vertically.
* The top pattern labeled V L shows a prominent broad peak at 17.6 Angstroms, a smaller peak at 8.8 Angstroms, and a sharp minor peak labeled K l n at approximately 12.3 degrees 2-theta.
* The second pattern labeled F shows a broad peak at 18 Angstroms, a secondary peak at 9 Angstroms, and a flat region where a vertical dashed arrow points upward from the K l n position of the bottom pattern.
* The third pattern labeled C h shows a peak at 17.2 Angstroms and a secondary peak at 8.9 Angstroms.
* The bottom pattern labeled B shows a peak at 17.6 Angstroms, a secondary peak at 8.8 Angstroms, and a sharp minor peak labeled K l n at approximately 12.3 degrees 2-theta.
A vertical dashed arrow connects the K l n peaks of pattern B and V L, passing through patterns C h and F.
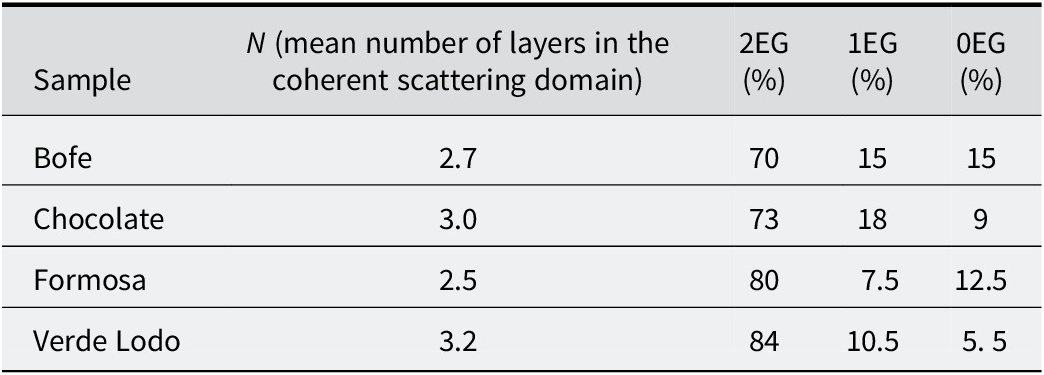
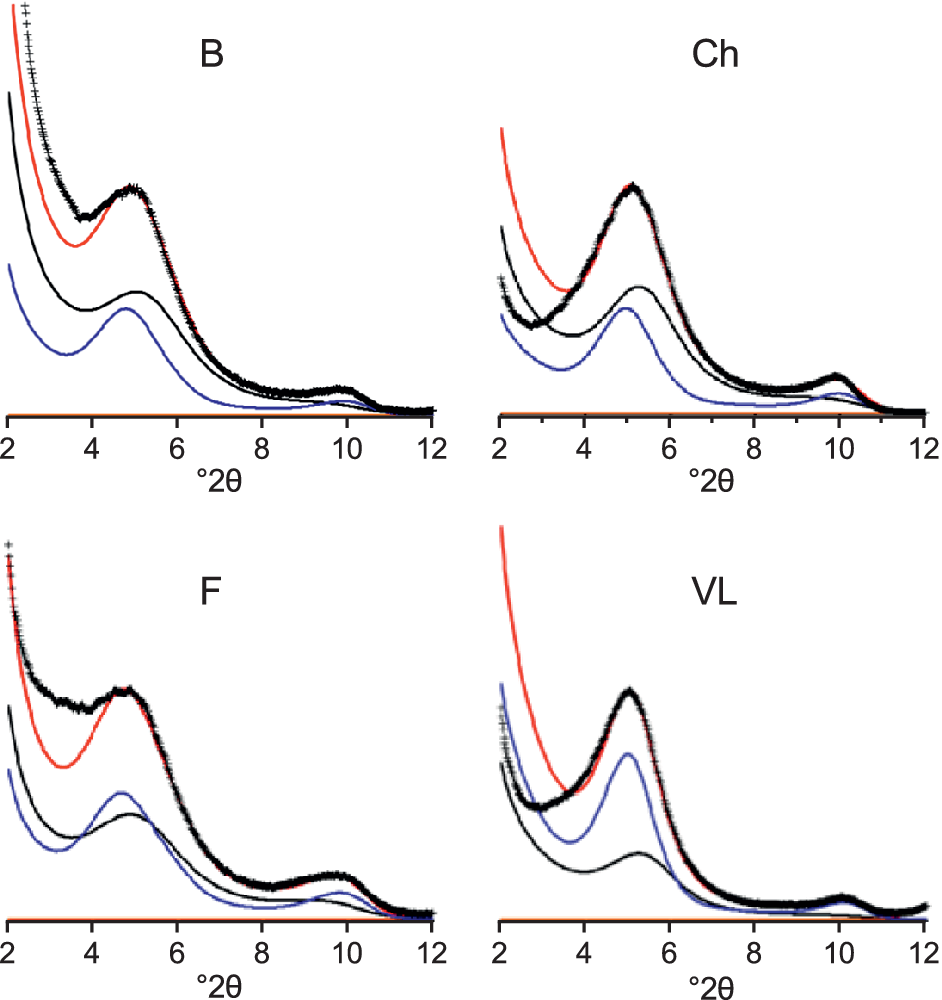
The optimal structural parameters used for modeling are listed in Table 4. All samples were modeled consistently in the same way using two contributions: (1) a smectite phase with 2EG interlayers; and (2) a randomly interstratified structure with 2EG-1EG-0EG interlayers (Fig. 9). These contributions revealed layers with slight variation in their charge distribution.
Overall proportion of layers used for the XRD profile fitting of the Hofmann-Klemen-treated samples after EG solvation

Table 4. Long description
The table consists of five columns: Sample, N (mean number of layers in the coherent scattering domain), 2 E G (percentage), 1 E G (percentage), and 0 E G (percentage).
* Row 1: Sample Bofe; N is 2.7; 2 E G is 70; 1 E G is 15; 0 E G is 15.
* Row 2: Sample Chocolate; N is 3.0; 2 E G is 73; 1 E G is 18; 0 E G is 9.
* Row 3: Sample Formosa; N is 2.5; 2 E G is 80; 1 E G is 7.5; 0 E G is 12.5.
* Row 4: Sample Verde Lodo; N is 3.2; 2 E G is 84; 1 E G is 10.5; 0 E G is 5.5.
XRD modeling of the swelling behavior of Hofmann-Klemen-treated samples after EG solvation. Blue lines: model of a pure smectite phase with 2EG layers; black lines: model of an interstratified structure with 2EG-1EG-0EG layers; red lines: fitted model. B = Bofe, Ch = Chocolate, F = Formosa, VL = Verde Lodo.

Figure 9. Long description
A multi-panel line graph with four quadrants labeled B, Ch, F, and V L. Each panel shares a horizontal x-axis representing degrees 2 theta ranging from 2 to 12. The y-axis represents intensity.
In each panel, three distinct curves and a set of data points are plotted:
- Data points are represented by black plus symbols forming a continuous experimental curve.
- A red line represents the fitted model, which closely follows the experimental data points.
- A blue line represents the model of a pure smectite phase with 2 E G layers, showing a primary peak around 5 degrees 2 theta and a smaller secondary peak near 10 degrees 2 theta.
- A black line represents the model of an interstratified structure with 2 E G-1 E G-0 E G layers, showing broader, lower-intensity peaks that shift slightly compared to the blue curve.
Panel-specific observations:
- Panel B (top-left): The experimental data shows a high-intensity peak at 5 degrees 2 theta. The red fitted model aligns closely with the experimental peak.
- Panel Ch (top-right): The primary peak at 5 degrees 2 theta is slightly broader than in panel B. The blue curve peak is more prominent than the black interstratified curve.
- Panel F (bottom-left): Shows a similar profile to B, with the red fitted model capturing the peak at 5 degrees and the smaller hump at 10 degrees 2 theta.
- Panel V L (bottom-right): The blue curve for the pure smectite phase is significantly higher in intensity relative to the black interstratified curve compared to the other panels, indicating a higher concentration of the 2 E G phase.
In all samples, 70–85% of the layers after H-K treatment were 2EG layers and the majority (85–95%) retained a sufficiently high charge to induce swelling in most of their layers (seen as the sum of 1EG and 2EG layers; Table 4). Only a small fraction (from 5% in Verde Lodo to 15% in Bofe) exhibited a remaining charge too small to allow swelling (i.e. 0EG; Table 4).
Assuming that the remaining charge after H-K treatment was tetrahedral, and considering that both the proportion of swollen layers (i.e. 2EG + 1EG; Table 4) and the average tetrahedral charge obtained from the structural formulae refined using FTIR results (Fig. 7; Table 5), the average tetrahedral charge required for layer re-expansion after H-K treatment in Chocolate and Bofe could be estimated at ~0.15 per half unit cell. In Verde Lodo and Formosa, the kaolinite admixture reduced the accuracy of this estimation, but it could be reasonably assumed that their smectite tetrahedral charge is in the same range.
Overall structural formulae of the smectites calculated from IR and TEM-EDX (per half unit cell)

Table 5. Long description
The table consists of nine columns and five rows.
Column headers from left to right are: Sample, I V S i 4 super plus, I V A l 3 super plus, V I A l 3 super plus, V I F e 3 super plus, V I M g 2 super plus, Layer charge, Octahedral charge, and Octahedral occupancy.
Data rows:
* Bofe: 3.88 S i, 0.12 A l (I V), 1.46 A l (V I), 0.32 F e, 0.22 M g, 0.34 layer charge, 0.22 octahedral charge, 2.00 occupancy.
* Chocolate: 3.85 S i, 0.15 A l (I V), 1.37 A l (V I), 0.32 F e, 0.31 M g, 0.46 layer charge, 0.31 octahedral charge, 2.00 occupancy.
* Formosa: 3.91 S i, 0.09 A l (I V), 1.42 A l (V I), 0.25 F e, 0.34 M g, 0.43 layer charge, 0.34 octahedral charge, 2.00 occupancy.
* Verde Lodo: 3.86 S i, 0.14 A l (I V), 1.38 A l (V I), 0.44 F e, 0.18 M g, 0.32 layer charge, 0.18 octahedral charge, 2.00 occupancy.
This ~0.15 value is rather low compared with the ~0.24 per half unit cell minimum charge generally reported in the literature to induce full layer swelling in smectites (Malla and Douglas, Reference Malla, Douglas, Schultz, van Olphen and Mumpton1987). However, some results obtained on synthetic Zn-smectites suggested that the lowest charge for a smectite to remain swellable is probably less than that generally accepted (Petit et al., Reference Petit, Righi and Decarreau2008). Moreover, small coherent domains induce broadening of basal reflections (Köster et al., Reference Köster, Ehrlicher, Gilg, Jordan and Murad1999), suggesting that particle size may also influence the swelling behavior of smectites: in smaller particles, the minimum charge required for swelling appears to be lower, which may account for the collapse to ~10 Å observed by Paz et al. (Reference Paz, Angélica and Freitas Neves2012) in the <2 μm fraction of Formosa after H-K treatment. These observations indicate that the very small particle size of the <0.1 μm fractions investigated here contributes to the unusually low tetrahedral charge (~0.15 per half unit cell) required for re-expansion after Hofmann-Klemen treatment, suggesting that the charge threshold for smectite swelling may not be controlled solely by layer charge.
The results indicate a relatively homogeneous distribution of tetrahedral charge across all particles within each sample. Therefore, most of the particles are made up of layers having enough tetrahedral charge (>0.15) to expand after H-K treatment, while some contain layers with charge that do not reach the threshold required for swelling. Moreover, the proportion of swollen particles shows a positive relationship with the average tetrahedral charge of the samples (Tables 4 and 5). Thus, all H-K samples are mixed-layer smectites, consisting of swelling layers with tetrahedral charges >0.15 interstratified with non-swelling layers with tetrahedral charges <0.15.
Chemical composition of smectites
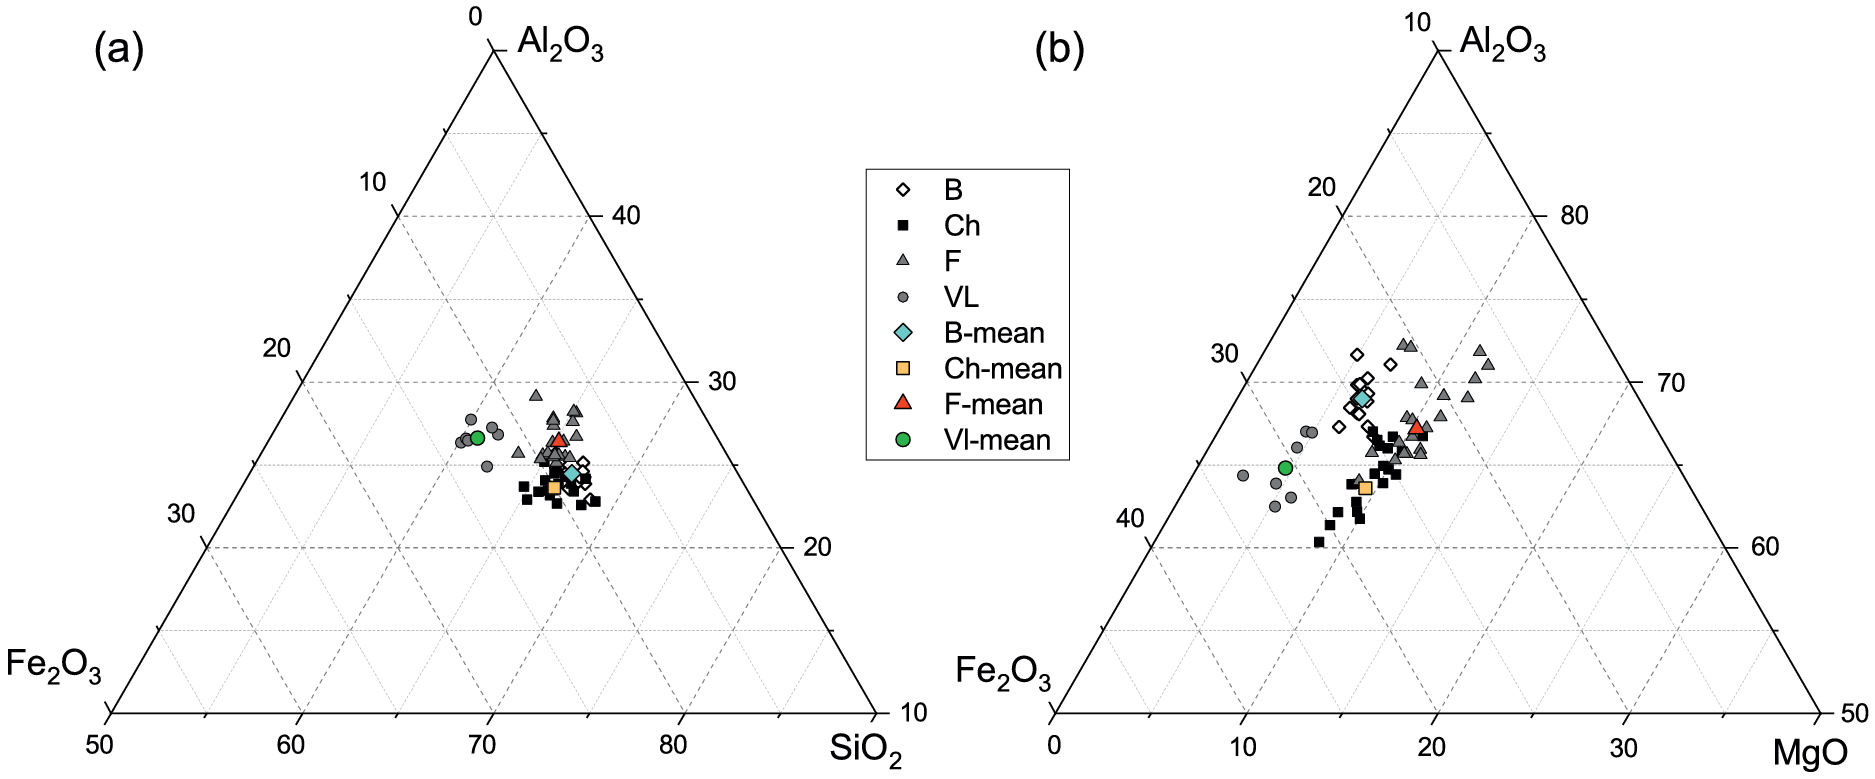
TEM-EDX analyses of Ca-saturated smectite particles, plotted in ternary diagrams, revealed slight variations in the ratios of the main cations SiO2/Fe2O3/Al2O3 among particles within each sample (Fig. 10a). The MgO/Fe2O3/Al2O3 ternary diagram (Fig. 10b) showed relatively consistent Mg content across all particles within each smectite. In contrast, Fe and Al contents showed notable variability, which could be related to the observations of aggregates of smectite plus Fe oxides (Fig. 6a–c).
Chemical composition of the Ca-saturated smectites (<0.1 μm fractions) determined by TEM-EDX microanalysis. B = Bofe, Ch = Chocolate, F = Formosa, VL = Verde Lodo.

Figure 10. Long description
A two-panel figure labeled a and b. A central legend identifies four samples: B (white diamonds), Ch (black squares), F (grey triangles), and V L (grey circles), along with their respective mean values in colored symbols.
Panel a is a ternary plot of Al sub 2 O sub 3 at the top vertex, Fe sub 2 O sub 3 at the bottom-left, and S i O sub 2 at the bottom-right. The data points are clustered in the center-right region, indicating high S i O sub 2 content (between 70 and 80 percent). Sample V L is slightly more enriched in Fe sub 2 O sub 3 compared to the others.
Panel b is a ternary plot of Al sub 2 O sub 3 at the top vertex, Fe sub 2 O sub 3 at the bottom-left, and M g O at the bottom-right. The data points are distributed along a diagonal trend from the center toward the Fe sub 2 O sub 3 vertex. M g O values are relatively low, concentrated between 10 and 30 percent. Sample F shows the highest Al sub 2 O sub 3 content, while sample Ch is more enriched in Fe sub 2 O sub 3.
Representative structural formulae (SF) of the smectites were calculated based on 22 negative charges. The Fe measured by TEM-EDX was assumed as Fe3+ according to FTIR results, although minor contributions from non-structural Fe cannot be excluded. Mg2+ was assigned entirely to the octahedral sheet, assuming complete removal of interlayer Mg2+ during the Ca-homo-ionization process. The tetrahedral Al content was estimated from the layer charge distribution derived from FTIR data after the H-K treatment (Fig. 7). The octahedral occupancy was constrained to 2.0 per half unit cell, as no local trioctahedral domains could be observed by FTIR. The octahedral Al and Fe3+ were then adjusted to meet these constraints, in agreement with the relative intensities of the OH bending bands observed in the samples (Table 5).
The structural formulae of the four smectites were relatively similar. All smectites exhibited tetrahedral Al3+ (~0.1 per half unit cell) and a dominant octahedral charge. Al3+ was the dominant octahedral cation, with minor substitutions of Fe3+ and Mg2+, the latter being exclusively responsible for the octahedral layer charge. The layer charge was rather low, ranging from 0.32 (Verde Lodo) to 0.46 (Chocolate).
The structural formulae, constrained using the FTIR-derived layer-charge distribution, are consistent with the relative intensities of the OH-bending bands, as Fe3+ substitutions were generally higher than Mg2+, except in the Formosa smectite, where the increased intensity of the δ(AlMgOH) band at ~836 cm–1 (Fig. 4b) reflects its greater Mg2+ substitution and, consequently, the highest octahedral charge among the samples. However, Formosa also exhibited the lowest tetrahedral charge, resulting in a layer charge within the same range as the others. In Verde Lodo, the Mg content was probably over-estimated due to the weaker δ(AlMgOH) band, whereas its higher octahedral Fe3+ aligned with the increased δ(AlFe3+OH) band at 873 cm–1.
Conclusions
The fine clay fraction (<0.1 μm) of four bentonites was used to determine the crystal chemistry of their smectites. The four smectites are Al-rich dioctahedral with both tetrahedral and octahedral charge, the latter predominating but with a significant tetrahedral contribution. The integrated analysis of layer-charge distribution, swelling behavior and chemical composition indicates that a tetrahedral charge of ~0.15 per half unit cell is sufficient to induce layer re-expansion after Hofmann-Klemen treatment and EG solvation, notably lower than the ~0.24 value commonly reported. These findings refine the understanding of the relationship between tetrahedral charge and swelling behavior in natural smectites. Overall, the close crystal-chemical and swelling similarities between the Formosa smectite and those from the Boa Vista region (Bofe, Chocolate and Verde Lodo) suggest that the Formosa deposit may represent a potential alternative source to the bentonites from this region.
Data availability statement
The datasets generated during and/or analyzed during the current study are available from the corresponding author on reasonable request.
Author contributions
David Porras: Writing - original draft, Visualization, Methodology, Investigation, Formal analysis, Conceptualization; Brian Gregoire: Writing - original draft, Methodology, Investigation, Formal analysis, Conceptualization, Validation, Supervision, Funding acquisition, Project administration; Sabine Petit: Writing - original draft, Methodology, Investigation, Formal analysis, Conceptualization, Validation, Supervision, Funding acquisition, Project administration; Eric Ferrage: Writing - review & editing, Visualization, Formal analysis, Validation; Olivier Grauby: Writing - review & editing, Investigation, Validation, Formal analysis; Simone Paz: Writing - review & editing, Conceptualization, Supervision, Funding acquisition, Project administration.
Acknowledgments
The authors thank the Brazilian agencies Coordenação de Aperfeiçoamento de Pessoal de Nível Superior (CAPES) and Conselho Nacional de Desenvolvimento Científico e Tecnológico (CNPq) for providing PhD scholarship support to the first author.
Financial support
This study was funded by the Coordenação de Aperfeiçoamento de Pessoal de Nível Superior (CAPES), the Conselho Nacional de Desenvolvimento Científico e Tecnológico (CNPq) (chamada CNPq No. 26/2021, 201087/2022-7), the French government program Investissements d’Avenir (EUR INTREE, reference ANR-18-EURE-0010), the European Union (ERDF), and the Région Nouvelle Aquitaine.
Competing interests
The authors declare none.
AI usage statement
The authors declare that an AI-based language model (ChatGPT, OpenAI; version GPT-5.2, accessed in December 2025) was used to check the English grammar and improve the stylistic quality of the manuscript.