Introduction
Mediterranean coastal marine ecosystems have been severely altered over the centuries by a wide array of local direct (e.g. fishing, pollution, coastal developments, land reclamations) and diffuse large-scale impacts (e.g. climate change and the arrival of non-indigenous species) (Bevilacqua et al., Reference Bevilacqua, Airoldi, Ballesteros, Benedetti-Cecchi, Boero, Bulleri, Cebrian, Cerrano, Claudet, Colloca, Coppari, Di Franco, Fraschetti, Garrabou, Guarnieri, Guerranti, Guidetti, Halpern, Katsanevakis, Mangano, Micheli, Milazzo, Pusceddu, Renzi, Rilov, Sarà and Terlizzi2021; Coll et al., Reference Coll, Piroddi, Steenbeek, Kaschner, Ben Rais Lasram, Aguzzi, Ballesteros, Bianchi, Corbera, Dailianis, Danovaro, Estrada, Froglia, Galil, Gasol, Gertwagen, Gil, Guilhaumon, Kesner-Reyes, Kitsos, Koukouras, Lampadariou, Laxamana, López-fé de la Cuadra, Lotze, Martin, Mouillot, Oro, Raicevich, Rius-Barile, Saiz-Salinas, Vicente, Somot, Templado, Turon, Vafidis, Villanueva and Voultsiadou2010; Micheli et al., Reference Micheli, Halpern, Walbridge, Ciriaco, Ferretti, Fraschetti, Lewison, Nykjaer and Rosenberg2013). Fishing, in particular, has historically depleted target species (FAO, 2022; Guidetti and Micheli Reference Guidetti and Micheli2011), deeply changed community structure and altered food webs (Sala, Reference Sala2004; Sala et al., Reference Sala, Ballesteros, Dendrinos, Di Franco, Ferretti, Foley, Fraschetti, Friedlander, Garrabou, Güçlüsoy, Guidetti, Halpern, Hereu, Karamanlidis, Kizilkaya, Macpherson, Mangialajo, Mariani, Micheli, Pais, Riser, Rosenberg, Sales, Selkoe, Starr, Tomas and Zabala2012). By selectively removing high-level predators (often represented by fish species) (Ferretti et al., Reference Ferretti, Myers, Serena and Lotze2008; Guidetti Reference Guidetti2006; Pauly et al., Reference Pauly, Christensen, Dalsgaard, Froese and Torres1998), fishing ultimately affects biodiversity, food webs (e.g. causing trophic cascades; Sala et al., Reference Sala, Boudouresque and Harmelin-Vivien1998) and the functioning of ecosystems impairing their ability to provide essential services to society (Cardinale et al., Reference Cardinale, Duffy, Gonzalez, Hooper, Perrings, Venail, Narwani, Mace, Tilman, Wardle, Kinzig, Daily, Loreau, Grace, Larigauderie, Srivastava and Naeem2012; Liquete et al., Reference Liquete, Cid, Lanzanova, Grizzetti and Reynaud2016; Sala et al., Reference Sala, Mayorga, Bradley, Cabral, Atwood, Auber, Cheung, Costello, Ferretti, Friedlander, Gaines, Garilao, Goodell, Halpern, Hinson, Kaschner, Kesner-Reyes, Leprieur, McGowan, Morgan, Mouillot, Palacios-Abrantes, Possingham, Rechberger, Worm and Lubchenco2021). In such a scenario, the food webs and community structures we currently assess in many Mediterranean coastal areas are merely a ghost (i.e. a distorted representation) of the pristine ones that existed in the past (Dayton et al., Reference Dayton, Tegner, Edwards and Riser1998; Sala, Reference Sala2004).
Possible solutions to mitigate or reverse the detrimental effects of fishing on marine ecosystems include the use of spatially-explicit management tools such as the marine protected areas (hereinafter MPAs). MPAs are places in the ocean that receive protection to safeguard biodiversity from anthropogenic abatable threats (Grorud-Colvert et al., Reference Grorud-Colvert, Sullivan-Stack, Roberts, Constant, Horta, Costa, Pike, Kingston, Laffoley, Sala, Claudet, Friedlander, Gill, Lester, Day, Gonçalves, Ahmadia, Rand, Villagomez, Ban, Gurney, Spalding, Bennett, Briggs, Morgan, Moffitt, Deguignet, Pikitch, Darling, Jessen, Hameed, Di Carlo, Guidetti, Harris, Torre, Kizilkaya, Agardy, Cury, Shah, Sack, Cao, Fernandez and Lubchenco2021). Within well-designed, well-managed and properly enforced MPAs, fishing can be effectively restricted or banned. More specifically, MPAs can be Fully Protected (FP, aka ‘no-take’, where fishing, as any other extractive or destructive activity, is prohibited), Partially Protected (PP, aka ‘buffer zones’, where fishing is restricted compared to adjacent fished areas outside MPA borders), or a combination of FP and PP areas (i.e. multiple-use MPAs) (PISCO, 2016). The latter is the case of most Mediterranean MPAs, which usually have one or more FP areas surrounded by PP areas (PISCO, 2016).
Within effectively managed and well-enforced FP Mediterranean MPAs, population density, size and biomass of target species (chiefly high-level fish predators) significantly increase (Giakoumi et al., Reference Giakoumi, Scianna, Plass-Johnson, Micheli, Grorud-Colvert, Thiriet, Claudet, Di Carlo, Di Franco, Gaines, García-Charton, Lubchenco, Reimer, Sala and Guidetti2017), triggering the recovery of entire communities and food webs (Claudet, Reference Claudet2011; Prato et al., Reference Prato, Guidetti, Bartolini, Mangialajo and Francour2013). Conversely, the effects of PP areas within MPAs were found to be variable and sometimes more uncertain compared to FP areas, as a consequence of the specific type of protection, the design of each individual multi-use MPA and the enforcement level (Giakoumi et al., Reference Giakoumi, Scianna, Plass-Johnson, Micheli, Grorud-Colvert, Thiriet, Claudet, Di Carlo, Di Franco, Gaines, García-Charton, Lubchenco, Reimer, Sala and Guidetti2017; Turnbull et al., Reference Turnbull, Johnston and Clark2021; Zupan et al., Reference Zupan, Fragkopoulou, Claudet, Erzini, Horta E Costa and Gonçalves2018). In the light of the above, effective MPAs (and especially FP-MPAs) have the potential to offer us an ideal opportunity to investigate fish assemblages, and also entire communities, food webs and whole ecosystems, in healthier conditions. Evidence from MPAs is so crucial to develop and set management strategies and conservation priorities outside MPAs too. This is particularly true and valuable in highly urbanised sectors of the coastal Mediterranean Sea, such as the Ligurian Sea (NW Mediterranean). Here, multiple types of coastal infrastructures are diffusely present (e.g. urban structures, resorts, breakwaters, industrial installations, harbours, and marinas; Smiraglia et al., Reference Smiraglia, Cavalli, Giuliani and Assennato2023), boating and shipping activities (involving small-scale fishing vessels, recreational boats, yachts of varying sizes, ferries, cargo ships and cruise vessels; Micheli et al., Reference Micheli, Halpern, Walbridge, Ciriaco, Ferretti, Fraschetti, Lewison, Nykjaer and Rosenberg2013) are widespread and frequent, along with many other human activities, making the Mediterranean as a whole the most intensively visited tourist destination worldwide (https://www.medqsr.org/tourism). In the Ligurian Sea, specifically, there are three national MPAs (embedding FP areas), along with two regional MPAs (only including PP areas), a number of Natura 2000 zones with seaward extension (see details at: https://www.mase.gov.it/portale/rete-natura-2000), all within the International Pelagos Sanctuary (see details at: https://pelagos-sanctuary.org/it/; Guidetti et al., Reference Guidetti, Notarbartolo-Di-Sciara and Agardy2013).
In this study, we assessed and compared fish assemblages associated with shallow rocky reefs at three national MPAs located 40–50 km apart and in adjacent control areas in the Ligurian Sea. Similar MPAs’ studies that take into account representative spatial scales of hundred kilometres are uncommon and may provide evidence of general outputs or peculiarities that single MPA studies are not likely to account for. We more specifically compared fish assemblages (i.e. whole assemblage structures and trophic groups), and significant univariate variables (such as total fish biomass and biomass of high-level predators) at sites distributed across a protection gradient. This gradient was represented by FP areas (where any fishing activity is prohibited), PP areas (where limited fishing activities are allowed, but regulated), and areas outside the three investigated MPAs, where human activities (including fishing) are permitted according to less restrictive national laws.
Considering the unprecedented effects that human impacts (e.g. climate change, pollution, and overexploitation of marine resources) are producing on the ocean, world leaders agreed, in the frame of the Kunming-Montreal Global Biodiversity Framework (GBF), that at least 30% of the ocean must be effectively conserved and managed through ecologically representative, well connected, and equitably governed systems, by 2030 (the so-called ‘30×30 target’).
The outputs of such a study, from this perspective, may have a direct implication for the assessment of the effectiveness of each individual MPA, but also for evaluating the regional MPA network, and the potential of the MPAs studied here to contribute, at national and EU scales, to the ‘30×30 target’.
Materials and methods
Study areas
The present research was conducted in three enforced marine protected areas (MPAs) and adjacent unprotected areas, all located in the Ligurian Sea (NW Mediterranean Sea, Italy), a well-known region where touristic and fishing activities (both professional and recreational) are very intense, especially in summer. The three study areas include the Bergeggi Island, Portofino, and Cinque Terre MPAs (established in 2007, 1998, and 1997, respectively). In accordance with Italian law, each MPA includes three types of zones (named A, B, and C) corresponding to different levels of protection (Figure 1). Zone A provides the highest level of protection as a FP area (no extractive/destructive activities are allowed, with all types of fishing being forbidden). Zones B and C are PP areas, with lower but still regulated levels of protection. Zone B allows for regulated local small-scale fishing activities, while recreational fishing can be performed only by authorised local (i.e. officially resident) people with restrictions in terms of types of gears. Zone C has laxer restrictions than Zone B: small-scale fishing is allowed, and recreational fishing can be authorised for local and non-local people, with restrictions for these latter. Outside the three MPAs, fishing activities take place according to the even laxer national laws. The protection gradient thus decreases sequentially from Zone A (that can be considered as the best available baseline) to the zones outside the MPAs.
Map of the study areas: (a) Bergeggi Island MPA; (b) Portofino MPA; (c) Cinque Terre MPA. Zone A: fully protected (FP, no-take); Zones B and C: partially protected (PP).

General features of the benthic habitat
Benthic cover, grazers (like sea urchins) and fish assemblages are subject to multiple environmental and anthropogenic factors, so they may show extremely variable patterns in space and time, in addition to reciprocally influencing each other (E. Di Franco et al., Reference Di Franco, Di Franco, Calò, Di Lorenzo, Mangialajo, Bussotti, Bianchi and Guidetti2021; Guidetti and Sala, Reference Guidetti and Sala2007). The three sampling areas have been descriptively characterised in terms of benthic cover and sea urchin density. Benthic cover (expressed as % cover) of the following macro-categories, i.e. (i) barren (i.e. bare rocks/encrusting algae), (ii) erect macroalgae (including massive and arborescent algae, and turf), and (iii) sessile macrozoobenthos (e.g. sponges), was assessed by means of 0.25 m2 quadrats photographed using a digital video camera (GOPRO HERO 11) at a standard distance of 1 m from the bottom between 5 and 8 m depth, for a total of 240 images (80 from each of the three MPAs) across study areas. Density data of sea urchins Arbacia lixula and Paracentrotus lividus (then expressed as number of individuals/1 m2) have been collected by means of 0.25 m2 quadrats randomly placed on the rocky bottom between 5 and 8 m depth, for a total of 240 replicates across the three study areas. Benthic cover and sea urchin data were gathered only within the 5–8 m depth range, so that they have been solely used to provide a general description of the distribution patterns and variability at the studied spatial scale.
Fish data collection
Fish assemblages at the three MPAs were characterised by means of underwater visual census surveys (UVCs) performed by five SCUBA divers well-trained in UVCs. At each MPA, UVCs were done at two locations per protection level (Zones A, B, C and unprotected surrounding areas denoted by E, external to the MPA). Locations were selected to be as comparable as possible in terms of habitat type, slope, and rugosity. Sampling was conducted between May and September 2023, the ‘warm’ season in the area. All UVCs were conducted during daytime, between 09:00 and 17:00 Central European Summer Time (CEST, i.e. UTC + 2 h).
Standard 25 × 5 m2 strip transects (Harmelin-Vivien et al., Reference Harmelin-Vivien, Harmelin, Chauvet, Mellon-Duval, Galzin, Lejeune, Barnabé, Blanc, Chevalier, Duclerc and Lasserre1985; Murphy and Jenkins, Reference Murphy and Jenkins2010) were randomly performed (each by a single diver to avoid data dependence) at each location on homogeneous rocky bottoms (made up by at least 80% of rocky substrate), both within and around UVC transect surfaces. At the Cinque Terre MPA, 32 replicates (transects) were performed at each location between 5 and 18 m depth (totalling 256 replicates). For the Portofino MPA, just one location outside the MPA was identified which covered the 5–18 m depth range. So, 32 replicates were performed at 7 locations, and 24 at one external location where deeper stands were missing (totalling 248 replicates). At the Bergeggi Island MPA, UVCs were only performed in the depth range 5–8 m due to the lack of comparable rocky reefs within and outside the MPA at deeper stands, with 8 replicates performed per location (totalling 64 replicates).
Within each transect, the species, number and size of censused fish individuals were recorded. Individuals belonging to the family Mugilidae were visually identified at the family level. Fish length (total length, TL) was estimated and recorded using 2 cm size classes for most fish species, while 5 cm size classes were used for species attaining larger maximum sizes (see A. Di Franco et al., Reference Di Franco, Bussotti, Navone, Panzalis and Guidetti2009 for details).
Data treatment and analysis
Fish data were organised into a ‘species × sample (UVC transect)’ matrix per study area (each including an MPA). Fish biomass was used as a response variable, since it integrates both fish abundance (density) and individual size (Giakoumi et al., Reference Giakoumi, Scianna, Plass-Johnson, Micheli, Grorud-Colvert, Thiriet, Claudet, Di Carlo, Di Franco, Gaines, García-Charton, Lubchenco, Reimer, Sala and Guidetti2017; Guidetti et al., Reference Guidetti, Baiata, Ballesteros, Di Franco, Hereu, Macpherson, Micheli, Pais, Panzalis, Rosenberg, Zabala and Sala2014). Fish biomass (i.e. wet weight, g) per transect was computed, from the estimated fish abundance and size, using the length-weight relationships available in the literature for the censused species (Froese and Pauly, Reference Froese and Pauly2023). Correlation coefficients relating to relationships established on samples collected in the Mediterranean were selected whenever possible.
We first tested differences in fish assemblages associated with sublittoral rocky reefs across levels of protection (i.e. MPA zones) and sampling locations per MPA, analysing fish assemblages as a whole. Then, we tested differences in the trophic structure of fish assemblages by pooling fish taxa into functional/trophic groups. Each species/family was assigned to one of five following trophic groups according to the available Mediterranean literature (Guidetti et al., Reference Guidetti, Baiata, Ballesteros, Di Franco, Hereu, Macpherson, Micheli, Pais, Panzalis, Rosenberg, Zabala and Sala2014) and the database FishBase (Froese and Pauly, Reference Froese and Pauly2023): (1) high-level predators (HP), (2) carnivores (CA), (3) planktivores (PL), (4) herbivores (HE), and (5) detritivores (DE).
Data were analysed using both multivariate and univariate techniques. This allowed us to examine both the fish assemblage structure (e.g. species composition, relative biomass by species and trophic group) and single variables (i.e. biomass of target species and of each trophic group), in relation to both the protection level and the spatial variability at the location scale. More formally, the protection level or ‘Zone’ (ZO) was treated as a fixed factor (4 levels: A, B, C and external locations), while ‘Location’ (LO; i.e. sampling spots located at hundreds of metres apart to account for spatial variability within each level of protection) was treated as a random factor (2 levels) nested in ZO.
Differences in the structure of fish assemblages were tested through multivariate analyses conducted with PRIMER 6 software (Plymouth Marine Laboratory, UK) implemented with the Permanova + routine. A two-way permutational multivariate analysis of variance (PERMANOVA; Anderson, Reference Anderson, Balakrishnan, Colton, Everitt, Piegorsch, Ruggeri and Teugels2017) was done to compare whole fish assemblage structures across different levels of protection, as well as those grouped into trophic groups. PERMDISP was used to test for possible differences in ‘multivariate dispersion’ among groups (Anderson, Reference Anderson, Balakrishnan, Colton, Everitt, Piegorsch, Ruggeri and Teugels2017). PERMANOVA and PERMDISP have been paired under the hypothesis that fishing (expressed by the factor ‘Zone’) may impact fish assemblages (i.e. taxa composition and relative biomasses of both whole assemblages and trophic groups) not only in terms of multivariate location, but also multivariate dispersion patterns. To reduce the numerical ‘noise’ effect of common gregarious species, data were square root transformed. Analyses were based on a Bray-Curtis resemblance matrix using 9999 permutations. Whenever a statistical test was significant (p < 0.05) for the factor ZO, a post-hoc (pair-wise comparison) was performed to determine differences between paired levels of protection. To visualise multivariate patterns, non-metric multidimensional scaling (nMDS) ordination plots were performed. In each two-dimensional plot, each point represents the centroid of sampling units (transects) for each sampling location and distances among points reflect the greater or lesser similarity among the replicates. Stress values were shown for each nMDS plot to indicate the goodness of representation.
Total fish biomass, the biomass by trophic group (species pooled by trophic group, TG, treated as a fixed factor in the analyses) and biomass of single target species were analysed using permutational ANOVA (PERANOVA, including Monte Carlo p-values; Anderson, Reference Anderson, Balakrishnan, Colton, Everitt, Piegorsch, Ruggeri and Teugels2017) based on Euclidean distance measure on the resemblance matrix using 9999 permutations. Data were square root transformed and whenever a statistical test was significant (p < 0.05) for the interaction ZO×TG, a post-hoc (pair-wise comparison) was performed to determine differences between pairs of levels of factor ZO by the trophic group. Species targeted by fishing are considered to be particularly sensitive to protection (A. Di Franco et al., Reference Di Franco, Bussotti, Navone, Panzalis and Guidetti2009) and some are functionally important predators in rocky reefs, being involved in trophic cascades and thus having community-wide impacts (Guidetti Reference Guidetti2006; Sala et al., Reference Sala, Boudouresque and Harmelin-Vivien1998). We therefore ran specific analyses on the dusky grouper (Epinephelus marginatus), the brown meagre (Sciaena umbra), the white seabream (Diplodus sargus), and the common two-banded seabream (Diplodus vulgaris). Whenever a statistical test was significant (p < 0.05) for the factor ZO, a post-hoc (pair-wise comparison) was performed to determine differences between paired levels of protection.
Results
General features of the benthic rocky-reef habitat
Erect macroalgal cover accounted for >90% at Bergeggi Island, >97% at Portofino and >80% at Cinque Terre. Barren substrate consistently exhibited low values (<10% at Bergeggi Island; <3% at Portofino; <20% at Cinque Terre), independently of the protection level. Portofino MPA exhibited the lowest values of barren cover, with Zones A and B achieving the 100% of macroalgae benthic coverage. The sessile zoobenthic component was negligible everywhere, whatever the study area and protection level (<5%).
Overall, densities of both sea urchins (i) were generally low (i.e. ranging from 0 to about 5 individuals/m2, often <1 individuals/m2), and (ii) increased with decreasing levels of protection. Arbacia lixula was found less abundant than Paracentrotus lividus, with just one single individual recorded at Portofino and few individuals at Bergeggi Island sampling areas.
Recorded fish taxa
A total of 52 fish taxa (spanning 21 families) were recorded within and outside the Bergeggi Island MPA, 47 taxa (18 families) within and outside the Portofino MPA, and 47 taxa (21 families) within and outside the Cinque Terre MPA. Across the three study areas, the most represented fish taxa belonged to the families Labridae (accounting for 7.5%, 7.9%, and 6.6% in terms of overall fish abundance at the Bergeggi, Portofino, and Cinque Terre MPAs, respectively) and Sparidae (accounting for 16.2%, 14.9%, and 12.8% in terms of overall fish abundance at the Bergeggi, Portofino, and Cinque Terre MPAs, respectively) (Table 1).
Fish taxa censused at the three study areas (Bergeggi Island, Portofino, and Cinque Terre) distinguished by zone of occurrence (A, B, and C = inside the MPA; E = external to the MPA) and trophic group. HP = high-level predator; CA = carnivore, PL = planktivore, HE = herbivore, DE = detritivore

Whole fish assemblages
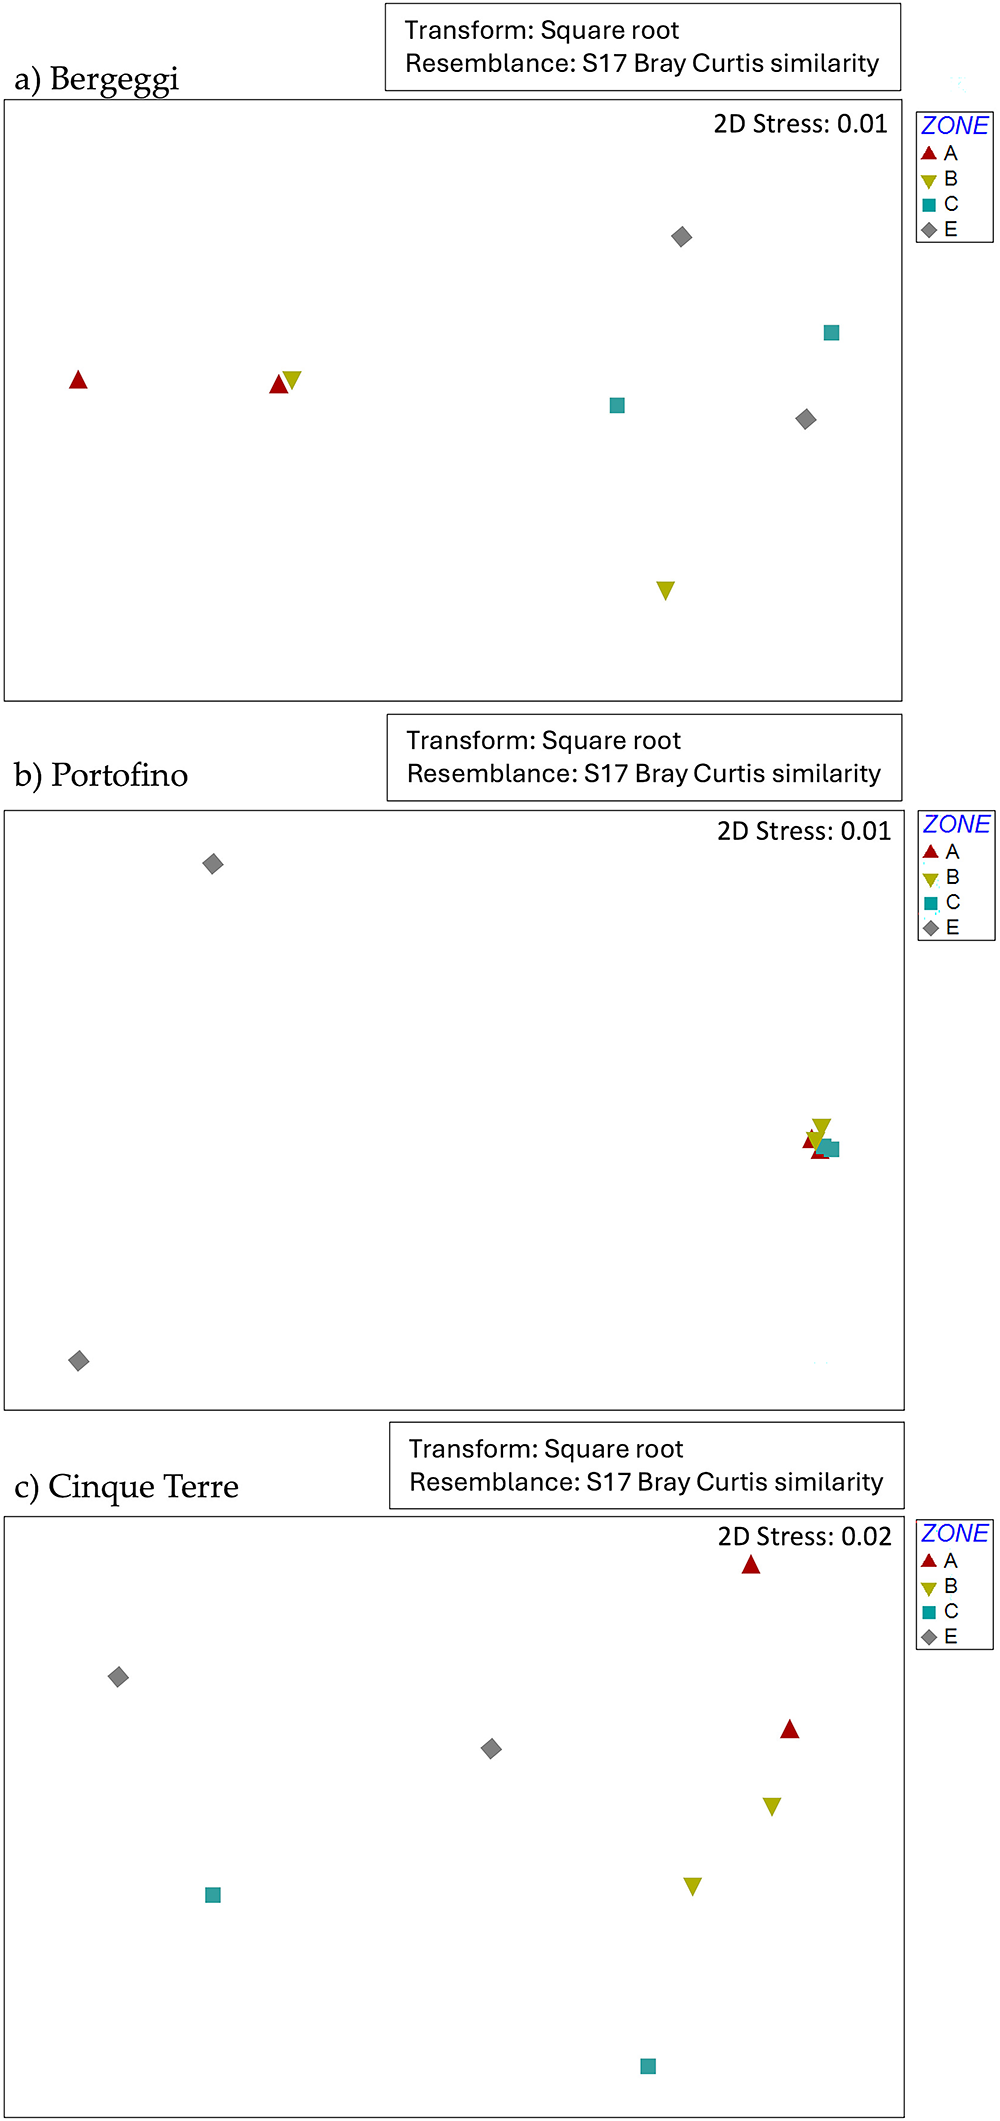
Multivariate analyses carried out on whole fish biomass data show that assemblage structures tend to be different in relation to the protection level (i.e. the factor ‘Zone’). More specifically, the PERMANOVA analysis carried out on biomass data sampled at the Bergeggi Island MPA detected a significant effect of the factor ‘Zone’ (i.e. the protection level) and a non-significant variability at the spatial scale of locations (although the p-value was close to the significance threshold; see supplementary materials, Table S1). Post-hoc pairwise tests between levels of the factor ‘Zone’ highlighted a significant difference between Zone A versus Zones C and E (see supplementary materials, Table S2). The graphic representation of fish assemblages by means of nMDS showed a clear separation among protection levels (Figure 2a). PERMANOVA detected statistically significant differences in whole fish biomass among zones and among locations at the Portofino MPA (see supplementary materials, Table S3). Post-hoc pairwise tests displayed significant differences between E and the other three protection levels (see supplementary materials, Table S4). The visual inspection of the nMDS plot highlighted a clear-cut separation between the unprotected area and Zones A, B, and C within the MPA (Figure 2b). PERMANOVA run on biomass data collected at Cinque Terre MPA, again, revealed a statistically significant effect of the factor ‘Zone’ and a significant variability among locations (see supplementary materials, Table S5), with a significant difference between Zones A and C detected by pair-wise post-hoc tests (see supplementary materials, Table S6). The nMDS plot showed a slight separation among zones (Figure 2c).
nMDS plots showing the centroids of replicates for sampling locations by factor ‘Zone’ (A, B, C = inside the MPA, E = external to the MPA) obtained from biomass data of whole fish assemblages: (a) Bergeggi Island MPA; (b) Portofino MPA; (c) Cinque Terre MPA.

Besides the significant differences in multivariate location at the three MPAs investigated for the factor ‘Zone’, multivariate fish biomass data of whole assemblages displayed significant multivariate dispersion at the Bergeggi (Permdisp: F1,7 = 5.6, P(perm) < 0.01) and Cinque Terre MPAs (Permdisp: F1,7 = 3.8 P(perm) = 0.02), but not at the Portofino MPA (Permdisp: F1,7 = P(perm) = 0.13).
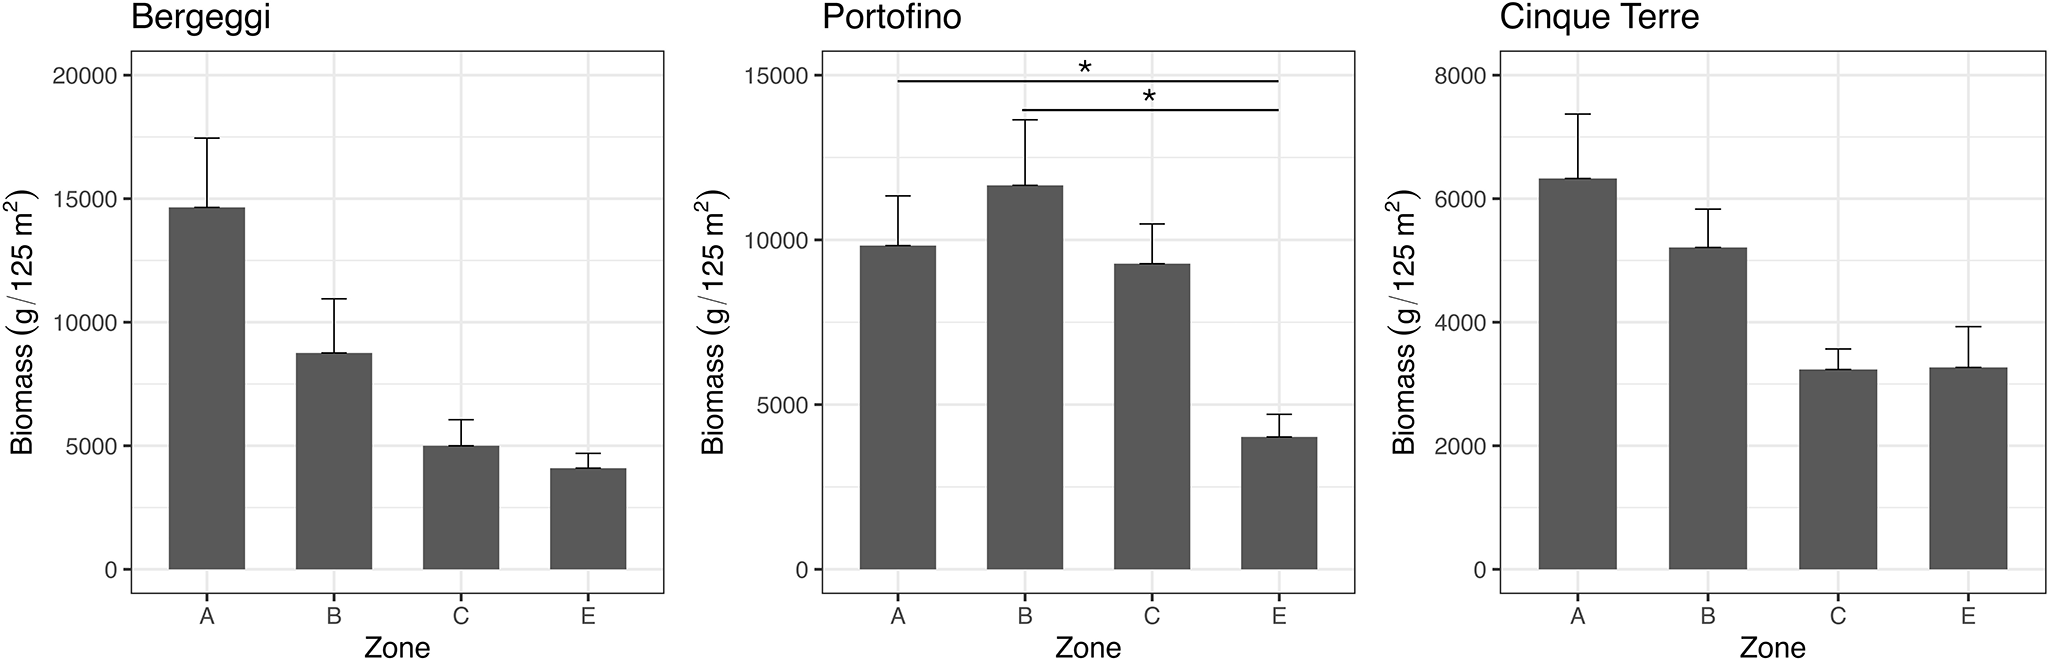
The total fish biomass (obtained by summing the biomass of all fish species censused) tended to be positively correlated with the protection level at all the three MPAs investigated (Figure 3). PERANOVA analyses did not reveal any significant effect of the factors ‘Zone’ and ‘Location’ at the MPAs of Bergeggi and Cinque Terre (see supplementary materials, Tables S7 and S10). A significant effect of the factor ‘Zone’, on the contrary, was found at the Portofino MPA, with pair-wise tests that revealed a significantly higher fish biomass in Zones A and B than outside the MPA (see supplementary materials, Tables S8 and S9).
Total biomass (mean ± standard error, SE) of the fish assemblage in the three study areas, across the three zones within each MPA (protection levels: A, B, C) and in the areas external to the MPAs (E).

Fish assemblages by trophic groups
Multivariate analyses performed on biomass data of fish assemblages grouped into the five trophic groups showed distinct outputs across the three study areas. PERMANOVA analyses displayed that the factor ‘Zone’ was significant for both the Bergeggi Island and Portofino MPAs (see supplementary materials, Tables S11 and S13). Pair-wise tests indicated significant differences between Zone A versus Zones C and E at the Bergeggi Island MPA, and between Zone E versus Zones A, B, and C at the Portofino MPA (see supplementary materials, Tables S12 and S14). PERMANOVA also revealed a significant variability among locations at both the Bergeggi Island and Cinque Terre MPAs (see supplementary materials, Tables S11 and S15). The nMDS graphical representations (Figure 4) showed that Zone A and to a lesser extent Zone B at the Bergeggi Island and Cinque Terre MPAs tended to separate from Zones C and E (Figure 4a,c). At the Portofino MPA, protected locations (within Zones A, B, and C) clustered together, clearly separating from the unprotected locations in Zone E (Figure 4b).
nMDS plots showing the centroids of replicates for sampling locations by factor ‘Zone’ (A, B, C = inside the MPA, E = external to the MPA) obtained from biomass data of the fish assemblages grouped into the five trophic groups considered. (a) Bergeggi Island MPA; (b) Portofino MPA; (c) Cinque Terre MPA.

Considering the factor ‘Zone’, multivariate fish biomass of trophic groups’ data showed significant multivariate dispersion at the Cinque Terre MPA (Permdisp: F1,7 = 6.0, P(perm) < 0.01), but not at the Bergeggi (Permdisp: F1,7 = 2.8, P(perm) = 0.08) and Portofino (Permdisp: F1,7 = 0.6, P(perm) = 0.70) MPAs.
Total fish biomass categorised by trophic structure (all species pooled by trophic group) showed different patterns across the study areas (Figure 5). Considering the different trophic groups of fishes, the biomass of high-level predators (HP) and carnivores (CA) showed general trend to be greater within the MPAs, especially in Zones A and B, compared to Zone C and even more so outside MPAs. The biomass of HP, in particular, was worryingly low in E areas, i.e. outside the MPAs (Figure 5a,b,c). The biomass of herbivores (HE) did not show a consistent pattern related to the protection level: it increased with protection at the Bergeggi Island MPA but tended to decrease, being fairly variable, at the Portofino and Cinque Terre MPAs (Figure 5a,b,c). Planktivores (PL) did not show any specific pattern across zones with different protection levels in the three study areas. Finally, detritivores (DE) displayed very low biomass values, regardless of the protection level (Figure 5a,b,c).
Biomass (mean ± SE) distribution of the five trophic groups (HP = high-level predator; CA = carnivore, PL = planktivore, HE = herbivore, DE = detritivore) in the (a) Bergeggi Island MPA, (b) Portofino MPA, and (c) Cinque Terre MPA across the three zones within each MPA (protection levels: A, B, C) and in the areas external (E) to the MPAs.

Univariate analyses conducted on fish biomass of different trophic groups at the Bergeggi Island MPA revealed a statistically significant interaction between factors ‘Location’ and ‘Trophic group’ (LO×TG), indicating that differences among TGs varied at the spatial scale of locations (see supplementary materials, Table S16). At the Portofino MPA, in contrast, statistical analyses showed a significant interaction between factors ‘Zone’ and ‘Trophic group’ (ZO×TG), suggesting that differences among TGs changed across protection levels (see supplementary materials, Table S17). Pair-wise comparisons indicated that (i) the biomass of high-level predators (HP) was significantly greater in all protected zones (A, B, and C) compared to Zone E, and (ii) the biomass of detritivores (DE) was significantly greater in Zone B compared to Zone E, with no significant differences detected for the other TGs (see supplementary materials, Tables S18 to S22). At the Cinque Terre MPA, analyses displayed significant interactions of both LO×TG and ZO×TG (see supplementary materials, Table S24). This means that the mean values of fish biomass for the trophic groups tended to change across locations and among protection levels, although pair-wise comparisons did not show any statistically significant differences (see supplementary materials, Tables S25 to S29).
Fishery target species
Overall, target species (i.e. E. marginatus, S. umbra, D. sargus, and D. vulgaris) showed the highest biomasses within all three MPA zones, generally exhibiting a decreasing trend across the protection gradient (Figures 6–9).
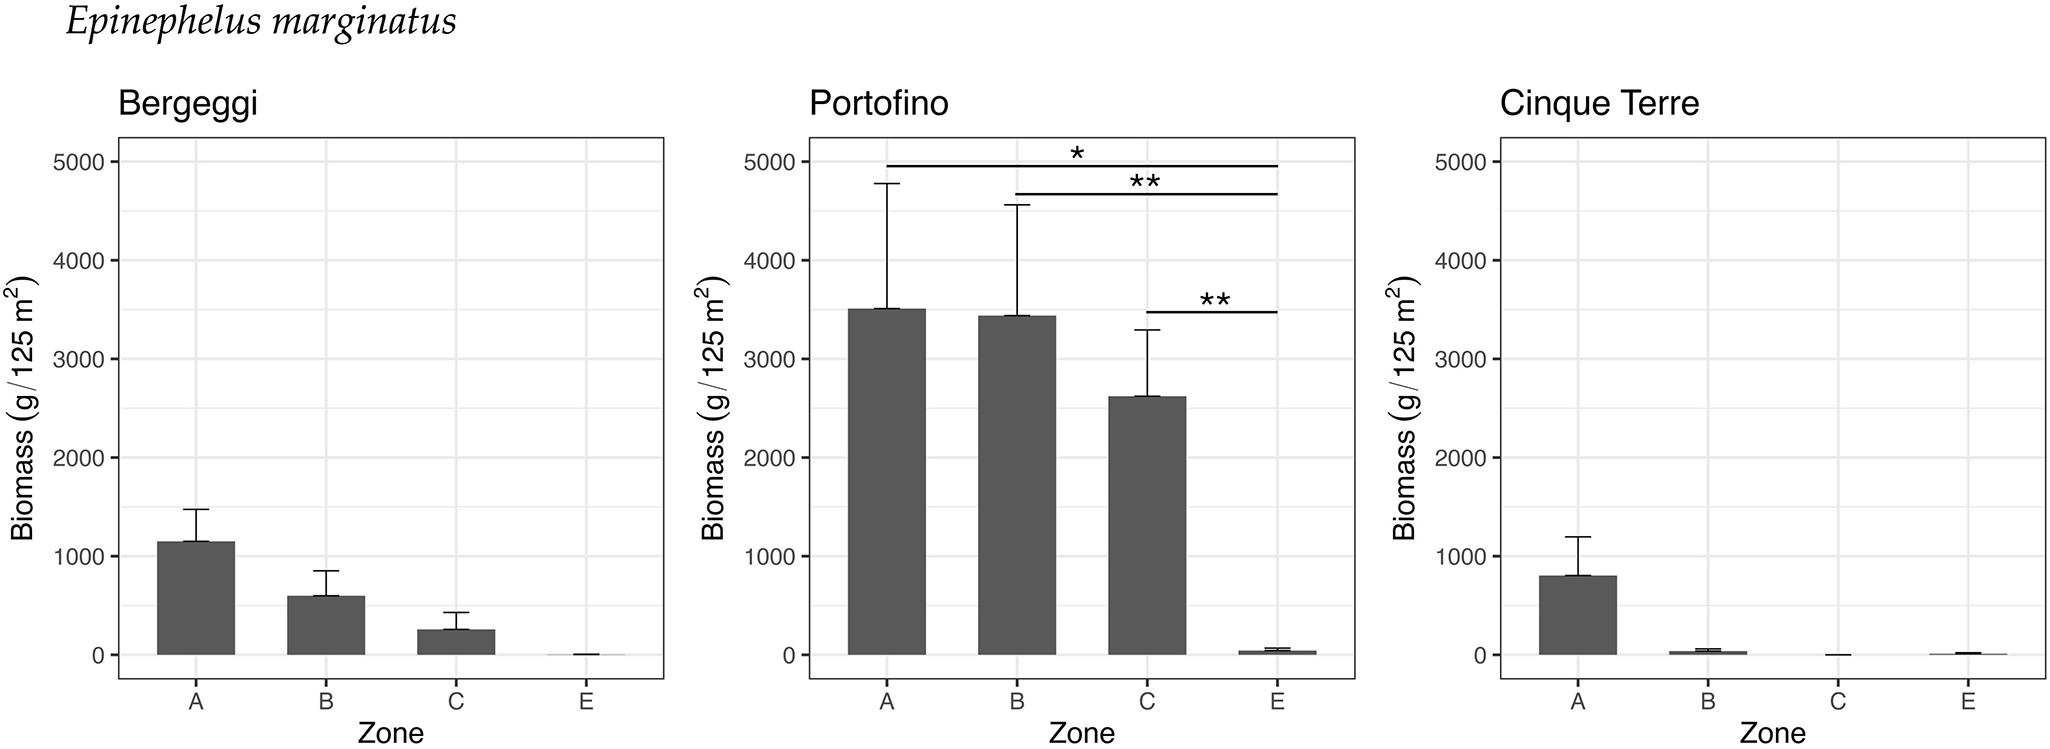
The biomass of the dusky grouper (E. marginatus) tended to decrease with decreasing levels of protection, with the highest biomass values observed in Zone A of all three MPAs, particularly high within the Portofino MPA (Figure 6).
Biomass (mean ± standard error, SE) of the dusky grouper, Epinephelus marginatus, in the three study areas, across the three zones within each MPA (protection levels: A, B, C) and in the areas external (E) to the MPAs.

Statistical analyses on biomass fish data did not reveal any significant effect of the factors LO and ZO at the Bergeggi Island and Cinque Terre MPAs. However, the p-value for the factor ZO at the Bergeggi Island MPA was close to the significance threshold (see supplementary materials, Table S30), and there was a slight significant variability at the spatial scale of locations at the Cinque Terre MPA (see supplementary materials, Table S33). In contrast, at the Portofino MPA the biomass of the dusky grouper significantly changed among protection levels (see supplementary materials, Table S31), with mean values in Zones A, B, and C significantly higher than those outside the MPA (see supplementary materials, Table S32).
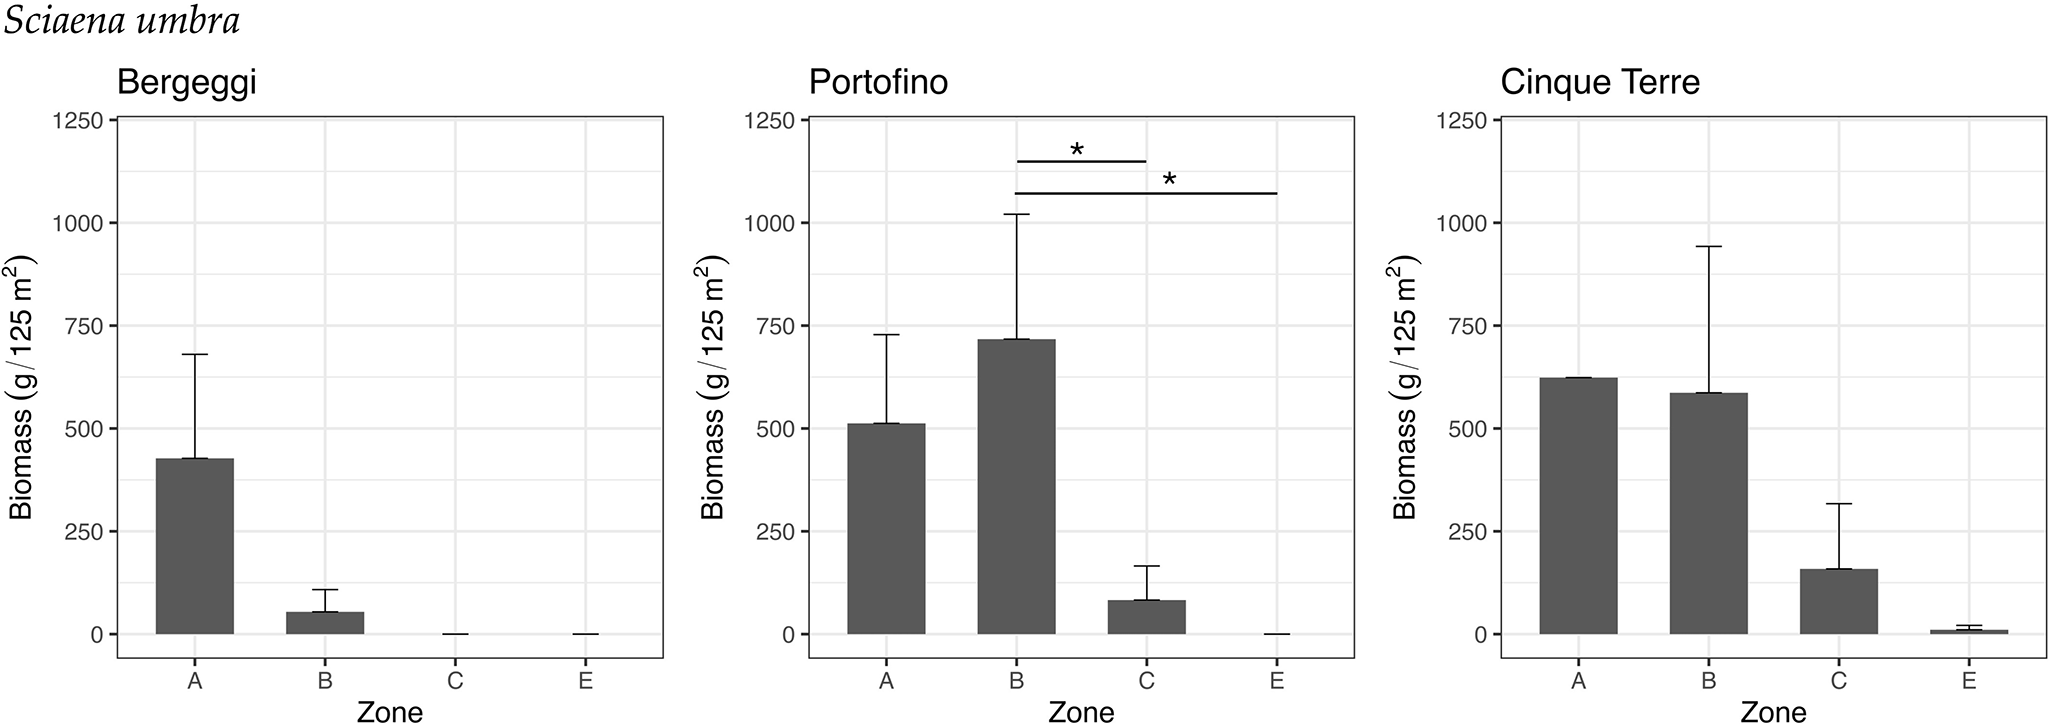
The biomass of the brown meagre (S. umbra) was higher in Zones A and/or B in all three MPAs compared to Zone C or adjacent unprotected areas E (Figure 7). No individuals were recorded outside the Bergeggi Island and Portofino MPAs, nor within Zone C of the Bergeggi Island MPA.
Biomass (mean ± standard error, SE) of the brown meagre, Sciaena umbra, in the three study areas, across the three zones within each MPA (protection levels: A, B, C) and in the areas external to the MPAs (E).

Univariate analyses did not reveal any significant differences among protection levels at the Bergeggi Island and Cinque Terre MPAs (see supplementary materials, Tables S34 and S37). In contrast, at the Portofino MPA, the biomass of the brown meagre varied significantly among protection levels (see supplementary materials, Table S35). Specifically, biomass values in Zone B were significantly higher than those in Zone C and outside the MPA, while the p-value for the comparison between Zones A and E was close to the significance threshold (see supplementary materials, Table S36).
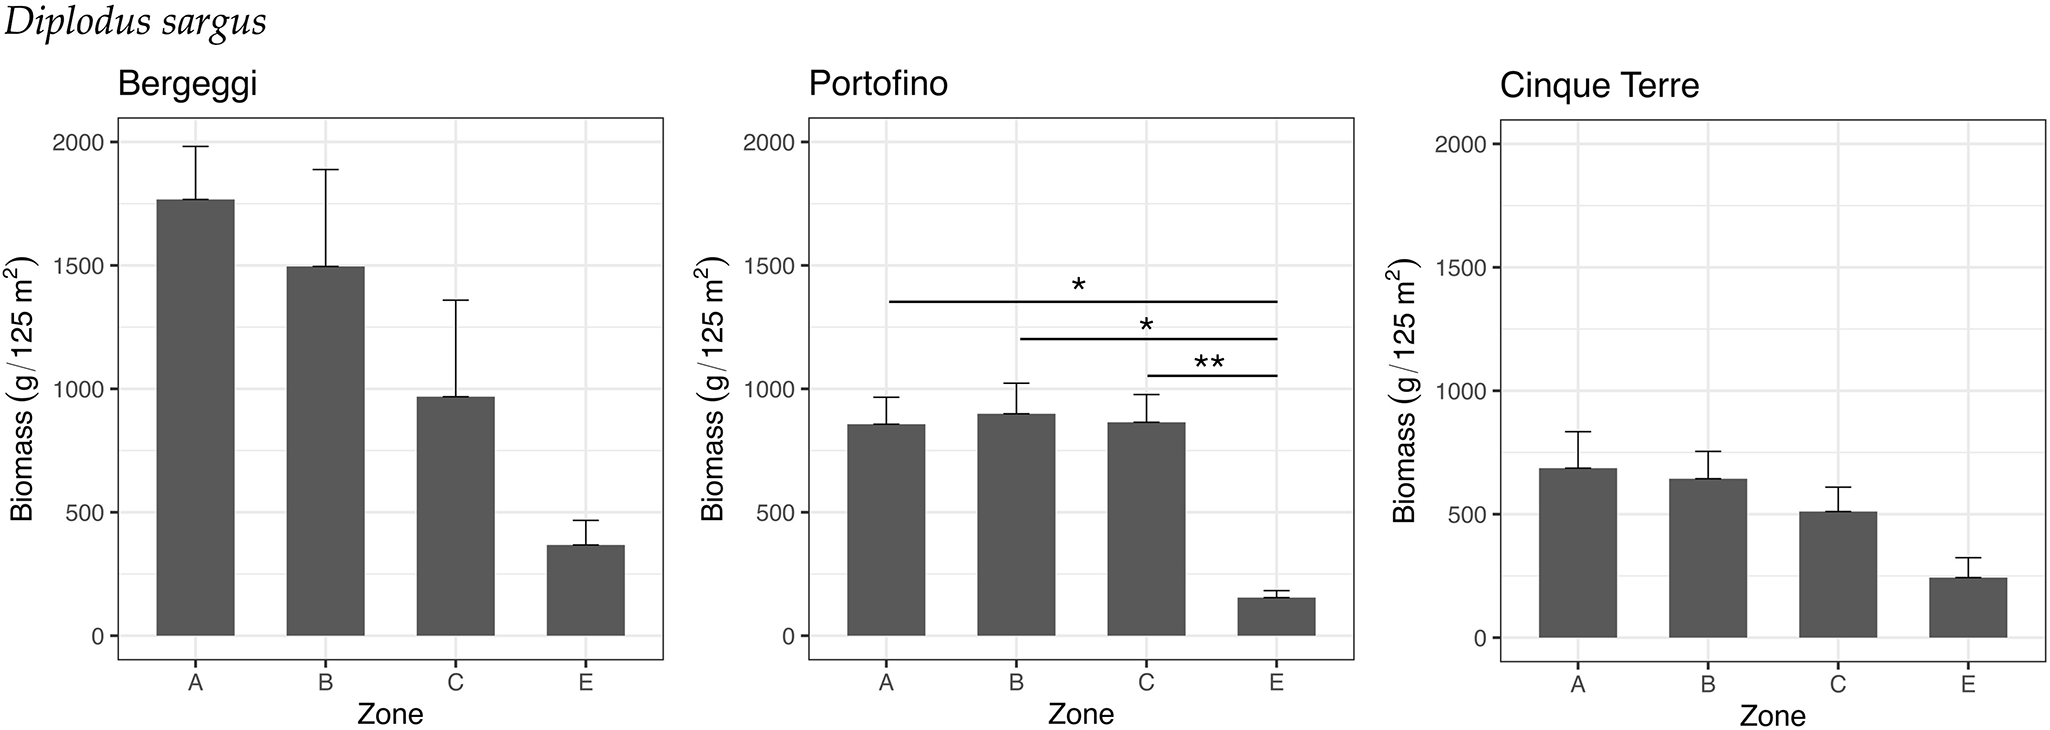
The white seabream exhibited consistently greater biomass values inside all three MPAs compared to outside. Within the MPAs of Bergeggi Island and Cinque Terre, there was a decreasing pattern from Zones A to E (Figure 8).
Biomass (mean ± standard error, SE) of the white seabream, Diplodus sargus, in the three study areas, across the three zones within each MPA (protection levels: A, B, C) and in the areas external to the MPAs (E).

PERANOVA analyses did not reveal any significant differences among protection levels at the Bergeggi Island and Cinque Terre MPAs (see supplementary materials, Tables S38 to S41). In contrast, at the Portofino MPA, the biomass of the white seabream varied significantly among protection levels (see supplementary materials, Table S39). Specifically, mean biomass values in Zone E were significantly lower than those in Zones A, B, and C within the MPA (see supplementary materials, Table S40).
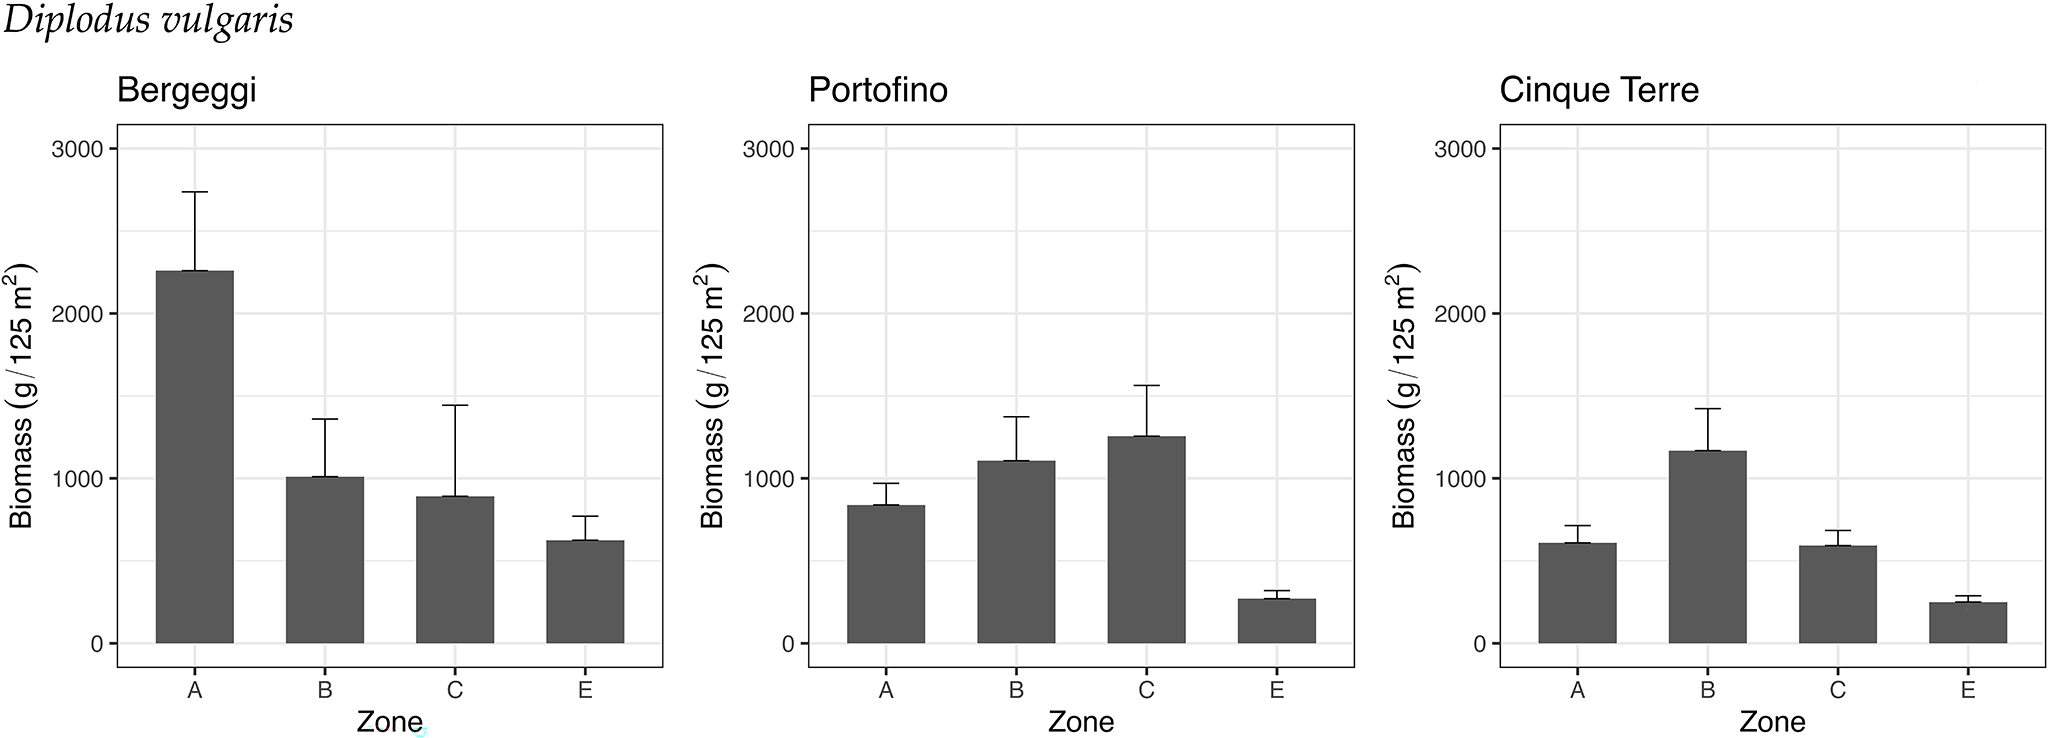
The common two-banded seabream did not follow the same pattern at the three MPAs studied, except for the fact that biomass values in all three cases were the lowest in Zone E, i.e. the unprotected areas (Figure 9).
Biomass (mean ± standard error, SE) of the common two-banded seabream, Diplodus vulgaris, in the three study areas, across the three zones within each MPA (protection levels: A, B, C) and in the areas external to the MPAs (E).

Statistical analysis did not reveal any significant difference among protection levels at the three investigated MPAs. However, variability was observed at the spatial scale of locations (see supplementary materials, Tables S42 to S44).
Discussion
Our study on rocky reef fish assemblages subject to a protection gradient at three MPAs in the Ligurian Sea (NW Mediterranean) clearly shows patterns that positively relate to the protection level. Differences in the structure of fish assemblages, both overall and by distinct trophic groups, were observed in Zone A (i.e. FP-fully protected areas) and, to a lesser extent, in Zone B, compared to Zone C and external areas. Total fish biomass (combining all species), and particularly that of high-level predators (HP) and then carnivores (CA), increased with the level of protection in all three MPAs. Notably, HP fish biomass outside the MPAs was worryingly low. This is attributable to the very low abundance and small size of high-level predatory fishes in areas open to recreational and commercial fishing, which are subject to less restrictive national laws compared to the restrictions in force within the MPAs. The greater biomass of HP and, to a lesser extent, CA within the three studied MPAs is likely due to the positive response of commercially valuable fishes, which usually correspond to high-level predatory species (Giakoumi et al., Reference Giakoumi, Scianna, Plass-Johnson, Micheli, Grorud-Colvert, Thiriet, Claudet, Di Carlo, Di Franco, Gaines, García-Charton, Lubchenco, Reimer, Sala and Guidetti2017; Guidetti and Sala, Reference Guidetti and Sala2007). In contrast, other trophic groups such as herbivores (HE), planktivores (PL) and detritivores (DE) did not show any response to protection from fishing, as may be expected (Pauly et al., Reference Pauly, Christensen, Dalsgaard, Froese and Torres1998). Overall, these findings confirm that fishing (including both commercial and recreational fishing) is a major source of impact on fish assemblages, especially on high-level predatory species. The patterns we observed are consistent with those reported from other MPAs in the Mediterranean Sea (Claudet et al., Reference Claudet, Osenberg, Domenici, Badalamenti, Milazzo, Falcón, Bertocci, Benedetti-Cecchi, García-Charton, Goñi, Borg, Forcada, De Lucia, Perez-Ruzafa, Afonso, Brito, Guala, Le Diréach, Sanchez-Jerez, Somerfield and Planes2010; García-Charton et al., Reference García-Charton, Pérez-Ruzafa, Marcos, Claudet, Badalamenti, Benedetti-Cecchi, Falcón, Milazzo, Schembri, Stobart, Vandeperre, Brito, Chemello, Dimech, Domenici, Guala, Le Diréach, Maggi and Planes2008; Guidetti et al., Reference Guidetti, Baiata, Ballesteros, Di Franco, Hereu, Macpherson, Micheli, Pais, Panzalis, Rosenberg, Zabala and Sala2014; Guidetti and Sala, Reference Guidetti and Sala2007; Rojo et al., Reference Rojo, Anadón and García-Charton2021) and worldwide (Aburto-Oropeza et al., Reference Aburto-Oropeza, Erisman, Galland, Mascareñas-Osorio, Sala and Ezcurra2011; Della Marta et al., Reference Della Marta, Vergés, Powell, Smith and Poore2023).
Although consistent general patterns of response to protection emerged in all three MPAs, there was also non-negligible variability among these geographically close areas. This suggests that local factors (i.e. local rugosity, habitat heterogeneity, slope, food resources), along with differences in protection duration, might have affected fish assemblages. In our case, in addition, benthic cover – possibly affected by the trophic interaction with grazers like sea urchins – could have also exerted a role, an aspect which would deserve further investigation in the future by using a more appropriate and robust sampling design for getting benthos and sea urchins’ data (especially in terms of depth range cover). In spite of that, these outputs show that protection from fishing can produce detectable and consistent benefits to fish, provided that protection rules are at least sufficiently enforced (Giakoumi et al., Reference Giakoumi, Scianna, Plass-Johnson, Micheli, Grorud-Colvert, Thiriet, Claudet, Di Carlo, Di Franco, Gaines, García-Charton, Lubchenco, Reimer, Sala and Guidetti2017; Guidetti et al., Reference Guidetti, Baiata, Ballesteros, Di Franco, Hereu, Macpherson, Micheli, Pais, Panzalis, Rosenberg, Zabala and Sala2014; Sala et al., Reference Sala, Ballesteros, Dendrinos, Di Franco, Ferretti, Foley, Fraschetti, Friedlander, Garrabou, Güçlüsoy, Guidetti, Halpern, Hereu, Karamanlidis, Kizilkaya, Macpherson, Mangialajo, Mariani, Micheli, Pais, Riser, Rosenberg, Sales, Selkoe, Starr, Tomas and Zabala2012).
Moreover, although the trophic structure of fish assemblages and the overall recovery patterns related to protection were rather consistent among the three MPAs investigated (with HP and CA being positively correlated with the protection level), some differences were observed when considering some charismatic species separately. For instance, the biomass of the dusky grouper Epinephelus marginatus was far higher at the Portofino MPA, while the biomass of the brown meagre Sciaena umbra was higher at the Portofino and Cinque Terre MPAs, and the biomass of the two sea breams, i.e. Diplodus sargus and D. vulgaris, was higher at the Bergeggi MPA. Such species-specific responses to protection among MPAs have also been reported in previous studies (e.g. Guidetti et al., Reference Guidetti, Baiata, Ballesteros, Di Franco, Hereu, Macpherson, Micheli, Pais, Panzalis, Rosenberg, Zabala and Sala2014) and can be attributed to local factors, such as the availability of specific habitat types and features, such as habitat complexity and heterogeneity, as well as slope, rocky substrate cover and temperature profiles. These findings suggest that the recovery within MPAs can trigger predictable changes in whole assemblages and specific trophic groups, whereas individual species may respond differently due to local factors. This point is important to take into account in order to properly set the objectives and expected outcomes of each individual MPA.
One point worth highlighting is that our approach – such as our data collection methods, study design, and the inherent variability introduced by multiple observers – may involve certain limitations. Nevertheless, given the precautions we have implemented, including significant spatial replication and selection of experienced observers/scientists, we believe that potential sources of bias have been minimised. These results make this study a useful example for other MPAs. Our outputs, in fact, could be extremely helpful to other MPA management bodies, as they may benefit from adopting similar monitoring to (i) assess the effectiveness of each individual MPA; (ii) adjust conservation measures to progressively improve the MPA outcomes within an adaptive management framework; (iii) provide a crucially useful benchmark to improve fishing management even outside MPAs. Also, given the relative spatial proximity of the MPAs considered in this study, regional environmental management bodies may have the opportunity to assess whether the MPAs may constitute an effective regional MPAs network. MPAs networks, in fact, can be effective only if the MPAs making part of the network are individually effective (Grorud-Colvert et al., Reference Grorud-Colvert, Claudet, Tissot, Caselle, Carr, Day, Friedlander, Lester, Lison de Loma, Malone and Walsh2014). Finally, these results may offer national and EU environmental management agencies the opportunity to discuss how important is the adoption of systematic ecological monitoring for the effective achievement of national/EU conservation targets, such as the ‘30×30’ target agreed by the international community (Obura, Reference Obura2023). This latter point merits particular attention as it shows clearly how similar studies on the effectiveness of MPAs performed by assessing ecological variables (in this study related to fish) may contribute to the achievement of international conservation targets. A global conservation target to protect at least 30% of oceans and seas worldwide by 2030 (‘30×30 target’) has been agreed by the international community, with the aim of preserving biodiversity from further losses and guaranteeing the provision of ecosystem services to humans (Pike et al., Reference Pike, MacCarthy, Hameed, Harasta, Grorud-Colvert, Sullivan-Stack, Claudet, Horta E Costa, Gonçalves, Villagomez and Morgan2024). Clearly this target considers MPAs as strategic tools, for sustaining both nature and human well-being (Grorud-Colvert et al., Reference Grorud-Colvert, Sullivan-Stack, Roberts, Constant, Horta, Costa, Pike, Kingston, Laffoley, Sala, Claudet, Friedlander, Gill, Lester, Day, Gonçalves, Ahmadia, Rand, Villagomez, Ban, Gurney, Spalding, Bennett, Briggs, Morgan, Moffitt, Deguignet, Pikitch, Darling, Jessen, Hameed, Di Carlo, Guidetti, Harris, Torre, Kizilkaya, Agardy, Cury, Shah, Sack, Cao, Fernandez and Lubchenco2021). In the previous decade (2010–2020), the CBD Aichi and UN-SD targets for ocean conservation substantially failed (Carr et al., Reference Carr, Abas, Boutahar, Caretti, Chan, Chapman, de Mendonça, Engleman, Ferrario, Simmons, Verdura and Zivian2020; Secretariat of the Convention on Biological Diversity, 2020; Vilar and Joyeux Reference Vilar and Joyeux2021) prioritising quantity against quality of protection (Pike et al., Reference Pike, MacCarthy, Hameed, Harasta, Grorud-Colvert, Sullivan-Stack, Claudet, Horta E Costa, Gonçalves, Villagomez and Morgan2024). In many countries this failure occurred not necessarily in terms of reaching the target of protecting 10% of the marine waters ‘on paper’, but to implement it ‘effectively and equitably’, i.e. ‘in the water, for nature and people’. This failure seriously called into question the validity of MPA coverage as a significant metric to assess real progress in marine conservation, so to carry on using it could entail the risk of failing to achieve the vital and more ambitious ‘30×30 target’. Pike et al., (Reference Pike, MacCarthy, Hameed, Harasta, Grorud-Colvert, Sullivan-Stack, Claudet, Horta E Costa, Gonçalves, Villagomez and Morgan2024), from this perspective, stressed that ‘Indicators of MPA quality, not only coverage, are needed to ensure a global network of MPAs that covers at least 30% of the ocean and effectively safeguards representative marine ecosystems from destructive human activities’, thus benefiting both nature and humans. The assessment of fish assemblage recovery performed in this study makes thus sense not only to evaluate the effectiveness of single MPAs but also to carefully select those MPAs that, based on the quality of conservation efforts and related outcomes, will effectively contribute to achieving the ‘30×30 target’ at national level. The same approach should also be applied to social and economic indicators to assess the economic and social impacts of MPAs in terms of equity, equitability, well-being and ‘blue justice’ (Bennett et al., Reference Bennett, Cisneros-Montemayor, Blythe, Silver, Singh, Andrews, Calò, Christie, Di Franco, Finkbeiner, Gelcich, Guidetti, Harper, Hotte, Kittinger, Le Billon, Lister, López de la Lama, McKinley, Scholtens, Solås, Sowman, Talloni-Álvarez, The, Voyer and Sumaila2019). The upcoming UN Decade of Ocean Science for Sustainable Development (2021–2030), from this point of view, offers an important opportunity to take advantage of the natural and social sciences in creating sustainable, effective and equitable MPA networks, where nature conservation pairs up with social and economic effectiveness (Costello, Reference Costello2024; Rees et al., Reference Rees, Sheehan and Attrill2021). However, if scientists from different disciplines can provide evidence on ecological and socio-economic effectiveness, making MPAs truly effective and equitable remains a political choice, more vital in this historical period than in any other. Without committed and effective political will and leadership, which goes beyond the gaps scientists can fill, ocean conservation is unlikely to make any difference, running the risk of making even more evident the misalignment between official declarations ‘on paper’ and concrete actions ‘in the real world’ (Nature Editorial Board, 2023).
Supplementary material
The supplementary material for this article can be found at https://doi.org/10.1017/S0025315425100763.
Acknowledgements
We would like to thank the management bodies and staff members of the MPAs investigated for the support they provided. Specifically, we thank D. Virzi (Director of the Bergeggi Island MPA), M. Mariotti, V. Cappanera, and L. Merotto (Director and staff members of the Portofino MPA), and D. Bianchi, P. Scarpellini, I. Lavarello, and C. Valerani (President, Director and staff members of the Cinque Terre MPA) for having given us the opportunity to carry out the present study. We would like also to thank the Triton (S. Mongiardino, R. Squinzani), Nereo Sub (S. Catania), B&B (R. Bacigalupi), and Punta Mesco (D. Ferrari) diving centres for valuable logistical support. Many thanks are also due to M. Paul for his valuable support in revising the English language. This paper is dedicated to our colleague and friend Patrice Francour, who passed away a few years ago and who with unremitting passion dedicated his entire life and career to the study of Mediterranean fishes and their conservation within MPAs.
Author contributions
D.D.B., F.P., S.B., E.D.: data collection, analysis and interpretation, writing; M.G.: data analysis, writing; P.G.: study design, data collection and analysis, data interpretation and writing.
Data availability statement
Data can be available upon reasonable request.
Funding
This research was funded by the ‘Fondo Europeo per gli Affari Marittimi e la Pesca FEAMP Misura 1.40 lett. d), e) e f) Protezione e ripristino della biodiversità e degli ecosistemi marini e dei regimi di compensazione nell’ambito di attività di pesca sostenibili’ del Regolamento (UE) n. 508/2014’, via the Italian ‘Ministero dell’Agricoltura, della Sovranità Alimentare e delle Foreste-MASAF’. This research was also supported by the National Recovery and Resilience Plan (NRRP), Mission 4 Component 2 Investment 1.4 - Call for tender No. 3138 of 16 December 2021, rectified by Decree n.3175 of 18 December 2021 of Italian Ministry of University and Research funded by the European Union – NextGenerationEU; Award Number: Project code CN_00000033, Concession Decree No. 1034 of 17 June 2022 adopted by the Italian Ministry of University and Research, CUP C63C22000520001, Project title ‘National Biodiversity Future Center – NBFC’.
Competing interests
The authors declare none.