The role of orthographic information in spoken language processing has been eliciting increasing interest in the fields of speech perception and literacy. Based on converging evidence from a number of studies done in various languages, researchers have arrived at an intriguing and somewhat counterintuitive conclusion that information about how words are spelled influences recognition of spoken words in people who can read and write.
The evidence for orthographic influences in auditory word recognition comes from studies using various designs. Thus, for instance, Ziegler and Ferrand (Reference Ziegler and Ferrand1998) showed that when listeners have to make a decision whether something they hear is a real word or not, they take longer to recognize words whose rhymes can be spelled multiple ways (inconsistent words, e.g., English tomb) than words whose rhymes can only be spelled one way (consistent words, such as silk). The effect of feedback orthographic consistency in lexical decision tasks has since been replicated a number of times (recent replications include: Perre & Ziegler, Reference Perre and Ziegler2008, in French; Ventura, Morais, & Kolinsky, Reference Ventura, Morais and Kolinsky2007, in Portuguese; Ziegler, Petrova, & Ferrand, Reference Ziegler, Petrova and Ferrand2008, in French and British English). Another example of orthographic influences in spoken word recognition comes from a study by Chereau, Gaskell, and Dumay (Reference Chereau, Gaskell and Dumay2007), who showed that primed lexical decisions are faster if the target and the prime overlap in both phonology and orthography than when the overlap is in phonology only. Similar results were obtained by Taft, Castles, Davis, Lazendic, and Ngyen-Hoan (Reference Taft, Castles, Davis, Lazendic and Ngyen-Hoan2008), who demonstrated that in a primed lexical decision task, nonword primes that can be spelled the same as the target (e.g., the prime /driːd/ can be spelled as the target dread) have a greater facilitation effect than the primes that could not be spelled the same as the target (e.g., the prime /ʃriːd/ cannot be spelled as the target shred). In another lexical decision study, Ziegler, Muneaux, and Grainger (Reference Ziegler, Muneaux and Grainger2003) found that spoken words are recognized faster when they have a dense orthographic neighborhoodFootnote 1 than when the orthographic neighborhood is sparse. Finally, Pattamadilok, Perre, Dufau, and Ziegler (Reference Pattamadilok, Perre, Dufau and Ziegler2009) recently demonstrated orthographic effects in a semantic task that does not involve lexical decisions. They asked participants to decide whether a word that they heard denoted a body part. The stimuli were either orthographically consistent or inconsistent words. It was found that orthographic consistency affected the latencies of the semantic decisions. (For more comprehensive reviews of the literature on orthographic effects in spoken language processing see, e.g., Chereau et al., Reference Chereau, Gaskell and Dumay2007; Taft et al., Reference Taft, Castles, Davis, Lazendic and Ngyen-Hoan2008; Ventura et al., Reference Ventura, Morais and Kolinsky2007.)
These findings, apart from just being curious facts, may have far-reaching implications for our understanding of the cognitive mechanisms that underlie auditory processing. The exact nature of orthographic effects in spoken language tasks is being debated (Perre & Ziegler, Reference Perre and Ziegler2008; Taft et al., Reference Taft, Castles, Davis, Lazendic and Ngyen-Hoan2008; Ventura et al., Reference Ventura, Morais and Kolinsky2007). Although some researchers believe that certain experimentally observed orthographic effects may be due to task-specific and strategic factors (e.g., Taft et al., Reference Taft, Castles, Davis, Lazendic and Ngyen-Hoan2008), others argue that the orthographic effects seen in purely auditory tasks may result from automatic activation of orthography in processing of spoken words in literate people, suggesting that “literacy changes the way the brain processes spoken language” (Pattamadilok et al., Reference Pattamadilok, Perre, Dufau and Ziegler2009, p. 169; see also Perre & Ziegler, Reference Perre and Ziegler2008).
However, one crucial question seems to need to be addressed before one postulates a link between literacy acquisition and changes in spoken language processing mechanisms: the universality of the orthographic effects in the literate population. Does anyone who can read and write experience the influence of orthography on processing of spoken words? Is the size of this influence the same for every literate person or are there individual differences? If there are individual differences, what are the factors underlying these differences?
These questions have not been extensively explored in the literature. The majority of studies of orthographic effects in auditory word processing have been done with adult subjects treated as a homogeneous sample. These studies report averaged results representative of a statistically significant majority of the subjects. Differences in performance between individual participants, expected in any experiment, are commonly regarded as random and treated as a component of experimental error. However, the validity of assumptions underlying such averaging has been questioned in literature. It has been argued that individual differences in performance in an experiment may not necessarily be due to chance factors but may be attributable to some participants being more sensitive to the linguistic factors studied in the experiment than others. In other words, individual differences may be systematic rather than random and therefore should not be ignored (Baayen, Reference Baayen, Libben and Nault2004; Baayen, Tweedie, & Schreuder, Reference Baayen, Tweedie and Schreuder2002).
The hypothesis that orthographic factors may not affect every literate adult's spoken word processing in the same way is not ungrounded. The size of orthographic effects on spoken language in children has been shown to correlate with children's reading level (Ziegler & Muneaux, Reference Ziegler and Muneaux2007), as well as with their spelling skills (Bruck, Reference Bruck1992): in both studies more proficient readers and spellers exhibited stronger influence of orthographic information on the performance in an auditory task. One possible explanation for this correlation is that the size of orthographic effects depends on the quality of orthographic representations, so that the stronger orthographic knowledge is, the more it interferes with spoken language processing (Bruck, Reference Bruck1992; Ziegler & Muneaux, Reference Ziegler and Muneaux2007).
However, considerable differences in reading and in spelling skills exist also in adults (see, e.g., Shankweiler, Lundquist, Dreyer, & Dickinson, Reference Shankweiler, Lundquist, Dreyer and Dickinson1996). Thus, one might hypothesize that the size of orthographic effects in spoken word processing is not uniform across adults either and that, just like in children, it is correlated with literacy proficiency, such that orthographic effects will be more pronounced in people with stronger orthographic skills. This hypothesis is consistent with findings by Bruck (Reference Bruck1992), who showed that adults with a history of child dyslexia, who presumably have weaker orthographic representations than normal readers, exhibit less orthographic interference in phonological awareness tasks. Similar findings were obtained by Castles, Holmes, Neath, and Kinoshita (Reference Castles, Holmes, Neath and Kinoshita2003), who showed that adults who are better spellers are also better at taking advantage of orthographic information when solving phonological awareness tasks. At the same time, the phonological awareness tasks used by Bruck (Reference Bruck1992) and Castles et al. (Reference Castles, Holmes, Neath and Kinoshita2003), such as, for example, phoneme deletion (“say cat without /kə/”), differ in nature from the word recognition tasks in which orthographic effects have been observed. Phoneme awareness, tested by the former tasks, is a complex metalinguistic skill that has been shown to fully develop only in speakers familiar with the alphabetic principle of writing (for review, see, e.g., Goswami, Reference Goswami, Lundberg, Austad and Tonnessen1999). This suggests that phoneme awareness tasks cannot be solved without relying on orthographic information, and therefore the association between orthographic skills and the magnitude of orthographic effects in phoneme awareness tasks is not unexpected. Word recognition tasks, such as lexical decision, test more basic spoken language skills that develop prior to and independent from literacy acquisition. In fact, it has been shown that prereaders are able to perform a lexical decision task (Ventura et al., Reference Ventura, Morais and Kolinsky2007; Ziegler & Muneaux, Reference Ziegler and Muneaux2007). It is arguable that activation of orthographic information is not necessary to successfully perform a word recognition task (e.g., Ziegler & Ferrand, Reference Ziegler and Ferrand1998; for some counterarguments, see Taft et al., Reference Taft, Castles, Davis, Lazendic and Ngyen-Hoan2008). Because spoken-word recognition tasks are different in nature from metaphonological tasks, it is an open question whether the association between the strength of orthographic influences in metaphonological tasks and adults’ literacy proficiency can be extrapolated on word recognition tasks.
In sum, there are reasons to hypothesize that the degree to which orthographic information is involved in spoken-word recognition varies across adult listeners, and that the listeners’ orthographic proficiency is one factor underlying these individual differences. This hypothesis does not seem to have been tested directly thus far. The present study attempted to test this hypothesis by exploring individual differences in orthographic effect size in spoken-word recognition in adults.
The study included two components: a lexical decision task manipulating feedback orthographic consistency of stimuli (Ziegler & Ferrand, Reference Ziegler and Ferrand1998)—one of the paradigms in which orthographic effects have been observed in a number of studies—and a spelling test. The size of the orthographic effect in the lexical decision task was computed for each participant, and the correlations between the orthographic effect size and the spelling test scores were analyzed.
In previous studies investigating how orthographic skills are related to the magnitude of orthographic effects in spoken tasks (Bruck, Reference Bruck1992; Castles et al., Reference Castles, Holmes, Neath and Kinoshita2003), orthographic knowledge was measured using an irregular word spelling task. However, in light of recent findings suggesting that the involvement of orthography in spoken-word recognition occurs at the sublexical level, that is, orthographic information starts to be activated before the listener has heard the end of the word (Pattamadilok et al., Reference Pattamadilok, Perre, Dufau and Ziegler2009; Perre & Ziegler, Reference Perre and Ziegler2008), it also seems important to assess sublexical spelling skills and their role in the listeners’ sensitivity to orthographic factors in auditory processing. To meet this goal, the spelling test in the present study included two components: an irregular word list to assess lexical spelling skills and a nonword list to assess sublexical spelling skills.
METHOD
Stimuli and design
Lexical decision task. The list of stimuli consisted of 50 monosyllabic English words and 50 monosyllabic nonwords. Half of the words were orthographically consistent, and the other half were inconsistent. Consistent items are items that have a rhyme with only one possible spelling (e.g., globe is a consistent word because /ob/ is always spelled as <obe> in English). Inconsistent items have a rhyme with multiple possible spellings (e.g., name, because /em/ can be spelled either as <ame>, as in flame, or as <aim>, as in claim).
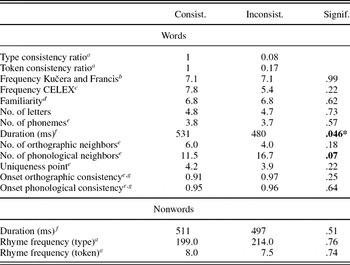
A number of psycholinguistic characteristics of words were controlled for: frequency, familiarity, length (in phonemes and letters), acoustic duration, number of orthographic and phonological neighbors, uniqueness point, and onset orthographic and phonological consistency. Table 1 lists the averages of these characteristics for consistent and inconsistent words. The differences between consistent and inconsistent words in all characteristics, except the number of phonological neighbors and acoustic duration, were not significant (Table 1). Consistent words had fewer phonological neighbors and were on average 51 ms longer than inconsistent words. The difference in phonological neighborhood density was marginally significant; the difference in duration was significant (Table 1). Both these variables were treated as covariates in the statistical analysis of the results.
Controlled stimuli characteristics in the lexical decision task and the statistical significance of the differences between consistent and inconsistent words

Note: The values in bold are variables that were used in further statistical analyses because the difference between the two groups of words was significant or marginally significant.
aAccording to Ziegler, Stone, and Jacobs (Reference Ziegler, Stone and Jacobs1997). The consistency ratio of a word (token and type) is a value ranging from 0 to 1 that is calculated as the number (or summed frequency) of friends of the word divided by the summed number (or summed frequency) of its friends and enemies. A friend is a word that has the same rhyme spelled the same way; an enemy is a word that has the same rhyme spelled differently (e.g., lime and time are friends, lime and thyme are enemies).
bAccording to Kučera and Francis (Reference Kučera and Francis1967).
cAccording to Baayen, Piepenbrock, and Gulikers (Reference Baayen, Piepenbrock and Gulikers1995). An anonymous reviewer raised a concern that Kučera and Francis’ (Reference Kučera and Francis1967) corpus is too small to be a reliable measure of frequency for low-frequency words and that the match between consistent and inconsistent words on CELEX frequency, a more reliable estimate, is not tight enough. To address this concern, the data were reanalyzed post hoc with the CELEX frequency included as a covariate, but this did not significantly affect the results. Therefore, for the purposes of this study, the difference between consistent and inconsistent words on this measure is negligible.
dOn the 7-point scale of Nusbaum, Pisoni, and Davis (1984).
eAccording to Balota et al. (Reference Balota, Cortese, Hutchison, Neely, Nelson and Simpson2002).
fMeasured after recording.
gThe orthographic and phonological consistency of onsets was calculated as the type frequency of a particular spelling or pronunciation of an onset divided by the type frequency of all spellings or pronunciations of the onset.
*p < .05.
The list of 50 nonwords was created by randomly exchanging the onsets and rhymes of real monosyllabic words. Half of nonwords had consistent rhymes, whereas the other half had inconsistent rhymes. For inconsistent nonwords, rhymes that do not have a single dominant spelling were used. The two groups of nonwords were closely matched for the type and token frequency of the rhyme. The two groups of nonwords also did not differ significantly in acoustic duration (Table 1). The list of the stimuli is given in Appendix A.
The stimuli were recorded in a soundproof room using a Marantz PMD660 digital sound recorder and Electro-Voice RE-20 microphone at a sampling rate of 44 kHz and with 16-bit conversion. A female American English speaker (born in Maryland, living in New York state) recorded the stimuli.
Spelling test. The test consisted of two components intended to assess memory for word-specific lexical spellings and the knowledge of sublexical orthography–phonology correspondences (for discussions of lexical and sublexical processing in spelling, see Castles, Holmes, & Wong, Reference Castles, Holmes and Wong1997; Kreiner & Gough, Reference Kreiner and Gough1990).
To assess the memory for word-specific spellings, a list of 30 low-frequencyFootnote 2 irregularly spelled words was created. Monosyllabic words were taken from Ziegler et al.'s (Reference Ziegler, Stone and Jacobs1997) database. Only those words that had a unique spelling of the rhyme were included (e.g., plaid, niche, ache). Polysyllabic words were taken from an online phonics resource for adult English learners, English Is Soup! (Kent University Ohio Literacy Resource Center, 2008). This database lists the most regular spellings for each phoneme in English and provides lists of exceptional spellings (e.g., syrup, coyote, khaki). The complete list of words is given in Appendix B.
The second part of the test consisting of 25 nonwords was aimed at testing the knowledge of sublexical phonology–orthography mappings at different levels of granularity. Previous research has shown that spellers use knowledge about phonology–orthography correspondences at both the phoneme level and the level of larger subsyllabic units, for example, rhymes (Juul, Reference Juul2005; Perry & Ziegler, Reference Perry and Ziegler2004; Treiman & Kessler, Reference Treiman and Kessler2006). The nonword part of the test was designed to test participants’ sensitivity to both levels of regularities. The nonwords were designed in such a way that the vowel would have at least two competing spellings. One spelling would be the most typical spelling of the vowel across all contexts (“default vowel spelling”), whereas the other would be the most frequent spelling of the vowel within the context of the particular rhyme (“default rhyme spelling”). For example, the most frequent spelling for the vowel /e/ across all contexts is <a_e>, as in tape. However, rhymes /el/, /en/, or /eθ/, as in rail, pain, or faith, are most frequently spelled with <ai> (Kessler & Treiman, Reference Kessler and Treiman2001). Therefore, for the nonword /flen/, the default vowel spelling would be flane, whereas the default rhyme spelling would be flain. The number of default vowel spellings and the number of default rhyme spellings used in an individual's test would provide an indication of his/her sensitivity to the regularities at the phoneme and rhyme level, respectively. All of the data on default spellings of vowels and rhymes were taken from Kessler and Treiman (Reference Kessler and Treiman2001). The list of nonwords is given in Appendix B.
Procedure
Participants were tested individually in a soundproof room. Testing started with the lexical decision task. Auditory words and nonwords were presented to participants in a random order through Plantronics DSP 500 headphones. Participants were instructed to decide whether a stimulus was a real English word and press “yes” or “no” (labeled keys of a Dell RT7D50 keyboard) accordingly with their preferred hand. The speed of the response was emphasized. Twenty practice trials preceded the experimental trials in order to familiarize participants with the task. No feedback was given to participants during the experiment. The presentation and data collection were controlled by E-Prime 1.0 (Schneider, Eschman, & Zuccolotto, Reference Schneider, Eschman and Zuccolotto2002) running on a 3.79-GHz Intel Pentium computer.
Upon completion of the lexical decision task, participants took the spelling test. The test was administered in the form of a recorded dictation. A male speaker from California recorded the test items. The recording facilities and equipment were the same as for the lexical decision items. The recording was edited in Praat 4.6.21 (Boersma & Weenink, Reference Boersma and Weenink2007) to create a single sound file with the list of words followed by the list of nonwords and each item repeated twice with a 2-s interval between the repetitions and between items. The participants were instructed to listen to the recorded dictation and type items into a text fileFootnote 3 as they listened. The recording was played through headphones using the Windows Media Player. The Microsoft Notepad application was used to create text files.
Participants
Forty-nine undergraduate students (ages 18–22; 35 females, 14 males) from Cornell University were recruited. All of them were native English speakers, even though most of them had exposure to a second language through foreign language instruction in school. Six participants were early bilinguals: they learned English simultaneously with another language. (Data from these six people were originally analyzed separately from the rest of the data; however, because early bilinguals' performance was not significantly different from the performance of the other participants, the data from early bilinguals were introduced back into the sample. Further statistical analyses reported in the paper are based on the data from all 49 subjects.) None of the participants reported any hearing problems, learning disabilities, or language disorders. Subjects either received extra credit for a psychology course or were paid $5 for participation.
RESULTS
Lexical decision task: Accuracy and reaction times (RTs)
Accuracy and latency of each response measured from the stimulus onset were collected. One word (squad) was excluded from the analysis because of error rate higher than 50%. Consistent and inconsistent words were still well matched for all variables controlled for, except duration and phonological neighborhood density. (Table 1 lists the linguistic characteristics of the two groups of stimuli calculated with squad excluded.)
The RTs of incorrect responses (10.3% of all responses) were removed from the analysis. Outlier RTs beyond 3 SD from the overall mean RT of correct responses (>1828 and <105 ms) were discarded, which accounted for 1.7% of all correct responses. The descriptive statistics for the performance on consistent and inconsistent words were error rates of 6.7% and 13.0% and adjusted mean RTs (SE) of 901 (11.4) and 940 (13.4) ms, respectively, and for nonwords were error rates of 11.5% and 9.4% and adjusted mean RTs (SE) of 970 (15.0) and 972 (16.2) ms, respectively. The adjustment procedures for the RT means for words adjusted for the covariates are described below.
The first step of data analysis consisted of procedures traditionally used in psycholinguistic research, namely, by-subject (t 1) and by-item (t 2) comparisons performed on mean error rates and mean correct RTs. The difference in error rates between consistent and inconsistent words was significant both by subject and by item: t 1 (48) = 5.66, p < .0001; t 2 (47) = 2.15. p = .04.
The effect of consistency on RTs failed to reach significance in both analyses: t 1 (48) = 1.64, p = .11; t 2 (47) = 1.01, p = .32. Note, however, that these analyses did not account for the differences in duration and phonological neighborhood density between consistent and inconsistent words, which might have masked the effect of consistency on RTs. Therefore, covariance analysis was performed on the item means with consistency as an independent variable and duration and phonological neighborhood density as covariates. To account for the possibility that the effect of duration and/or phonological neighborhood density on RTs interacts with that of consistency, two interaction variables, the duration by consistency and phonological neighborhood density by consistency, were also entered into the model. The analysis showed that when accounting for the covariates, inconsistent words produced RTs that were significantly longer than RTs of the responses to consistent words: F (1, 43) = 4.26, p = .05. The effect of duration was also significant: F (1, 43) = 14.75, p = .0004. The other three covariates were not significant in this analysis: phonological neighborhood density, F (1, 43) = 1.08, p = .30; phonological neighborhood density by consistency, F (1, 43) = .81, p = .37; duration by consistency, F (1, 43) = 1.82, p = .18).
There is no way to account for characteristics of items covarying with the experimental factor using the traditional by-subject t test or analysis of variance. However, the by-item approach, within which covariance analysis is possible, does not allow exploring individual differences in subjects’ performance because this analysis is based on averaging over subjects. One way to overcome this problem is to use linear mixed effects (LME) approach (e.g., Pinheiro & Bates, Reference Pinheiro and Bates2000), a statistical method that is starting to be employed in experimental psychology and psycholinguistics. The LME approach is not based on averaging: the model is fit directly to individual data points (e.g., RTs of individual responses). Similar to the traditional by-item analysis of covariance, it allows one to assess the effects of multiple characteristics of the items simultaneously; these characteristics are entered into the model as fixed effects. At the same time, like a by-subject analysis, the LME approach also captures the variability among subjects, which are included as random effects into the model.Footnote 4 (For a more detailed explanation of LME models and examples of their use in psycholinguistics and experimental psychology, see Baayen, Reference Baayen, Libben and Nault2004; Hoffman & Rovine, Reference Hoffman and Rovine2007.)
Thus, an LME model was used at the second step of data analysis. The RT of individual responses was entered as the outcome variable; consistency and the covariates of duration and number of phonological neighbors, as well as the interactions of consistency with the covariates, were included as fixed effects. Two random effects were also included: subject and subject by consistency interaction. The calculations were performed in JMP, Version 7 (SAS Institute, 1989–2007) using the restricted maximum likelihood method.
When accounting for the covariates and for the variability among subjects, the effect of consistency was highly significant: F (1, 58.2) = 13.51, p = .0005. Note that in comparison to the by-item analysis of covariance, the LME model produced much more statistically reliable results. The mean RT for consistent words was 39 ms shorter than the mean RT for inconsistent words when the means were adjusted for the covariates. Item means adjusted for covariates can be found in Appendix A.
The main effects of both covariates were also significant: RTs increased with acoustic duration and with phonological neighborhood density of words: F (1, 2051) = 127.70, p < .0001 and F (1, 2050) = 10.82, p = .001, respectively. The interaction effects were also found significant in this analysis: duration by consistency, F (1, 2051) = 13.70, p = .0002; phonological neighborhood density by consistency, F (1, 2051) = 4.71, p = .03. Both duration and phonological neighborhood density affected RTs to consistent words more than RTs to inconsistent words.
In sum, the results for words replicated previous findings regarding the effect of orthographic consistency on auditory lexical decision performance (Ventura et al., Reference Ventura, Morais and Kolinsky2007; Ziegler et al., Reference Ziegler, Petrova and Ferrand2008) showing that orthographically inconsistent words tend to produce longer RTs and more errors.
Results for nonwords were also consistent with previous findings: as in other lexical decision studies with adults (e.g., Ventura et al., Reference Ventura, Morais and Kolinsky2007; Ziegler & Ferrand, Reference Ziegler and Ferrand1998), the effect of consistency on error rates or RTs was not significant for nonwords either in by-subject or by-item analyses (all ts < 1). No further analyses were performed on nonwords because no linguistic characteristics controlled for in the experiment covaried with consistency of nonwords. The reasons why consistency affects processing of words but not nonwords in a lexical decision task are discussed in great detail by Ventura and colleagues (Reference Ventura, Morais and Kolinsky2007) and Ziegler and Ferrand (Reference Ziegler and Ferrand1998).
Individual differences in the size of the orthographic effect
In order to explore the question whether orthographic consistency influenced all participants’ performance in the same way, the size of the orthographic effect in the lexical decision task was estimated for each subject. This value was computed as the difference between a subject's mean RT for inconsistent words and the subject's mean RT for consistent words. The mean RTs used for this calculation were adjusted for the duration and neighborhood density covariates. (The means were produced by the statistical software as the result of fitting the LME model described above to the data.)
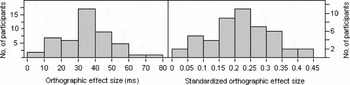
The orthographic effect size ranged from −36 to 72 ms (M = 39 ms, SD = 17 ms). The orthographic effect size was above zero for all participants with the exception of one. In other words, for all subjects but one, RTs to inconsistent words were on average longer than RTs to consistent words. The participant who was an exception was excluded from further analyses because his/her orthographic effect size was over 3 SD below the mean. The left panel of Figure 1 represents the distribution of the orthographic effect size across participants.
The distribution of orthographic effect size and the standardized orthographic effect size across individual participants.

The graph shows that the size of the orthographic effect was not uniform across individuals: it was strong for some participants and almost nonexistent for others. These individual differences cannot be fully attributed to the participants also differing in the average speed of their responses and in the range of response times. Thus, the right panel of Figure 1 shows that, when each participant's orthographic effect size was standardized (divided by the participant's standard deviation that was calculated based on the RTs of his/her correct responses to words), the orthographic effect size was still not uniform across participants, ranging from 0.03 to 0.41 SD. Participants’ average RTs did not predict the standardized orthographic effect size: F (1, 46) = 1.24, p = .27. Of course, differences between participants are expected in any study and may be caused by a whole range of factors that are not controlled for in the experiment. However, as previous research has shown (Baayen et al., Reference Baayen, Tweedie and Schreuder2002), there is also a possibility that individual differences in performance are not random, but instead reflect differences in the sensitivity to the experimental factors among participants. The question of whether individual differences observed in this study are purely random will be addressed further.
Spelling test
To assess the memory for word-specific spellings, the number of misspelled words was calculated for each participant. It ranged from 0 to 10 out of 30 possible (M = 2.8, SD = 2.5).
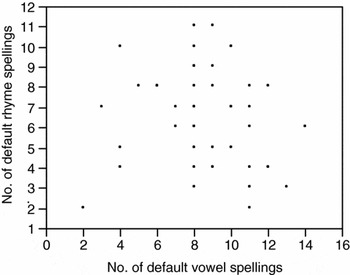
To assess the knowledge of sublexical spelling regularities at the phoneme and rhyme levels, two additional scores were calculated for each participant: the number of nonwords for which the default rhyme spelling was used (the most frequent spelling of the rhyme across all of the words that have that rhyme), and the number of nonwords for which the default vowel spelling was used (the most frequent spelling of the vowel across all words). The former score ranged from 2 to 11 per subject (M = 6.3, SD = 2.4), the latter score ranged from 2 to 14 (M = 8.6, SD = 2.5). Figure 2 shows that the two scores were not significantly correlated (r = .18, p = 0.23): one could use the knowledge about regularities at both phoneme and rhyme level, prefer the default vowel strategy over default rhyme strategy or vice versa, or be low on both default vowel and default rhyme spellings.
The relationship between the number of default vowel nonword spellings and the number of default rhyme nonword spellings in individual participant's tests.

Correlations between spelling scores and the size of the orthographic effect in the lexical decision task
In order to test whether the size of orthographic effects in auditory word recognition is correlated with listeners’ orthographic skills, a linear regression model was fit to the data with participants’ three spelling scores as predictors and their orthographic effect size as the response. The standardized orthographic effect size values were used for this calculation. The number of misspelled words was a significant predictor of the orthographic effect size: F (1, 44) = 5.74, p = .02. The fewer words a subject misspelled, the stronger the effect of orthography on lexical decision performance tended to be. In other words, the difference between the mean RT for inconsistent words and the mean RT for consistent words increased as the number of misspellings decreased. The number of default vowel nonword spellings was also a significant predictor: F (1, 44) = 5.00, p = 0.03. The more nonwords the subject spelled with the default vowel, the weaker the orthographic effect in the lexical decision task tended to be. The effect of the number of default rhyme nonword spellings was not significant: F (1, 44) = 0.15, p = .70; however, the power of this test was extremely low (0.07). Together the three spelling test scores accounted for 15% of the variance in the orthographic effect size.
To further understand the relationship between spelling skills and lexical decision performance, the associations of subjects’ spelling scores with subjects’ mean RTs to consistent words and their mean RTs to inconsistent words were analyzed. The two spelling scores that predicted the orthographic effect size (the number of misspelled words and the number of default vowel nonword spellings) and standardized RT values were used for this analysis. The two spelling scores were entered simultaneously as predictors, first with mean RTs to consistent words as the response, then with mean RTs to inconsistent words as the response. Both spelling scores were positively associated with RTs to consistent words and negatively associated with RTs to inconsistent words. The number of misspelled words was significant in both cases: F (1, 45) = 6.03, p = .02 and F (1, 45) = 4.50, p = .04, respectively. The number of default vowel nonwords spelling was a marginally significant predictor of RTs to consistent words, F (1, 45) = 3.20, p = .08, and a significant predictor to of RTs to consistent words, F (1, 45) = 5.98, p = .02.
To summarize these results, subjects who made fewer misspellings and had fewer default vowel nonword spellings tended to have a stronger orthographic effect in the lexical decision task, which was measured as the difference between a subject's mean RT to inconsistent words and the subject's mean RT to consistent words. The explanation for this is that the participants who made more spelling errors and participants who spelled more nonwords with the default vowel spelling were faster on inconsistent words and slower on consistent words than participants who made fewer errors and participants who spelled fewer nonwords with the default vowel spelling.
In sum, the data seem to suggest that the individual differences in the size of the orthographic effect in spoken-word recognition are not purely random and that the spelling proficiency at the lexical and sublexical levels is a factor in these individual differences.
DISCUSSION
The goal of this study was to test the hypothesis that the size of orthographic influences on spoken-word recognition, previously found in literate adults, varies across individuals and is correlated with the listeners’ orthographic proficiency. The findings from this study can be divided into three categories.
1. Confirmation of previous results. The effect of feedback orthographic consistency on auditory word recognition was observed in American English thus corroborating recent findings from British English (Ziegler et al., Reference Ziegler, Petrova and Ferrand2008) and the results obtained in French and Portuguese (Perre & Ziegler, Reference Perre and Ziegler2008; Ventura et al., Reference Ventura, Morais and Kolinsky2007). Consistency was found to affect both error rates and latencies of lexical decision responses in the present study.
2. Methodological findings. The implementation of the LME approach in the analysis of the data once again demonstrated the advantages of this method over the traditional by-item analysis of covariance. By accounting for between-subject variability, this approach detected a strong effect of orthographic consistency on lexical decision latencies, which in the traditional by-item analysis had significance at the 0.05 cutoff level and would not have been detected in a smaller sample. In addition, unlike the LME approach, the traditional by-item regression analysis was not sensitive enough to detect the significant interactions of consistency with the duration and phonological neighborhood density covariates on lexical decision latencies.
3. The finding of individual differences in the size of the orthographic effect in auditory word recognition, which were related to the participants’ lexical and sublexical orthographic skills. The analysis of individual subjects’ performance in the lexical decision task revealed that the size of the effect of orthography on lexical decision latencies was not uniform across subjects. It is not at all surprising, of course, that different people produce different results in an experiment and it may be due to a whole number of chance factors not controlled for in the experiment. Therefore, conclusions regarding individual differences warrant a certain amount of caution, especially considering that the effect of interest itself was quite small relative to the variance in the data set. However, the main result of this study, namely, the correlations between the size of the orthographic influence in an individual's spoken word processing and the individual's performance in the spelling test, seems to suggest that the discovered individual differences are not purely random. They may instead reflect the differences in participants’ sensitivity to orthographic factors in auditory processing and therefore should not be ignored by theoretical accounts of orthographic effects in auditory tasks.
In the present study, participants who made more errors when spelling irregular words showed less influence of orthography on lexical decision latencies than spellers who made fewer errors. These results are in agreement with findings by Castles et al. (Reference Castles, Holmes, Neath and Kinoshita2003), who showed that spelling ability was correlated with the magnitude of orthographic influences in metaphonological tasks. One possible explanation of the association is that in better spellers orthographic representations are stronger, that is, orthographic information is more salient, it is more easily accessed and activated and thus impacts auditory processing more than in poor spellers. Such an explanation suggests a causal relationship in which the strength of orthographic representations determines the size of orthographic effects in spoken-word recognition.
An alternative explanation, which suggests a different direction of causality, is also conceivable. One possible way that orthography is activated in spoken-word recognition is via the strong links between orthography and phonology established in the course of literacy acquisition, resulting in the integration of orthographic and phonological information. This integration leads to the activation of both visual and auditory information in reading as well as in auditory processing (Perre & Ziegler, Reference Perre and Ziegler2008). Weaker integration of phonological and orthographic information might be responsible for both less orthographic effects in auditory word processing and worse spelling performance.
The test of participants’ orthographic knowledge also included assessment of their sensitivity to sublexical spelling regularities; the relationship between this aspect of orthographic competence and the size of the orthographic effect the in the lexical decision task was analyzed. A significant association between these two variables was found. The less participants relied on the spelling regularities at the phoneme level, the larger the effect of orthographic consistency on lexical decision latencies tended to be. The most intuitive explanation of this trend is that orthographic consistency of lexical decision stimuli was defined at the level of rhymes, rather than on the phoneme level. People who pay more attention to orthographic regularities on the phoneme level might have been less sensitive to consistency manipulations on the rhyme level. This result suggests that future studies of the orthographic consistency effect should have consistency on the phoneme level controlled for.
The participants’ spelling skills partially explained the variance in the size of the orthographic effect in the auditory task, which seems to provide additional piece of evidence confirming that the difference in response latencies between consistent and inconsistent words was because of an orthographic factor rather than to some unknown covariate that affects RTs, on which consistent and inconsistent words were not matched (a criticism of the simple lexical decision task previously raised in the literature, e.g., in Taft et al., Reference Taft, Castles, Davis, Lazendic and Ngyen-Hoan2008). There was an association between sublexical spelling skills and the size of the orthographic effect in the auditory task, which also seems to be in agreement with the findings suggesting that the involvement of orthography in lexical decision is a sublexical process (Pattamadilok et al., Reference Pattamadilok, Perre, Dufau and Ziegler2009; Perre & Ziegler, Reference Perre and Ziegler2008).
CONCLUSION
The results from this study are consistent with the evidence from developmental research showing that influence of orthography on spoken language processing is a gradient phenomenon, the size of which is mediated by listeners’ experience with printed language (Ziegler & Muneaux, Reference Ziegler and Muneaux2007). Our results add to the existing findings by showing that the size of orthographic effects is gradient not only in children but also in adults and that it is associated with their orthographic proficiency. However, the exact explanation of this association has not been found.
The most important implications from the present findings go hand in hand with one limitation that the study shares with previous work of this kind. As in all previous research reporting an effect of orthographic consistency on auditory word processing, the participants in the present study were all college students. Even though for the majority of them the size of the orthographic effect in the lexical decision task was above zero, it is an open question whether generalizing these results over all literate people is valid. College students have extensive everyday exposure to printed language. As a consequence, orthographic information may be much more salient and have much stronger representations in college students than in people who have less exposure to print in their everyday lives. Given the associations between the strength of orthographic knowledge and the effect of orthography on spoken language, demonstrated in the present study, one may conjecture that in adults who have been long out of school and whose everyday activities do not involve much reading and writing (even though these people can read and write), orthographic effects in spoken word recognition may be very weak or nonexistent. It is crucial, therefore, that future research be more representative of the general literate population before we can safely conclude that “once reading is acquired, spoken word processing might no longer be the same” (Perre & Ziegler, Reference Perre and Ziegler2008, p. 136).
APPENDIX A
Lexical decision stimuli and item means

Note: Word means are adjusted for duration and phonological neighborhood density and their interaction with consistency.
aExcluded because of the high error rate.
APPENDIX B: SPELLING TEST STIMULI
Words: ache, diaper, beige, bruise, bury, censure, choir, cough, coupon, coyote, crepe, depot, flourish, forfeit, gourmet, khaki, larvae, mourn, neuron, niche, plaid, quartz, quiche, scissors, suave, suede, synonym, syrup, waltz, yacht
Nonwords: /tʃaınd/, /dϵlθ/, /dɑm/, /drel/, /drɑʊ/, /flen/, /fɑʊn/, /frɔ/, /hɑm/, /kif/, /krild/, /krϵθ/, /krɑʊl/, /mɔt/, /notʃ/, /peθ/, /praıt/, /pru/, /rof/, /ʃri/, /spaıld/, /θɔn/, /trɔt/, /tʌv/, /twaıt/
ACKNOWLEDGMENTS
The author thanks Professor Barbara Lust, Professor Abigail Cohn, and three anonymous reviewers for their valuable comments on an earlier version of this manuscript; Professor James Booth for his advice on statistical analyses; and Sarah Spencer for her help in data collection.