Introduction
Barley (Hordeum vulgare L.) is a widespread crop in semi-arid areas of West Asia and North Africa (WANA), where it is usually harvested for grain and straw, and sometimes grazed when the plants are still growing. Straw is normally collected, chopped, stored and fed to sheep and other ruminants, together with grain and other supplements during winter in the same or later years (Nygaard, Reference Nygaard and Lora1983; Nordblom et al., Reference Nordblom, Goodchild, Shomo, Gintzburger and Renard1997).
Interest in barley straw quality at the International Center for Agricultural Research in the Dry Areas (ICARDA) began in the 1980s following farmers' complaints that the straw of Beecher variety was ‘too tough’ for feeding to sheep (Nygaard, Reference Nygaard and Lora1983). Since then, at least 11 studies of straw quality using up to nine barley genotypes have been performed at ICARDA and tested for straw quality in the laboratory, for weight loss after incubation inside the rumen (in situ), and in trials of digestibility and voluntary intake (in vivo) (Goodchild, Reference Goodchild1997).
In WANA, cereal straw averages 0.60 of the total above-ground biomass (Krausmann et al., Reference Krausmann, Erb, Gingrich, Lauk and Haberl2008), equivalent to about 0.45 of the total metabolizable energy (ME) in the mature crop (Alderman and Cottrill, Reference Alderman and Cottrill1993). The major component of cereal straw is plant fibre; in research at ICARDA, barley straw has contained 730–860 g/kg of neutral detergent fibre (NDF) in the dry matter (DM).
Because the digestibility of straw fibre largely determines its nutritive value for ruminants, much research has prioritized improvement using chemical treatment (Jackson, Reference Jackson1977). ICARDA's position was that cereal varieties can be selected to have straw quality approaching that obtainable by chemical treatment (Colucci et al., Reference Colucci, Falk, Macleod and Grieve1992). However, most research at ICARDA previous to that reported here did not estimate heritability or genetic progress, because each trial evaluated straw harvested in only one year and location. In the literature, the only reports of the heritability of straw quality were found for wheat straw (Jensen et al., Reference Jensen, Magid, Hansen-Møller, Andersen and Bruun2011; Joshi et al., Reference Joshi, Barma, Hakim, Kalappanavar, Naik, Biradar, Prasad, Singh and Blümmel2019). The research reported here is designed to address this lack of understanding.
The intake of ME determines the performance of ruminants fed straw-based rations (Ørskov et al., Reference Ørskov, Reid and Kay1988; Fonseca et al., Reference Fonseca, Dias-da-Silva and Ørskov1998), and is proportional to the intake of digestible organic matter (DOMI) (Alderman and Cottrill, Reference Alderman and Cottrill1993). Voluntary intake and digestibility of straws generally vary more between years or locations than between genotypes (Kernan et al., Reference Kernan, Coxworth, Crowle and Spurr1984; Capper et al., Reference Capper, Thomson, Herbert, Reed, Capper and Neate1988; Schulthess et al., Reference Schulthess, Tedla, Mohamed-Saleem and Said1995; Schiere et al., Reference Schiere, Joshi, Seetharam, Oosting, Goodchild, Deinum and Van Keulen2004). This does not preclude improving straw quality through crop breeding, because progressive genetic gain can be obtained by successive cycles of selection. Moreover, controlling growing conditions in WANA is difficult without irrigation.
Selection of barley genotypes for straw nutritive value should be emphasized when improvement is most needed, as found under favourable growing conditions. These reduce straw quality and increase straw yield (Capper et al., Reference Capper, Thomson, Herbert, Reed, Capper and Neate1988; Thomson et al., Reference Thomson, Herbert and Rihawi1993), leading to surplus straw, which is normally stored for years of scarcity or is sold. Therefore, selecting genotypes for straw quality should ideally be done under relatively high-yielding conditions.
The current paper addresses a three-part hypothesis. First, that traits based on one or more laboratory or in situ tests of straw quality are heritable for barley genotypes grown under varying precipitation or fertilization regimes. Second, that one or more of these traits can be used to achieve a genetic gain in DOMI, for rations having nitrogen contents typically fed by farmers in WANA (Capper et al., Reference Capper, Thomson and Rihawi1989; Herbert et al., Reference Herbert, Thomson and Capper1994; Nordblom et al., Reference Nordblom, Goodchild, Shomo, Gintzburger and Renard1997). Third, that test results reveal the properties of straws that constrain genetic gain in DOMI.
Materials and methods
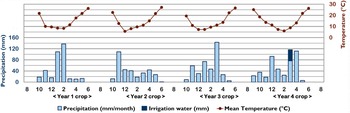
The trials were conducted for four years at the ICARDA research farm near Tel Hadya, Aleppo Province, northern Syria (36°56′E, 36°01′N, 290–300 m above mean sea level, calcixerollic xerochrept soils), in a field where lentils or chickpeas had been grown in the previous year. The weather conditions during the four years of the trial are shown in Fig. 1. The total precipitation (including supplementary irrigation) in successive years beginning in August was 358, 330, 395 and 474 mm, with precipitation in the four months January through April being 269, 136, 291 and 300 mm. In all years except year 2, the precipitation was greater in these four months than the average between 1980 and 2010 (Sommer, Reference Sommer2011). In all four years, the mean temperature averaged 10.4°C, close to the 30-year average.
Colour online. Monthly precipitation, mm (including irrigation water) and mean temperature, °C, in years 1 through 4, during the straw quality trial of 32 genotypes of barley at ICARDA, Northwest Syria. Crops were planted in late December (month 12) and harvested in early June (month 6).

Crop management procedures
Each year, ≥3.2 ha of the chosen field were divided into four replicates. Each barley genotype was grown in one plot of ≥250 m2 in each replicate. Seed was sown in 12 rows spaced 250 mm apart in late December each year using a self-propelled plot drill (Egil Øyjurd, Norway) at a rate of 120 kg/ha. Genotypes were allocated to plots in a randomized alpha-lattice layout, with eight plots per block (Alphagen.exe, SASS, 1987).
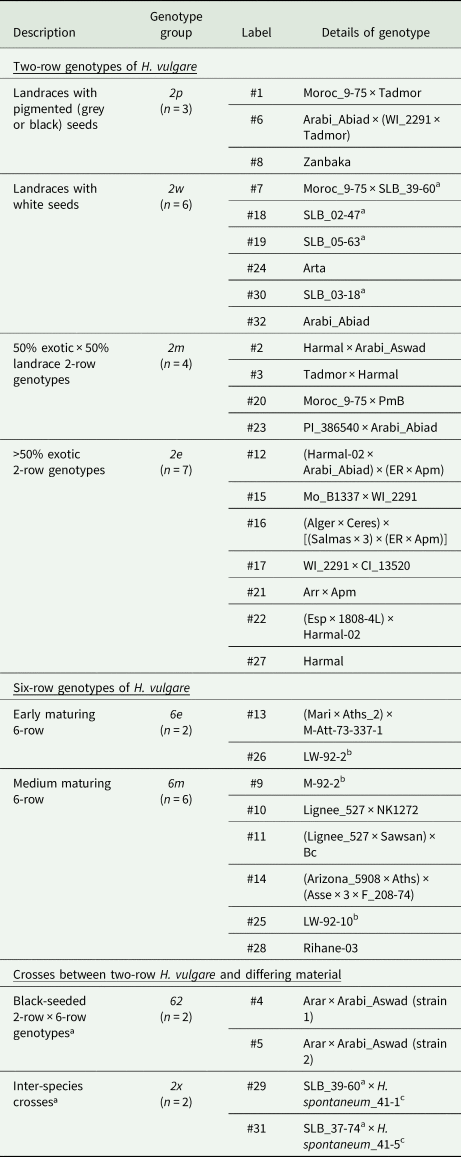
The 32 genotypes of barley (H. vulgare L.) are listed in Table 1. These included two-row and six-row genotypes and crosses between them. Some of the genotypes were landraces, some had been developed outside the WANA region (‘exotics’), and some were crosses between the two provenances. There was variation in time to maturity. Two genotypes were crosses between a black-seeded H. vulgare landrace and H. spontaneum (K. Koch) Thell, the wild progenitor of cultivated barley. The above characteristics, together with seed pigmentation, were used to classify the genotypes into eight groups (Table 1).
Details of the 32 Hordeum sp. genotypes fed to sheep in the reported trial, showing the genotype groups and genotype labels used in the text

a SLB denotes Selected Local Barley.
b These genotypes had been recently developed.
c H. spontaneum (wild barley) is the progenitor of H. vulgare (cultivated barley).
Urea (50 kg N/ha) and triple superphosphate (45 kg P2O5/ha) fertilizers were applied in January, except in year 3 when no fertilizer was used. Supplementary irrigation water (≥40 mm) was applied during March in year 4. An aqueous solution of a chlorophenoxy selective herbicide (Duplosan SuperTM Nufarm) was sprayed in March every year.
In the week before harvest, whole plants were cut at ground level from random 0.4-metre lengths of each row of plants within each plot. They were separated into grain, chaff and straw, and the weights of each fraction were used to estimate the yields of grain and straw. The remaining plants were harvested in early June using a small plot combine harvester (Hans-Ulrich Hege, Waldenburg, Germany). The straw was next chopped to a median length of approximately 20 mm using a tractor-driven rotary chopper made by a local engineer.
In vivo trials
Each year, 32 castrated male Awassi sheep aged 4.0 (s.d. 1.4) years weighing 50.4 (s.d. 7.8) kg were orally dosed with 9 mg of Ivermectin anthelmintic (Boehringer Ingelheim Animal Health), housed in individual metabolism crates, and fed straw-based diets supplemented with 20 g/d of a vitamin-mineral mixture for four 21-day periods. The genotype fed to each sheep was changed between successive periods according to a randomized alpha lattice design with eight sheep per block. Nitrogen (N) supplementation alternated with no N supplementation in successive periods. Each sheep was fed 120% of their mean straw intake in the previous three days, with or without the N supplement. In years 1 and 2, the N supplements were cottonseed meal (3.00 g/kg body weight) or urea (0.30 g/kg body weight). In years 3 and 4, the supplement was solely cottonseed meal (3.00 g/kg body weight). DOMI was determined in the last 10 days of each 21-day period, during which daily aliquot samples of offered straw were taken, pooled, subsampled and analysed in the laboratory. The remaining sampled straw was used for in situ trials. On the days after feeding, faeces were collected and weighed, and aliquot samples of faeces and refused straw were weighed, dried, reweighed and analysed. Drying was for 48 h at 65°C in a forced-draught soil oven. DOMI was calculated as the difference between straw organic matter (OM) intake and the faecal OM output attributable to straw. When cottonseed meal was fed, it was assumed that 0.33 g/g of the dry matter of the fed cottonseed meal appeared in the faeces (Alderman and Cottrill, Reference Alderman and Cottrill1993).
In situ trials
Four Awassi sheep weighing 50 kg on average were fitted with permanent cannulas (diameter 40 mm) that gave access to the dorsal sac of the rumen. Weighed and soaked 3-gram samples of each straw genotype in polyester mesh bags were incubated in the rumen for 0, 6, 12, 18, 24, 36, 48, 72 or 120 h. This was replicated four times each year according to a randomized alpha-lattice design. In successive 21-day periods, the sheep were fed one of two alternating diets composed of supplemented landrace barley straw. One diet (Bar) contained 680 g of barley grain and 40 g of a mineral-vitamin supplement per kg of straw. The other diet (Mix) contained 460 g of barley grain, 280 g of cottonseed meal and 40 g of mineral-vitamin supplement per kg of straw. The concentration of total Kjeldahl nitrogen (TKN) in the respective rations was 9.4 and 14.6 g N/kg DM. The TKN concentration in the Mix diet was 25 g N per kg of in vitro digestible DM; this was intended to provide sufficient N for microbial protein synthesis (Ørskov, Reference Ørskov, Givens, Owen, Axford and Omed2000), but did not consider protein degradability in the rumen (Alderman and Cottrill, Reference Alderman and Cottrill1993). Dry matter loss (DML) was calculated as the proportion of the dry weight of straw samples lost from the mesh bag after soaking, incubation in the rumen, washing and oven-drying. Also, samples of rumen fluid were taken by syringe through the cannula for ammonia determination before and 6 h after feeding. Further details of the design and procedures are given in Supplementary Material S1.
Chemical and in vitro analyses
All analysed samples had been taken during the in vivo trials. NDF, acid detergent fibre (ADF) and acid detergent lignin (ADL) were determined in Fibertec 1020 M6 apparatus (Foss Analytics, Hilleroed, Denmark DK-3400) by the methods of Goering and van Soest (Reference Goering and van Soest1970). The TKN content of ration components and filtered rumen liquor was determined in Kjeltec apparatus (Foss Analytics). In vitro digestibility, expressed as digestible OM in the DM, was determined by the method of Tilley and Terry (Reference Tilley and Terry1963).
Data analysis
Analyses of variance (ANOVAs) were performed using PROC GLM (SAS, 2003). The statistical significance of genotypes and years was tested using the genotype by year interaction as the error term, so that significant genotype effects could be interpreted as repeatable between years (Bliss, Reference Bliss1967).
DOMI was analysed by PROC GLM (SAS, 2003) according to the alpha lattice statistical design, using body weight as a covariate.
In situ parameters were calculated from the mean DML values for genotype-by-year combinations. To determine whether supplementation affected the relative DML of genotypes, the genotype-by-ration interaction term was tested against its interaction with year in an ANOVA.
Four in situ parameters (A, DMLp, c and Lag) (Dhanoa, Reference Dhanoa1988) were fitted to values for DML at incubation times between 0 and 120 h, using the SOLVER function of Microsoft EXCEL. The model was:

where τ (tau) is the greater of [Duration of incubation minus Lag] and zero. Parameter A is assumed to comprise water-soluble cell contents and fine particles that exit the polyester fabric bag before microbial fermentation begins (Ørskov et al., Reference Ørskov, Reid and Kay1980). Parameter DMLp (potential DML) is the sum of parameter A and the slowly degradable fraction (called B in Ørskov, Reference Ørskov, Givens, Owen, Axford and Omed2000). Parameter c is the fraction of the remaining slowly degradable DM that disappears from the bag in one hour. Lag is the incubation time at which microbial fermentation appears to begin. When the model includes Lag, parameter A and ‘zero-hour’ DML are practically identical, so that parameter A (but not DMLp) differs from the value generated by the three-parameter model (Dhanoa, Reference Dhanoa1988).
Each genotype with a parameter value that was significantly larger or smaller than the parameter's mean value for the other 31 genotypes was called a ‘deviant’ genotype. These genotypes were identified using a 2-tailed Student's t test with a Bonferroni-adjusted P-value of 0.050.
Calculation of genetic gains
For each trait, broad-sense heritability (h 2) (Singh et al., Reference Singh, Ceccarelli and Hamblin1993) was calculated from the variance components (s 2) for genotype and genotype-by-year interaction, where s 2 had been calculated by the method REML of PROC VARCOMP (SAS, 2003):

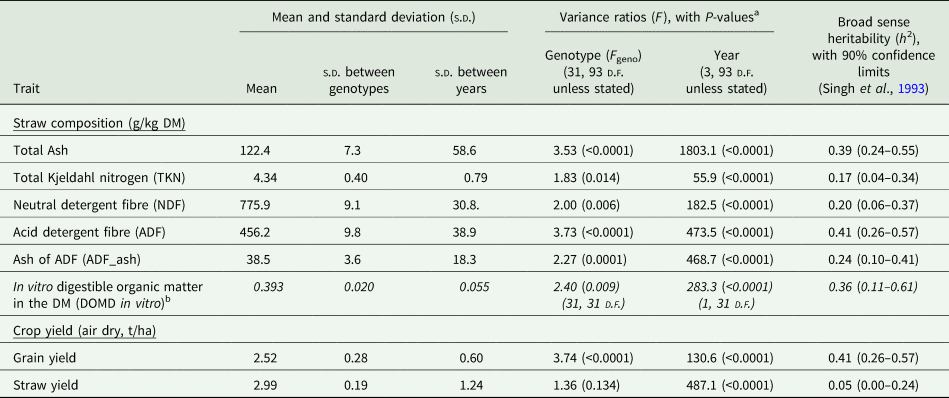
The confidence intervals (C.I.) and standard errors of h 2 were calculated without adjustment for bias by the method of Singh et al. (Reference Singh, Ceccarelli and Hamblin1993). For DOMI, indicator traits, grain yields and straw yields, the values of h 2 and their C.I. are shown in Tables 2, 3 and 4, and the variance components for genotype, year, and their interaction are shown in Supplementary Tables S3.1 and S3.2.
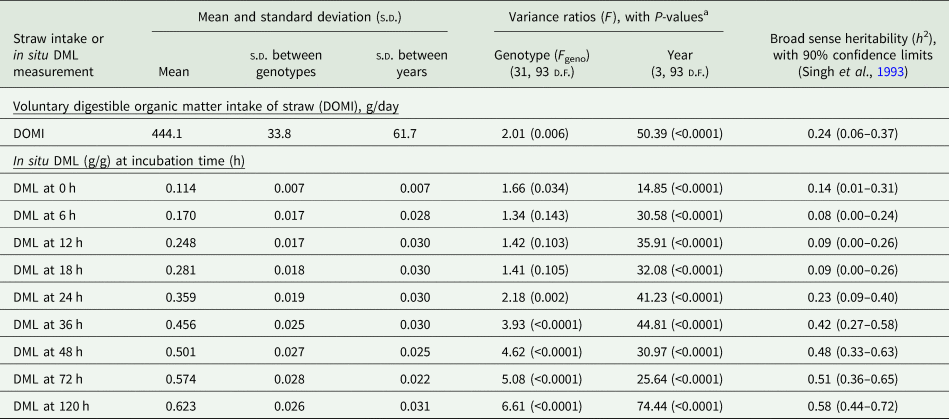
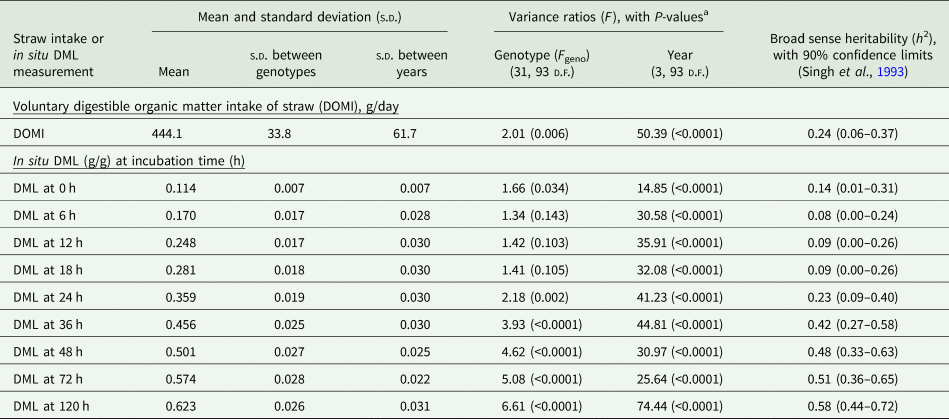
Means, standard deviations, variance ratios and broad-sense heritabilities of digestible organic matter intake and in situ dry matter loss (DML) at nine incubation times, for 32 genotypes of barley straw grown in four years
a The denominator for the genotype and year variance ratios was the genotype-by-year interaction. The residual variance was smaller than the genotype-by-year interaction (See Supplementary Material S3). P-values have not been adjusted for familywise error.
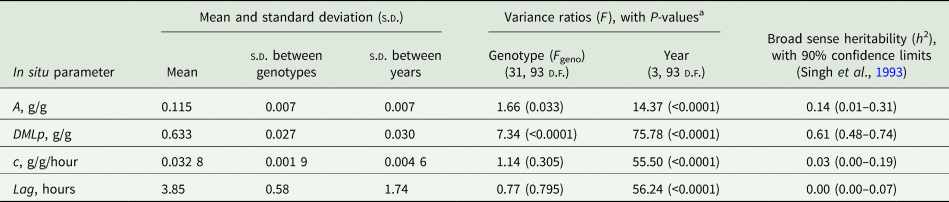
Means, standard deviations, variance ratios and broad-sense heritabilities of four in situ dry matter loss parameters, for 32 genotypes of barley straw grown in four years

a The denominator for the genotype and year variance ratios was the genotype-by-year interaction. The residual variance was not calculated. P-values have not been adjusted for familywise error.
Means, standard deviations, variance ratios and broad-sense heritabilities of laboratory analyses and crop yields, for 32 genotypes of barley straw grown in four years

Except where the results are italicized, the traits were measured in all four years.
a The genotype-by-year interaction was used as the denominator for the genotype and year variance ratios. P-values have not been adjusted for familywise error.
b By the method of Tilley and Terry (Reference Tilley and Terry1963), in Years 3 & 4 only.
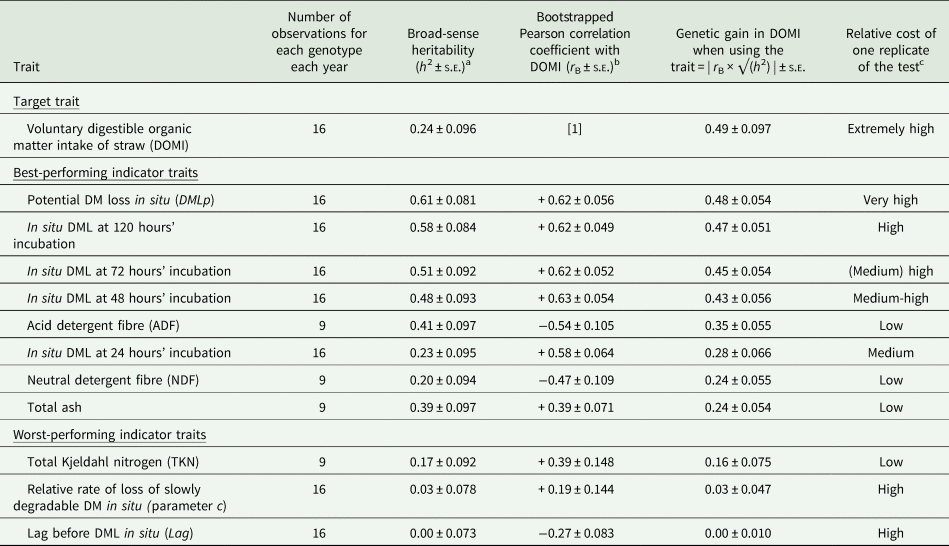
The relative genetic progress (i.e., genetic gain) in DOMI, which depends on h 2 and the trait's bootstrapped Pearson correlation coefficient with DOMI (r B), was calculated as follows:

The correlation coefficients and their standard errors shown in Table 5 were obtained using 200 repetitions of block bootstrapping, in which data were sampled (with replacement) within groups formed by year and, where appropriate, diet type. Because the heritability, correlation and standard error (s.e.m.) values have been calculated from the mean results of replicated tests, reducing the number of replications would reduce the precision of predictions. Table 5 also illustrates the ranking of test costs, without suggesting actual costs.
The relative genetic gain in voluntary digestible organic matter intake of barley straw (DOMI), observed and when indicator traits for DOMI were used; calculated from the Pearson correlation coefficient between DOMI and the trait, and the square root of the broad-sense heritability of the trait, for 32 barley genotypes grown in four years

a The s.e.s of h 2 values have been calculated using the formulae of Singh et al. (Reference Singh, Ceccarelli and Hamblin1993), without correction for bias.
b The values for r B and their s.e. have been calculated by bootstrapping using 200 iterations. Because bootstrapping calculations are affected by the variances of DOMI data and indicator trait data, the absolute values of r B are smaller than those of r calculated from overall means in Supplementary Tables S3.1 and S3.2.
c The assumed cost of tests: digestible intake trial > in situ parameter DMLp > in situ DML (varying by duration of incubation) > laboratory tests.
Results
Voluntary intake
DOMI was moderately heritable (h 2 = 0.24, unadjusted P = 0.017) (Table 2). The digestibility of straw is not reported here, because the sheep had intentionally not been fed a maintenance ration. There was a significant genotype-by-year interaction in DOMI, and the standard deviation of DOMI was larger when straw was supplemented with cottonseed meal than when it was not.
In situ dry matter loss
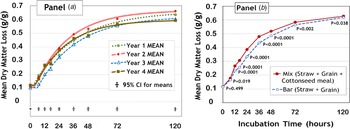
Yearly mean DML by incubation time, and curves calculated from in situ parameters fitted to these means, are illustrated in Fig. 2 panel A. Clear differences between genotypes were noted at 24 h of incubation (variance ratio for genotype, Fgeno, = 2.18, unadjusted P = 0.002), after which Fgeno increased from 3.93 to 6.61 for at least 36 h of incubation (P < 0.0001) (Table 2). Although the values for Fgeno were smaller than F for years, the s.d.s for genotype and year were broadly similar at 36 or more hours of incubation. For other indicator traits, the s.d.s between years were larger than those for genotypes by a median factor of 1.8, with a large range (0.8 to 8.0) (Tables 3 and 4). The largest factors were 2.8 to 3.9 for in vitro digestibility, NDF, ADF and Lag, and 8.0 for total ash.
Colour online. Mean in situ dry matter loss from 32 genotypes of barley straw at nine incubation times (zero through 120 h): (a) by year, with 95% confidence intervals, and (b) by type of diet fed to the cannulated sheep.

Among the in situ parameters, genotypes differed only for DMLp (P < 0.0001) and (to a lesser extent) parameter A (unadjusted P = 0.034). The values for all four parameters varied by year (P < 0.0001; Table 3). Mean values of these parameters for each genotype and each year are shown in Supplementary Table S2.1. DMLp was closely correlated with 120-hour DML (r = 0.988, P < 0.0001), and in situ parameter A was practically identical to the zero-hour DML. The Lag parameter could be predicted from DML at 6 h of incubation (r = −0.60, P < 0.0001), and parameter c could be predicted from DML at 48 and 120 h (R 2 = 0.51, P < 0.0001).
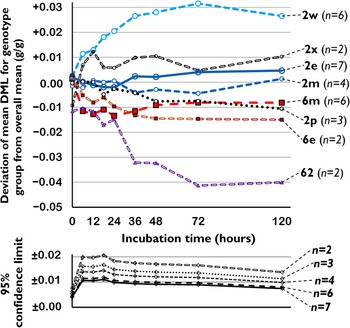
The differences between the mean DML for each genotype group and the overall mean are shown in Fig. 3 by incubation time. Differences between groups were evident at 36 h of incubation and continued thereafter. The six 2-row white-seeded landraces (group 2w) showed the largest mean DML, and the two crosses between row types (group 62) showed the smallest mean DML. The other six groups had intermediate and not significantly different values of DML. There are, however, suggestions that row type, local provenance, crossing with wild barley, and seed pigmentation, all affected DML.
Colour online. Differences between the four-year mean in situ dry matter loss (DML) and the overall mean DML at each incubation time, for each of the eight genotype groups of Hordeum spp. The first character denotes the row type of H. vulgare; 2p are landraces with pigmented seeds; 2w are landraces with white seeds; 2m are crosses between landraces and exotic genotypes; 2e are crosses with predominantly exotic parentage; 6e and 6m are respectively early- and medium-maturing genotypes; 62 are crosses between a black-seeded 2-row and a 6-row exotic genotype; 2x are crosses between a 2-row landrace and H. spontaneum. The lower chart shows the upper 95% confidence limit for each size of genotype group.

When assessed by parameter DMLp, seven ‘deviant’ genotypes were found (Supplementary Table S2.1, shaded). Four of them had above-average DMLp, comprising three white-seeded two-row landrace entries in group 2w (#7, #19 and #32) and one exotic two-row entry in group 2e (#15). The below-average ‘deviant’ genotypes were #5, #8 and #27; these were a 6-row × 2-row cross (group 62), a 2-row landrace with pigmented seeds (group 2p) and a 2-row exotic genotype (group 2e), respectively.
There were five indicator traits for which the calculated relative genetic gain for improving DOMI was at least 0.35 on a scale from zero to 0.49 (Table 5). Their broad-sense heritabilities (h 2) were between 0.41 and 0.61 and the absolute values of their (bootstrapped) correlation coefficients with DOMI were between 0.54 and 0.62. On the other hand, using TKN as an indicator trait would cause the genetic gain achieved to be around one-third of the gain achievable using potential DML because of its low h 2 and low bootstrapped correlation with DOMI. Using the in situ parameter c or Lag as an indicator trait would not achieve any significant genetic gain.
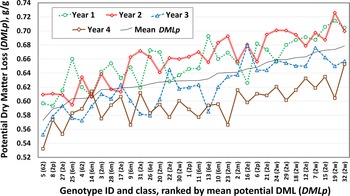
The estimates of DMLp for genotypes in each year tended to increase with their DMLp ranking in the whole trial (Fig. 4). The slopes for DMLp in years 1 through 4 against the mean DMLp in the other three years were + 0.85 (s.e.m. 0.155), + 1.03 (0.156), +0.98 (0.152), and +0.54 (0.117), all P values being <0.0001. Although the slopes did not differ significantly (P = 0.222), the slope for year 4 was noticeably smaller than the slopes in the other three years. When parameters A, c and Lag were evaluated in a similar manner, the correlations were not significant (P > 0.250).
Colour online. Potential in situ dry matter loss (DMLp) for each of 32 genotypes grown in each of four years, plotted against the rank of the genotype's mean DMLp in the whole trial.

Effects of TKN in the in situ trials
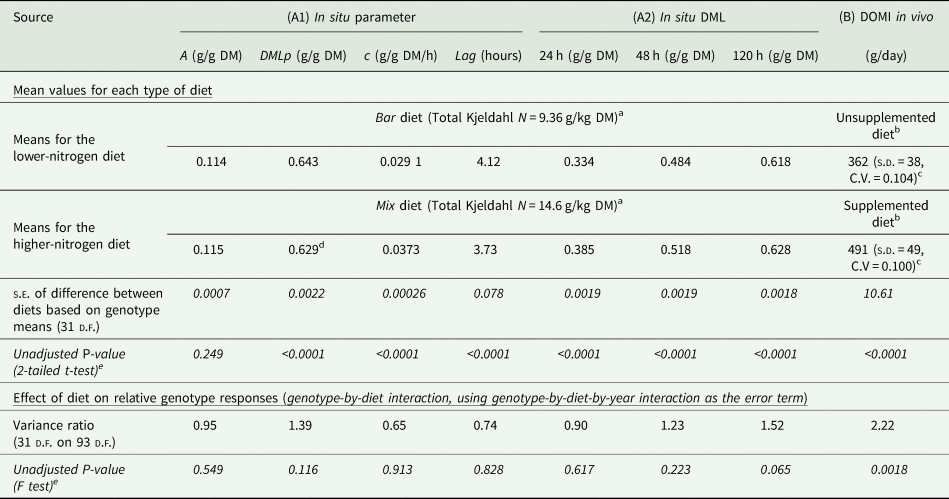
Rumen ammonia N immediately before feeding was 45 (95% C.I. 38–52) mg/l in sheep consuming the Bar diet and 112 (103–120) mg/l in sheep consuming Mix. Six hours after feeding, it had fallen to 12 (11–13) and 45 (23–67) mg/l in sheep fed the respective diets. In situ DML was larger with the Mix diet than with the Bar diet, the largest effects occurring between 12 and 48 h of incubation (Fig. 2 panel B). Parameter c with the Mix diet was greater than with the Bar diet by a factor of 1.28 (P < 0.0001) (Table 6), so that half of the slowly degradable DM disappeared in 22.6 h instead of 29.1 h. The Lag parameter was smaller with the Mix diet than with the Bar diet by 0.4 h (P < 0.0001).
Effects of supplementing 32 genotypes of barley straw grown in four years with dietary nitrogen: (A1) on four parameters of in situ dry matter loss (DML), (A2) on in situ DML at three incubation times, and (B) on voluntary digestible organic matter intake in vivo (DOMI)

a The Bar diet consisted of straw, barley and vitamin-mineral mixture, and the Mix diet also contained cottonseed meal.
b The unsupplemented diet consisted of straw and vitamin-mineral mixture, and the supplemented diet also contained cottonseed meal or urea.
c C.V. denotes the coefficient of variation between genotype means.
d The negative effect of the Mix diet on parameter DMLp is not reflected in the DML at 120 h and was probably a curve-fitting artefact.
e P-values have not been adjusted for familywise error.
For each 1.0 g/kg TKN increment in the dietary DM, parameter c increased by 0.0015 g/g/h (95% C.I. 0.0011–0.0019). Sheep diet did not affect the ranking of genotypes for any in situ parameter, evidenced by the lack of interactions between genotype and sheep diet (P > 0.100, Table 6). DOMI had shown a genotype-by-supplementation interaction, but it should be noted that correlations between indicator traits and DOMI were generally improved when a nitrogenous supplement was included in the diet (Supplementary Material S3).
TKN in straw varied by year more than it varied by genotype. The mean TKN concentration of straw in year 3, the year without fertilizer (3.38 g/kg), was lower than in other years (4.09–5.20 g/kg) (Supplementary Table S2.2). Straw TKN varied to a small extent by genotype (Fgeno = 1.83, unadjusted P = 0.014). It was positively correlated with parameter c (r = + 0.65, P < 0.0001), to a lesser extent with DMLp (r = + 0.36, P = 0.044), but not with other parameters (Supplementary Table S3.1). For each 1.0 g/kg increase in the TKN content of straw, parameter c increased by 0.0030 (95% CI 0.0017–0.0043) g/g/h and DMLp increased by 0.024 (0.001–0.047) g/g. However, adjusting for the TKN content of straw by covariance had little effect on the Fgeno values for parameters c and DMLp, which decreased from 1.14 and 7.34 to 0.68 and 6.59 respectively.
Discussion
The adequacy of dietary N was assessed by rumen ammonia N measurements (Erdman et al., Reference Erdman, Proctor and Vandersall1986) and by the criteria of Alderman and Cottrill (Reference Alderman and Cottrill1993) (Supplementary Table S1.1), and was not dissimilar to diets frequently fed to sheep in WANA (Nordblom et al., Reference Nordblom, Goodchild, Shomo, Gintzburger and Renard1997). The N content in the cannulated sheep's diet did not affect the relative in situ or in vivo nutritive value of straw genotypes when the two diets were respectively slightly and appreciably deficient in rumen degradable nitrogen.
The trait targeted for improvement was DOMI because its strong correlation with ME intake makes it relevant for predicting animal performance. However, replicated measurement of DOMI is time-consuming, requiring months of measurement of intake and faecal output per year; indicator traits for DOMI were therefore sought.
An ideal indicator trait must be heritable and correlated with the target trait (Falconer and Mackay, Reference Falconer and Mackay1996), and must require fewer resources for measuring it (Table 5). With limited resources, the indicator traits giving the greatest rate of improvement of DOMI would be ADF and in vitro digestibility. But given ample resources, indicators based on in situ DML (like DMLp) would achieve higher genetic gains.
Measuring DML at a small number of incubation times could reduce the number of sheep-days needed for estimating in situ parameters. When the duration of incubation was lengthened between 24 and 120 h, bootstrapped r and h 2 both increased. The genetic gain in DOMI was as large when based only on DML at 120 h of incubation as when based on parameter DMLp, and the total incubation time per sheep was reduced by 64%. DML at a relatively long single incubation time can therefore replace parameter DMLp as the best-performing indicator trait.
At the other extreme, severe budgetary limitations could limit the number of tests performed, affecting the response to selection (Falconer and Mackay, Reference Falconer and Mackay1996). Using data for ADF from the trial, the effects of reducing the number of replications of tests can be estimated by spreadsheet modelling. Halving the number of tests per genotype reduced the absolute value of r between ADF and DOMI by approximately 0.09. Randomly halving the number of genotypes tested decreased the selection differential by around 26% of its s.d. On the other hand, a greater number of tests can be performed given a fixed budget by reducing the cost of each indicator trait test. Using near-infrared reflectance spectroscopy (NIRS) could achieve that goal (Deaville and Flinn, Reference Deaville, Flinn, Givens, Owen, Axford and Omed2000).
There are a number of other ways to improve response to selection. One could predict the target trait using more than one indicator trait (Khazaal et al., Reference Khazaal, Dentinho, Ribeiro and Ørskov1995; Fonseca et al., Reference Fonseca, Dias-da-Silva and Ørskov1998), but evaluating this approach requires a larger selection of genotypes than was used in the current trial. One could also reduce the number of genotypes to be tested without losing genetic gain, by pre-selection based on farmers' preferences (Ceccarelli et al., Reference Ceccarelli, Grando, Tutwiler, Baha, Martini, Salahieh, Goodchild and Michael2000) or by pre-selection based on quality-related morphological traits (Capper et al., Reference Capper, Thomson, Rihawi, Termanini and Macrae1986, Reference Capper, Thomson, Herbert, Reed, Capper and Neate1988, Reference Capper, Thomson and Rihawi1989, Reference Capper, Sage, Hanson and Adamson1992; Capper, Reference Capper1988; Colucci et al., Reference Colucci, Falk, Macleod and Grieve1992; Thomson et al., Reference Thomson, Herbert and Rihawi1993; Herbert et al., Reference Herbert, Thomson and Capper1994). The effect of pre-screening the current genotypes for desirable agronomic and morphological traits will be addressed in a companion paper.
Genotypes with traits that do not improve straw quality may have other characteristics that farmers favour. Although black-seeded two-rowed landraces (group 2p) and their crosses with six-rowed types (group 62) did not have straws with the highest nutritive value, farmers in villages located in dry areas in Syria selected them more often than white-seeded landraces during participatory breeding trials because they considered them more resistant to drought (Ceccarelli et al., Reference Ceccarelli, Grando, Tutwiler, Baha, Martini, Salahieh, Goodchild and Michael2000).
The heritability of some indicator traits was larger than that for DOMI (the target trait), probably because the variability of DOMI was affected by ingestion behaviour. Even so, the greatest genetic gain was achieved using DOMI itself, because all calculations of genetic gain were constrained by the error of measurement of DOMI.
The lowest-heritability traits (h 2 ≤ 0.20), which were also not highly correlated with DOMI (|r| ~ 0.40), included the in situ parameters A and c, TKN, and neutral detergent solubles (1 − NDF) (Goering and van Soest, Reference Goering and van Soest1970), and tend to be associated with the contents of plant cells. They can be considered unreliable indicators for estimating the genetic gains attainable in barley straw quality. DMLp and ADF, in contrast, were more effective indicator traits. One can infer that the predominant property of straw constraining genetic gain is the degradability of cell walls in the rumen.
The mean value of DMLp in the current trial was midway between values reported in Scotland (Ørskov, Reference Ørskov, Sansoucy and Dalibard1994, Reference Ørskov, Givens, Owen, Axford and Omed2000) and at ICARDA (Thomson et al., Reference Thomson, Herbert and Rihawi1993; Herbert et al., Reference Herbert, Thomson and Capper1994). These values, and the fact that the mean fertilized grain yield was only 12% smaller than the Australian dryland average (Table 5 in Unkovich et al., Reference Unkovich, Baldock and Forbes2010), suggest that growing conditions in the current trial were relatively favourable in the WANA context.
Parameter A was similar to values reported for barley straw in Scotland (Ørskov, Reference Ørskov, Givens, Owen, Axford and Omed2000; Rezaeian et al., Reference Rezaeian, Beakes and Chaudhry2006), and for wheat and rye straws in Portugal (Fonseca et al., Reference Fonseca, Dias-da-Silva and Ørskov1998). Lag was consistent with reports from Dhanoa (Reference Dhanoa1988), Ørskov (Reference Ørskov, Givens, Owen, Axford and Omed2000), and Rezaeian et al. (Reference Rezaeian, Beakes and Chaudhry2006). The in situ parameter c with Bar and Mix diets, despite not differing between genotypes, were within the wide ranges reported for both the UK (Ørskov et al., Reference Ørskov, Reid and Kay1988, Reference Ørskov, Givens, Owen, Axford and Omed2000; Rezaeian et al., Reference Rezaeian, Beakes and Chaudhry2006), and ICARDA (Thomson et al., Reference Thomson, Herbert and Rihawi1993; Herbert et al., Reference Herbert, Thomson and Capper1994).
Published values for the heritability of straw quality are rare and are based almost exclusively on wheat straw. In one report, Joshi et al. (Reference Joshi, Barma, Hakim, Kalappanavar, Naik, Biradar, Prasad, Singh and Blümmel2019) in South Asia found good heritabilities for straw ADF (h 2 = 0.31) and grain yield (h 2 = 0.28), and zero heritability for straw NDF and nitrogen, all ranking similarly to current results. Their h 2 values for straw yield and in vitro OM digestibility were within the confidence intervals of current results. Their h 2 for ADL was high (0.34), supporting the hypothesis that cell wall degradability constrains genetic gain. The other paper (Jensen et al., Reference Jensen, Magid, Hansen-Møller, Andersen and Bruun2011) reported the narrow-sense heritability of enzymatic digestion of wheat straw to be 0.29 and of adjusted ash content to be 0.39, again not contradicting current results.
A larger number of articles report the s.d. between genotypes and the s.e.m. within genotypes. In a minority of these reports, the s.e.m. was derived from the interaction between genotype and more than one environment (year or location), so that the ratio between s.d. and s.e.m. reflected the relative values of F geno and heritability. Other published reports calculate s.e.m. from variation within a single year and location, rather than from the (generally larger) genotype-by-environment interaction. The limitation of such reports is that they overestimate the repeatability of genotypic differences (Bliss, Reference Bliss1967); this would have been true for most traits in the current trial, in which the genotype-by-year interaction m.s. was larger than the residual mean square m.s. (Supplementary Tables S3.1 and S3.2).
At ICARDA, most published trials have been analysed for single years and locations. Even so, Thomson et al. (Reference Thomson, Herbert and Rihawi1993) and Herbert et al. (Reference Herbert, Thomson and Capper1994) found the s.d./s.e.m. ratio for in situ parameter c to be smaller than that for DMLp, although not as small as that found in the current study. Other ICARDA papers report values of s.d./s.e.m. for traits measured in the laboratory (ADF, in vitro DOMD and in situ DMD) that were larger than the value for NDF, supporting current findings (Capper et al., Reference Capper, Thomson, Rihawi, Termanini and Macrae1986; Capper, Reference Capper1988; Herbert et al., Reference Herbert, Thomson and Capper1994). Capper et al. (Reference Capper, Sage, Hanson and Adamson1992) found the s.d./s.e.m. ratio for ADF in 30 spring barley straw genotypes to be close to that for in vitro digestibility, and close to that for ADL (the latter could not be accurately computed in the current study). But unlike in the current trial, the s.d./s.e.m. ratios for TKN in reports from ICARDA approached those for ADF (Capper et al., Reference Capper, Thomson, Rihawi, Termanini and Macrae1986; Herbert et al., Reference Herbert, Thomson and Capper1994).
The 120 h of in situ incubation, which best predicted genetic gain in DOMI in the current study, was similar to an incubation time used for quantifying indigestible NDF in corn silage (Bender et al., Reference Bender, Cook and Combs2016). Fonseca et al. (Reference Fonseca, Dias-da-Silva and Ørskov1998) also reported that the in situ incubation time best correlated with OM digestibility was 96 h. In older ICARDA work, the s.d./s.e.m. ratio of DML progressively increased between 24 and 96 h, as in the current study (Thomson et al., Reference Thomson, Herbert and Rihawi1993). The finding that prolonged in situ incubation maximizes its ability to predict genetic gain in straw quality again suggests that the underlying objective in barley breeding for straw quality is to improve the digestibility of straw cell wall constituents.
At ICARDA, the correlations previously found between DML or fibre-based indicator traits and digestible straw intake broadly resembled those found in the current study. The absolute values of r were largest for DMLp, DML at 48 h, DML at 72 h and ADF, were smaller for NDF, and were smallest for TKN and parameter c, mirroring current results (Capper et al., Reference Capper, Thomson, Rihawi, Termanini and Macrae1986, Reference Capper, Thomson and Rihawi1989; Herbert et al., Reference Herbert, Thomson and Capper1994). Other reports from ICARDA and Portugal (Thomson et al., Reference Thomson, Herbert and Rihawi1993; Fonseca et al., Reference Fonseca, Dias-da-Silva and Ørskov1998) also found practically zero correlation between parameter c and digestible intake. Parameter c once more appears to be an inappropriate trait for predicting genetic gain.
In some reports from ICARDA, the correlation between TKN and digestible intake was large, contradicting current findings, but only when it was calculated from data for a single year at a single location (Capper et al., Reference Capper, Thomson, Rihawi, Termanini and Macrae1986, Reference Capper, Thomson, Herbert, Reed, Capper and Neate1988; Herbert et al., Reference Herbert, Thomson and Capper1994). The overall correlations between the TKN content of genotypes and other quality traits disappear in multi-year studies because the relative TKN concentration in straw genotypes varies appreciably between years, as found for straw harvested in 1984, 1985 and 1988 (data of Goodchild, Reference Goodchild1997), and in the current trial. This provides further evidence that TKN in barley straw is an unreliable indicator of genetic gain.
Selection of genotypes for straw quality should not compromise the yield of grain. Although grain yield was highly heritable in the current trial, it was not at all correlated with DOMI (P > 0.500) and not strongly correlated (P > 0.050) with in situ parameters, except for the weakly heritable parameter A, where r was + 0.50 (Supplementary Table S3.1). Indeed, most published studies have found that correlations between grain yield and measures of straw quality are practically zero (Capper, Reference Capper1988; Capper et al., Reference Capper, Sage, Hanson and Adamson1992; Jensen et al., Reference Jensen, Magid, Hansen-Møller, Andersen and Bruun2011) or weakly negative (Erickson et al., Reference Erickson, Meyer and Foster1982; Capper et al., Reference Capper, Thomson, Rihawi, Termanini and Macrae1986, Reference Capper, Thomson and Rihawi1989). Straw yield was not heritable in the current trial, and not strongly correlated with any indicator trait (P > 0.050). These findings imply it is possible to select straw for nutritive value without greatly affecting barley grain and straw yields.
Although current results show that measurement of the TKN content of straw is of limited use in crop breeding because of its low h 2, it can have economic value by affecting the quantity of N supplement needed to balance rations. Fertilization with N as urea increased the TKN content of straw, straw yield and grain yields in the current study, but if applied to excess solely to enhance the N in straw it could contribute to environmental pollution.
If digestion of cell wall constituents in the rumen is a major factor in straw quality, an in vitro digestibility technique that measures residual NDF (e.g., Goering and van Soest, Reference Goering and van Soest1970) may be more appropriate than the method used in the current trial (Schiere et al., Reference Schiere, Joshi, Seetharam, Oosting, Goodchild, Deinum and Van Keulen2004). Selecting for a stay-green trait might also improve the quality of crop residues (Schiere et al., Reference Schiere, Joshi, Seetharam, Oosting, Goodchild, Deinum and Van Keulen2004), although its validity in dryland farming is uncertain. Measurement of microbial gas production in vitro, although not studied in the current trial, could replace in situ trials to assess the dynamics of digestion of straw in the rumen (Blümmel and Ørskov, Reference Blümmel and Ørskov1993). Gas production tests can also be used to assess straw genotypes for biogas production (Naz et al., Reference Naz, Reinert, Bostanci, Seperi, Leon, Böttger, Südekum and Frei2017).
Analysis of NIRS data, requiring a large initial expense, can be calibrated to predict the DOMI of straw directly, possibly with higher precision and lower running costs than in the current study (Givens et al., Reference Givens, Baker, Moss and Adamson1991; Deaville and Flinn, Reference Deaville, Flinn, Givens, Owen, Axford and Omed2000). A forthcoming paper will compare the genetic gain for straw quality predicted by NIRS analysis with predictions reported in the current paper.
Another paper being drafted will consider correlations between straw quality traits and several morphological traits of barley, which may affect the acceptability of genotypes in farming systems by interacting with desirable agronomic features (Schiere et al., Reference Schiere, Joshi, Seetharam, Oosting, Goodchild, Deinum and Van Keulen2004). The usefulness of indicator traits may also drift when repeated selection alters their genetic basis, so that relationships between indicator traits and DOMI will need to be re-assessed from time to time.
Conclusions
Genetic improvement of barley straw quality as an alternative to chemical treatment began at ICARDA in the 1980s. A novel approach is reported here, based on the heritability of indicator traits and their correlation with DOMI as the ‘gold standard’. It concludes that selection for barley straw quality can be of practical benefit for farmers because it is not correlated with grain yield and is particularly effective when straw yields are high.
Several indicator traits measured in sheep and in the laboratory distinguished barley genotypes by their straw quality. The heritability of each trait, and the trait's correlation with DOMI, were generally proportional to one another and varied between traits. The choice of an effective indicator trait for achieving genetic gain in straw quality depends on laboratory facilities, budgets and other crop characters being selected for.
Increasing the digestibility of plant cell wall constituents was the key nutritional target for achieving genetic gain in straw DOMI. This could be achieved by selecting against ADF or possibly ADL or by selection for in vitro digestibility and (if resources permit) in situ DML after prolonged incubation. Conversely, traits associated with cell contents, including N content, neutral detergent solubles, and the in situ parameters A, c and Lag, were not sufficiently heritable or correlated with DOMI to be suitable indicator traits. Straw-based diets marginal in N content, frequently fed by farmers in WANA, would be more effectively improved by adding protein-rich supplements or urea.
But in all growing conditions, the nutritive value of straw must always be balanced against crop yield and adaptability to local conditions, and one should always consider traits such as harvestability and disease resistance.
Supplementary material
The supplementary material for this article can be found at https://doi.org/10.1017/S0021859622000399.
Acknowledgements
The research reported here was carried out when the authors were employed by the International Center for Research in the Dry Areas (ICARDA), P.O. Box 5466, Aleppo, Syrian Arab Republic. They thank Klaus Becker, Michael Blümmel, Emyr Owen and Murari Singh for scientific and statistical advice, and Ibrahim Sa'eed and Ahmad Sawass who ably helped to conduct the trials, laboratory analyses and supervised harvesting. The contributions of numerous others at ICARDA are also acknowledged with thanks.
Author contributions
SG and SC developed and provided the collection of genotypes studied; AVG was responsible for the design, planning, supervision and analysis of the work; MH made substantial contributions to the acquisition and analysis of plant samples and data for the work; AVG drafted the initial manuscript; and EFT, SC, SG and AVG revised it critically for important intellectual content.
Financial support
The work was supported by Bundesministerium für Wirtschaftliche Zusammenarbeit (BMZ), Germany, in Project 223-K 8064 ICARDA-2/94 titled ‘Genetic Improvement of Barley for Livestock Feed in West Asia and North Africa: The Development of Applicable Selection Methods’.
All of the authors were employed by the International Center for Agricultural Research in the Dry Areas (ICARDA), P.O. Box 5466, Aleppo, Syria, during the years in which the trials were conducted.
Conflicts of interest
The authors declare there are no conflicts of interest.
Ethical standards
Under an agreement with the Institutional Animal Care and Use Committee of the International Livestock Research Institute (ILRI), animal research at ICARDA complies voluntarily with the United Kingdom Animals (Scientific Procedures) Act 1986, which contains guidelines and codes of practice for the housing and care of animals used in scientific procedures. The agreement covered inter alia the surgical procedures, care, handling, and sampling of all sheep utilized in the trial.