1. Introduction
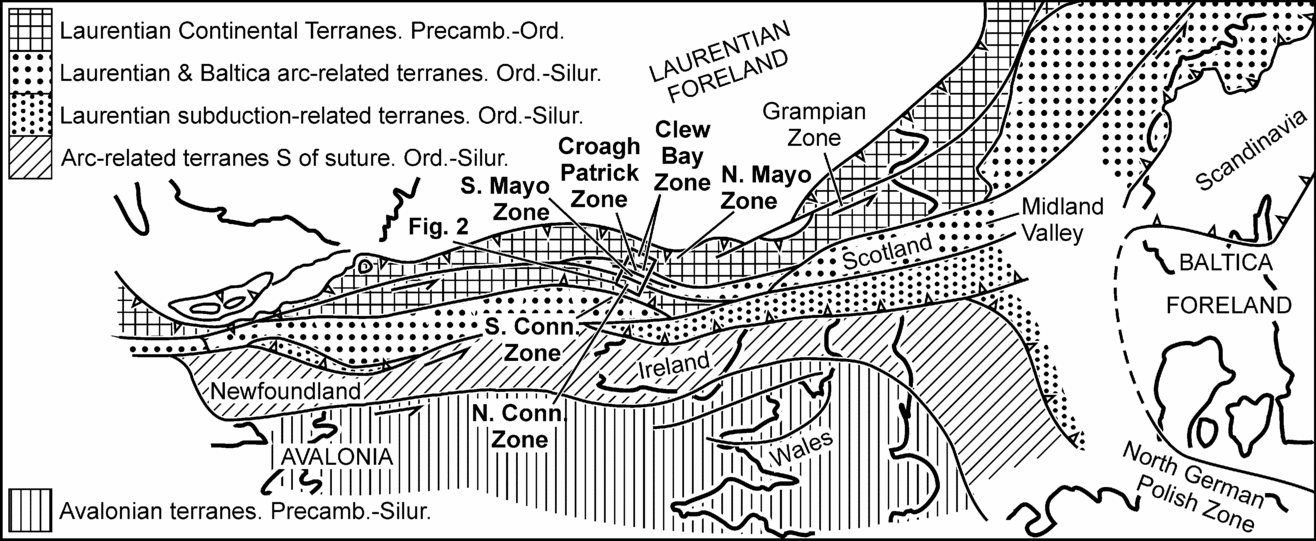
Although structural, sedimentological, geochemical and palaeontological discriminants have been used, the distribution of terranes in the Irish Caledonides, a strike-slip zone linking the North American and Scandinavian Caledonides (Dewey & Shackleton, Reference Dewey and Shackleton1984; Fig. 1) remains uncertain. However, in areas of very low-grade metamorphism, two clay-mineral parameters can also be used: illite crystallinity (IC; Merriman & Frey, Reference Merriman, Frey, Frey and Robinson1999), which indicates the metamorphic grade (temperature), and the illite b0 spacing (baric-type; Guidotti & Sassi, Reference Guidotti and Sassi1986), which constrains the pressure–temperature (P–T) gradient, and thus the tectonic setting. These parameters have been used here to further elucidate the Galway Bay–Clew Bay area of the Irish Caledonides.
Map showing the location of the Galway Bay–Clew Bay area within the major Caledonian terranes of the North Atlantic region (after Dewey & Shackleton, Reference Dewey and Shackleton1984).

Very low-grade metamorphism remains more a qualitative than quantitative part of P–T space since the conditions determined lack the precision obtained from higher-grade rocks. To partially overcome this, a diagram akin to a P–T plot has been used to portray illite crystallinity and b0 data, although neither IC–temperature nor b0–P–T gradient relationships are precisely known.
2. Regional setting
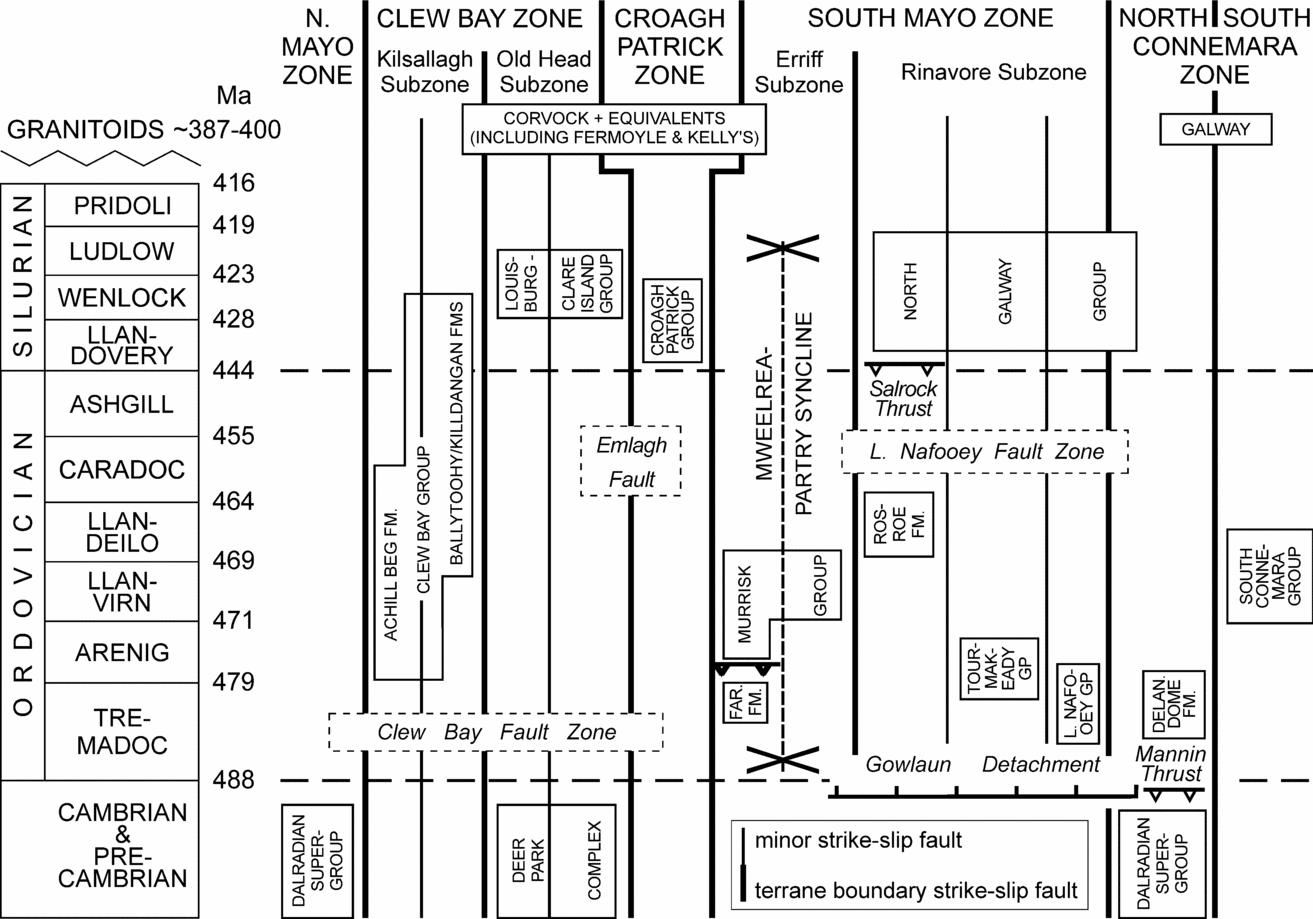
The Galway Bay–Clew Bay area comprises sinistral strike-slip terranes accreted onto Laurentia during late Caledonian orogenesis (Johnston & Phillips, Reference Johnston and Phillips1995; Fig. 1); six tectono-sedimentary zones (essentially terranes) have been identified, containing Precambrian to Silurian rocks (Figs 2, 3; Murphy et al. Reference Murphy, Anderson, Daly, Gallager, Graham, Harper, Johnston, Kennan, Kennedy, Long, Morris, O'Keeffe, Parkes, Ryan, Sloan, Stillman, Tietzch-Tyler, Todd and Wrafter1991).
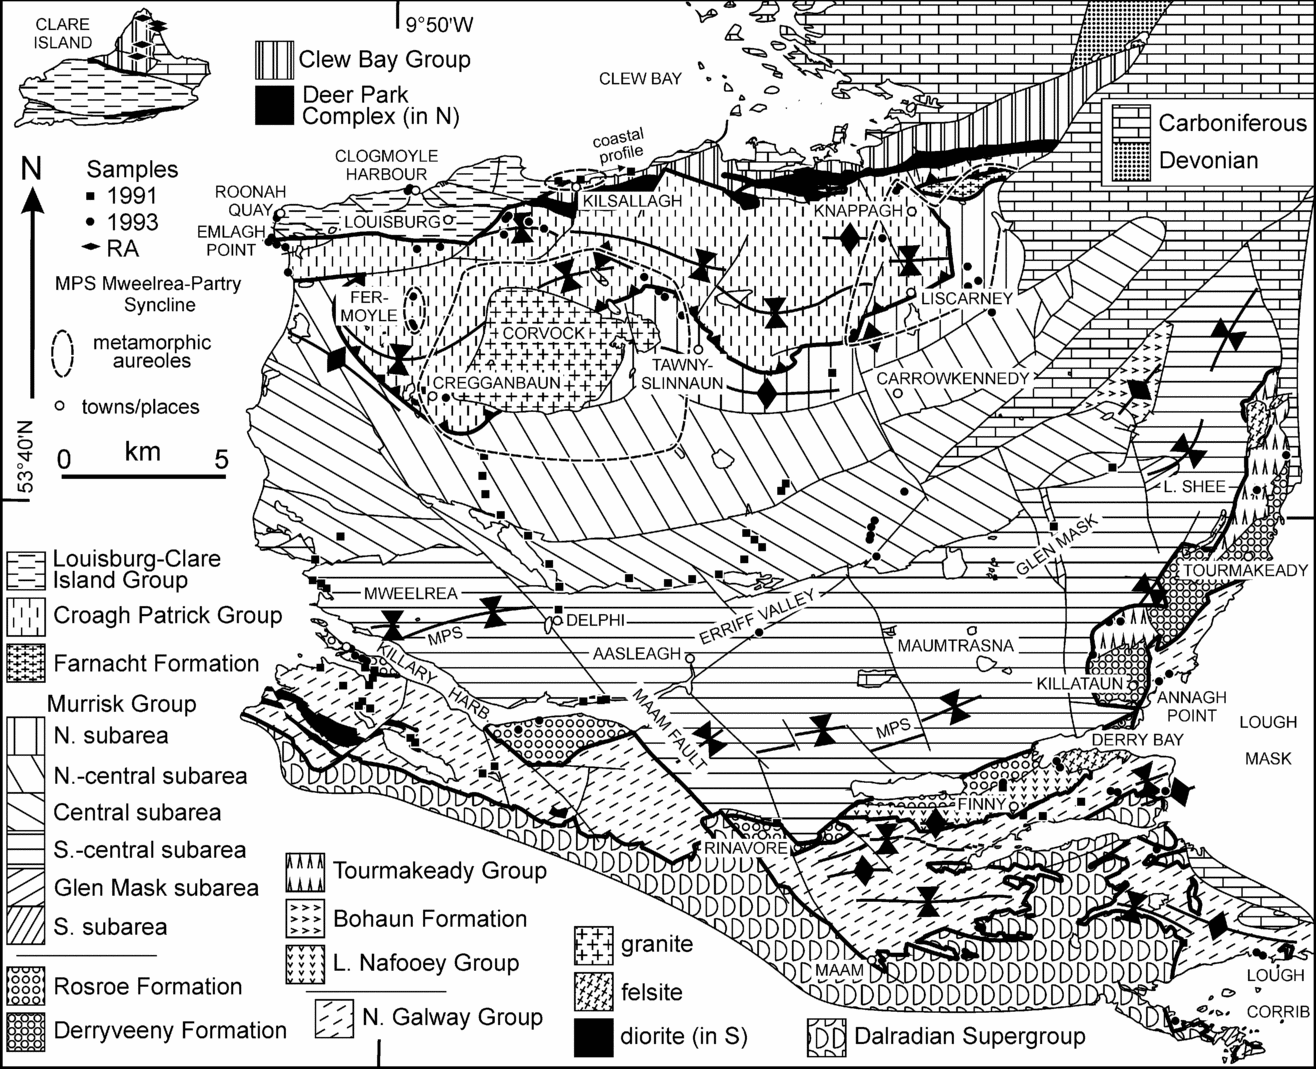
Geological map of the South Mayo area showing the sample localities, except for the South Connemara Group (after Graham, Leake & Ryan, Reference Graham, Leake and Ryan1989). Thicker black lines separate the terranes, even where offset by later normal faults. See Figure A1 for a colour version of the map (http://journals.cambridge.org/geo).

Schematic terrane representation in the Galway Bay–Clew Bay area. The ages of structural elements are not constrained by the figure. Far. Fm. – Farnacht Formation.

2.a. Clew Bay Zone
The Clew Bay Zone (Figs 2, 3) consists of the Deer Park Complex and the Clew Bay Group (Clew Bay Complex; Max, Reference Max1989) and the Louisburg–Clare Island Group (Maguire & Graham, Reference Maguire and Graham1996).
The Deer Park Complex comprises Dalradian Supergroup schists together with amphibolites and serpentinites of uncertain age but partly ophiolitic (Ryan, Sawal & Rowlands, Reference Ryan, Sawal and Rowlands1983), deformed in pre-Ordovician times (Johnston & Phillips, Reference Johnston and Phillips1995). The Clew Bay Group comprises oceanic sediments (Killadangan, Portruckagh, Ballytoohy, Achill Beg and Letter formations; Fig. 2; Graham, Leake & Ryan, Reference Graham, Leake and Ryan1989) thrust onto the Deer Park Complex (Johnston & Phillips, Reference Johnston and Phillips1995). Ballytoohy and Killadangan Formation cherts contain Middle to Late Ordovician fossils; the overlying clastic sediments contain middle Silurian plant cuticles (Williams et al. Reference Williams, Harkin, Armstrong and Higgs1994, Williams, Harkin & Higgs, Reference Williams, Harkin and Higgs1996; Higgs & Williams, Reference Higgs, Williams and Graham2001). Williams, Harkin & Rice (Reference Williams, Harkin and Rice1997) suggested that these units represent a Late Ordovician spreading centre that originated as a trapped oceanic embayment, followed by turbidites, all of which were deformed into a subduction-related mélange in Silurian times. Johnston & Phillips (Reference Johnston and Phillips1995) disputed the Silurian age and, in support, Chew et al. (Reference Chew, Daly, Page and Kennedy2003) published c. 460 Ma 40Ar–39Ar deformation ages from the Achill Beg Formation.
The 1.5 km thick, essentially non-marine, Wenlock–Ludlow aged Louisburg–Clare Island Group (Figs 2, 3; Palmer et al. Reference Palmer, Johnston, Dooley and Maguire1989) comprises N-derived sediments from amphibolite facies and serpentinitic sources (Maguire & Graham, Reference Maguire and Graham1996) that may represent molasse derived from the Clew Bay Group and Deer Park Complex. The group lies in tectonic contact with the other units of the zone and carries a Silurian cleavage formed during S-directed thrusting (Johnston & Phillips, Reference Johnston and Phillips1995).
2.b. Croagh Patrick Zone
The 3 km thick early Llandovery to at least Wenlock aged Croagh Patrick Group (Figs 2, 3; Bickle, Kidd & Nisbet, Reference Bickle, Kidd and Nisbet1972; T. J. Kelly, unpub. Ph.D. thesis, National Univ. Ireland Galway, 1976) was probably deposited as shelf sediments on the Laurentian continental margin. Pelitic lithologies carry a well-developed cleavage, with associated folds and later crenulations. The basal contact reflects SW-directed oblique sinistral thrusting (Johnston & Phillips, Reference Johnston and Phillips1995).
The late to post-Caledonian Corvock Granite stitched the Croagh Patrick and South Mayo zones at c. 387 ± 12 Ma (O'Connor, Reference O'Connor1989; Figs 2, 3). Kelly (T. J. Kelly, unpub. Ph.D. thesis, National Univ. Ireland Galway, 1976) showed both that this intrusion continues at a shallow depth to the WNW and that contact metamorphism occurred in the Farnacht Formation and adjacent Croagh Patrick and Murrisk groups, ascribed to a buried intrusion here called Kelly's Pluton; biotite from this area has been dated at c. 413 Ma (Max, Rex & Winchester, Reference Max, Rex and Winchester1988). Evidence presented below indicates that the Fermoyle area (Fig. 2) was also affected by contact metamorphism by an unexposed intrusion, here called the Fermoyle Pluton.
2.c. South Mayo Zone
This comprises eight units (Figs 2, 3), four of which are considered here. The Tremadocian Lough Nafooey Group comprises 2.6 km of pillow-basalts, breccias, cherts and graphitic shales (Ryan, Floyd & Archer, Reference Ryan, Floyd and Archer1980), formed in a back-arc basin environment (Clift & Ryan, Reference Clift and Ryan1994). This may be the precursor of the Arenig Tourmakeady Group (thickness unknown; Williams & Curry, Reference Williams and Curry1985), composed of andesitic–rhyolitic lavas (Clift & Ryan, Reference Clift and Ryan1994) and clastic-carbonate sediments. The Farnacht Formation (Figs 2, 3; Max, Rex & Winchester, Reference Max, Rex and Winchester1988) may be equivalent to the Tourmakeady Group. Basic volcanic rocks of the Bohaun Formation (Fig. 2), correlated with those of Lough Nafooey, may have formed in a fore-arc environment (Clift & Ryan, Reference Clift and Ryan1994); no contact with the Murrisk Group is exposed.
The Murrisk Group is an approximately 10 km thick clastic succession comprising Arenig deep-water turbidites (Letterbrock and Derrylea formations), Llanvirn shales (Glenummera Formation) and Llandeilo–?Caradoc alluvial fans–fan deltas (Mweelrea Formation; Pudsey, Reference Pudsey1984; Williams, Reference Williams1984). SW-derived conglomerates, sandstones, pyroclastics and shales east of Derry Bay (Fig. 2) have been correlated with the shales and conglomerates of the Mweelrea Formation (Evans, Reference Evans1996; Ryan et al. in press). Dewey & Ryan (Reference Dewey and Ryan1990) and Clift & Ryan (Reference Clift and Ryan1994) postulated a fore-arc basin environment, resting on Tremadocian basic volcanics (Bohaun Formation), above a subduction zone dipping southwards (based on the present-day relative positions of fore- and back-arc basalts). In contrast, Johnston & Phillips (Reference Johnston and Phillips1995) argued that the L. Nafooey Group is tectonically isolated from the Murrisk Group, which was after Arenig times a strike-slip pull-apart basin, with later northwards-directed subduction under the Lough Nafooey Group.
The 2 km thick Rosroe Formation (Figs 2, 3), which is dominated by sandstones with thin shales in the west and conglomerates in the east, was juxtaposed against the Murrisk Group by strike-slip faulting of uncertain age; correlations with the Murrisk Group are dubious (Ryan et al. in press). Dewey & Mange (Reference Dewey, Mange, MacNiocall and Ryan1999) included the Rosroe Formation in the fore-arc basin model described above, but Ryan et al. (in press) cast doubt on this interpretation.
The 2.5 km thick Llandovery–Pridoli North Galway Group lies unconformably on the Ordovician Gowlaun Detachment, which formed the northern margin of the North Connemara Zone (Figs 2, 3; Williams & Rice, Reference Williams and Rice1989). Northwards, it unconformably overlies the Rosroe Formation and Lough Nafooey Group. The succession represents alluvial deposits overlain by marine sediments (O'Connor & Williams, Reference O'Connor and Williams1999). Phillips (Reference Phillips1974) correlated the North Galway, Croagh Patrick and Louisburg–Clare Island groups, while Williams & Harper (Reference Williams and Harper1991) suggested that they were at least parautochthonous with respect to each other.
Open to tight, E–W- to NE–SW-trending folds in the Murrisk Group have wavelengths of ~ 10 km (Fig. 2). Since Silurian rocks in both the north and south were inferred to lie unconformably on fold limbs, Dewey & Ryan (Reference Dewey and Ryan1990) inferred that pre-Silurian folding occurred, with late Silurian to Early Devonian refolding. However, the supposed northern ‘unconformable’ contact is tectonic (Johnston & Phillips, Reference Johnston and Phillips1995), and no stratigraphic contact exists anywhere between the Murrisk and North Galway groups (Fig. 2).
2.d. North Connemara Zone
The high-grade metamorphic rocks of the Neoproterozoic Dalradian Supergroup of the North Connemara Zone were emplaced by Ordovician sinistral strike-slip extension along the Gowlaun Detachment (Figs 2, 3; Williams & Rice, Reference Williams and Rice1989). The Delaney Dome Formation, comprising > 300 m of volcanic mylonites (?≡Tourmakeady Group; Fig. 3), underlies the supergroup along the Mannin Thrust (Draut & Clift, Reference Draut and Clift2001). Deformation occurred at c. 460 Ma (Dewey & Mange, Reference Dewey, Mange, MacNiocall and Ryan1999) with thrusting likely in late Ordovician times (Tanner, Dempster & Dickin, Reference Tanner, Dempster and Dickin1989).
2.e. South Connemara Zone
This comprises about 3 km of ocean-floor basalts, frequently pillowed, interbedded with and overlain by Lower to Middle Ordovician cherts and continental turbidites (South Connemara Group; Ryan, Max & Kelly, Reference Ryan, Max and Kelly1983; Ffrench & Williams, Reference Ffrench and Williams1984; Williams, Armstrong & Harper, Reference Williams, Armstrong and Harper1988) representing a seamount collision with a N-directed subduction zone (Dewey & Ryan, Reference Dewey and Ryan2004). The deformation age is constrained by the c. 400 Ma Galway Granite (Crowley & Feely, Reference Crowley and Feely1997).
2.f. Terrane amalgamation
The late- to post-Caledonian Galway and Corvock Granites stitched together the South and North Connemara zones and the South Mayo and Croagh Patrick zones, respectively. Evidence presented below suggests that late- to post-Caledonian granites also affected the Clew Bay Zone. Together with the overlap sequence of the North Galway Group across the South Mayo and North Connemara zones, these bound the known terranes together by c. 390 Ma (Fig. 3; O'Connor, Reference O'Connor1989; Crowley & Feely, Reference Crowley and Feely1997). Subsequently, NNW–SSE-oriented dextral wrench faulting with about 5.5 km displacement occurred along the Maam Fault Zone (Fig. 2; Smethurst, MacNiocaill & Ryan, Reference Smethurst, MacNiocaill and Ryan1994).
3. Analytical techniques
Samples (275) showing a single cleavage were collected from 159 localities (Fig. 2). At 80 localities, two or more samples were taken.
3.a. Clay-mineral crystallinity
Clay-mineral crystallinity reflects a combination of the thickness of the X-ray scattering domain size (crystallite size) and broadening due to the presence of mixed-layered phases (Merriman & Frey, Reference Merriman, Frey, Frey and Robinson1999). For (001) illite, this is commonly smectite; (002) illite is minimally affected by interlayers. With increasing temperature and other parameters, especially strain, remaining constant, growth of some crystallites at the expense of others causes a growth in domain size and hence peak narrowing.
For illite and chlorite crystallinity (IC, ChC), sample preparation and measurement followed Rice & Roberts (Reference Rice and Roberts1995). Data are presented as the full width of the peak at half the maximum peak height (FWHM), in Δ°2θ. Raw data were standardized to the Crystallinity Index Scale (CIS; Warr & Rice, Reference Warr and Rice1994).
(001) IC anchizone boundaries were set at 0.25 and 0.42 Δ°2θ (Warr & Rice, Reference Warr and Rice1994), reflecting temperatures of ~ 300 and 200 °C (Merriman & Frey, Reference Merriman, Frey, Frey and Robinson1999), with informal upper–lower anchizone and early–late diagenetic zone boundaries of 0.325 and 0.545 Δ°2θ. Warr (Reference Warr1996) proposed (002) IC boundaries of 0.23 and 0.36 Δ°2θ (with interpolated values of 0.287 and 0.456 Δ°2θ) and (002) ChC anchizonal boundaries of 0.23 and 0.36 Δ°2θ.
3.b. b0 spacing
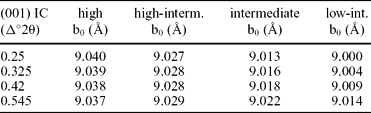
The b0 spacing (Å) reflects the celadonite component in the illite lattice, this being P and T dependent (Padan, Kisch & Shagam, Reference Padan, Kisch and Shagam1982; Guidotti & Sassi, Reference Guidotti and Sassi1986; Árkai et al. Reference Árkai, Faryad, Vidal and Balogh2003). As celadonite substitution isopleths are oblique to P–T gradients (Guidotti & Sassi, Reference Guidotti and Sassi1986), baric-type zone boundaries vary with (001) IC; values used here (Table 1) are outlined in the Discussion (Section 6), as is the use of the method in the diagenetic zone. Sample preparation followed Rice & Roberts (Reference Rice and Roberts1995).
Lower boundary values for metamorphic baric-types for the (001) IC zone boundary values

Whole-rock powders (b0−wr) of samples with the correct mineralogy (Frey, Reference Frey1987) were packed laterally into special holders to reduce interference between the (331) and (060) illite peaks (Robinson, Reference Robinson1981). Samples were run with a 0.05° receiving slit. For the quartz (112) peak, a step-size of 0.01° and 1 s counting time were used. For the quartz (211) and (060) illite peaks, a step-size of 0.005° and counting time of 2 s were used. Data were processed by fitting a single peak to the combined CuKα1+2 radiation and with separate CuKα1 and CuKα2 peaks. The (112) and (211) quartz peaks were separately used to calibrate the (060) illite peak position, giving four b0−wr values; the average was used.
Since detrital white-micas are present in some samples, b0 was determined for 90 <2 μm crystallinity preparates (b0−<2μm). Analytical conditions were 0.01° step-size and 2 s counting-time for the quartz (112) peak and 0.002° step-size and 8 s counting-time for the quartz (211) and (060) illite peaks, with the same receiving slit as above. Intensities were lower and peak fittings less reliable than for b0−wr. The mean b0−wr value used for comparison (b0−pwr) was calculated from samples used in the b0−<2μm study. Samples were chosen to cover the whole range of b0−wr values in each dataset. Differences between the b0−<2μm and b0−pwr means are important.
4. IC and b0 spacing error determinations
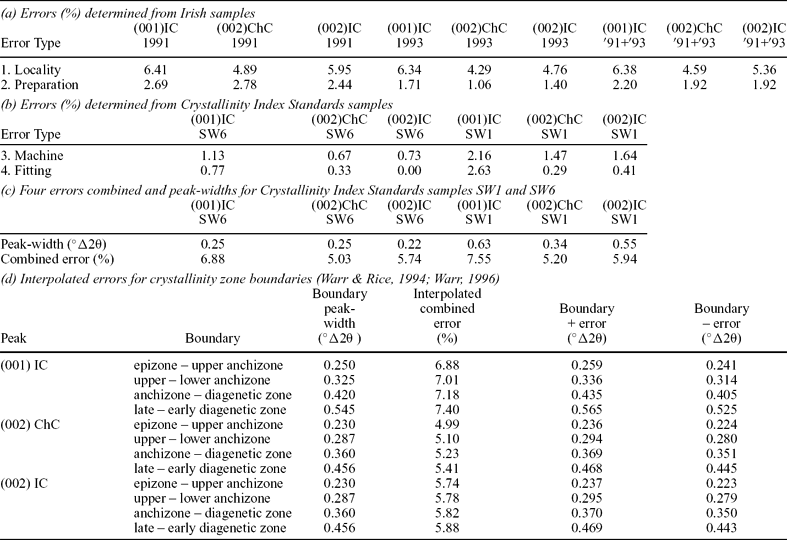
For IC and ChC, inter-laboratory differences caused by variations in preparation methods were calibrated using the Crystallinity Index Standards (Warr & Rice, Reference Warr and Rice1994). For other parameters, the precision, defined as the coefficient of variation (C = std.dev.*100/mean: Till, Reference Till1974) was established. Intra-locality error was determined by comparing results from samples from the same locality and intra-sample error by comparing the results of the three slides prepared from each sample. Machine error was estimated by running one Crystallinity Index Standard epizone and diagenetic zone slide thirty times, without removing it from the diffractometer, and processing the results identically. Fitting errors were obtained by taking one epizone and diagenetic zone analysis from the machine error determination, and measuring the FWHM with twenty-five different ranges of Δ°2θ. For the first and second errors, values were determined separately for the 1991 samples and for the 1993, SC and RA samples (sample localities are shown in Fig. 1 except for the SC – South Connemara Group – samples; these are documented in Section 5.c.8). The results (Table 2c) were combined to give a bulk coefficient. Larger coefficients were associated with broader peaks and the 1991 data. Error values at zone boundaries were determined by linear interpolation (Table 2d).
Clay mineral crystallinity errors

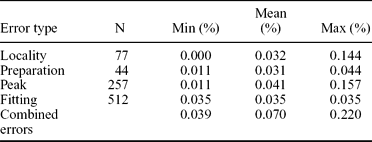
For the b0−wr data, intra-sample error was estimated by running several samples 15 times, with the sample holder emptied and refilled between runs and the b0−wr value computed in a standard way. Intra-locality errors were obtained by comparing the results of samples from the same locality. Machine error could not be estimated, due to disaggregation of the pressed powder during repetitive running, but is likely very small. The fitting error was obtained by using several fitting techniques on single runs of several samples; peak error was determined by comparing the four different b0−wr values determined. The errors (Table 3) gave an overall coefficient of variation of 0.070% (≡σn 0.006 Å). Although this seems low, b0 data are quoted to the third decimal place on values with a range of only 0.095 Å (8.960 to 9.055 Å). Hence b0 and crystallinity errors are ‘comparable’ in scale.
b0-wr spacing errors

5. Results
A data summary (Table A1) is available in the online data appendix at http://journals.cambridge.org/geo. Detailed spreadsheet data files can be obtained from the corresponding author.
5.a. Bulk crystallinity data
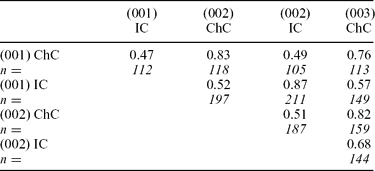
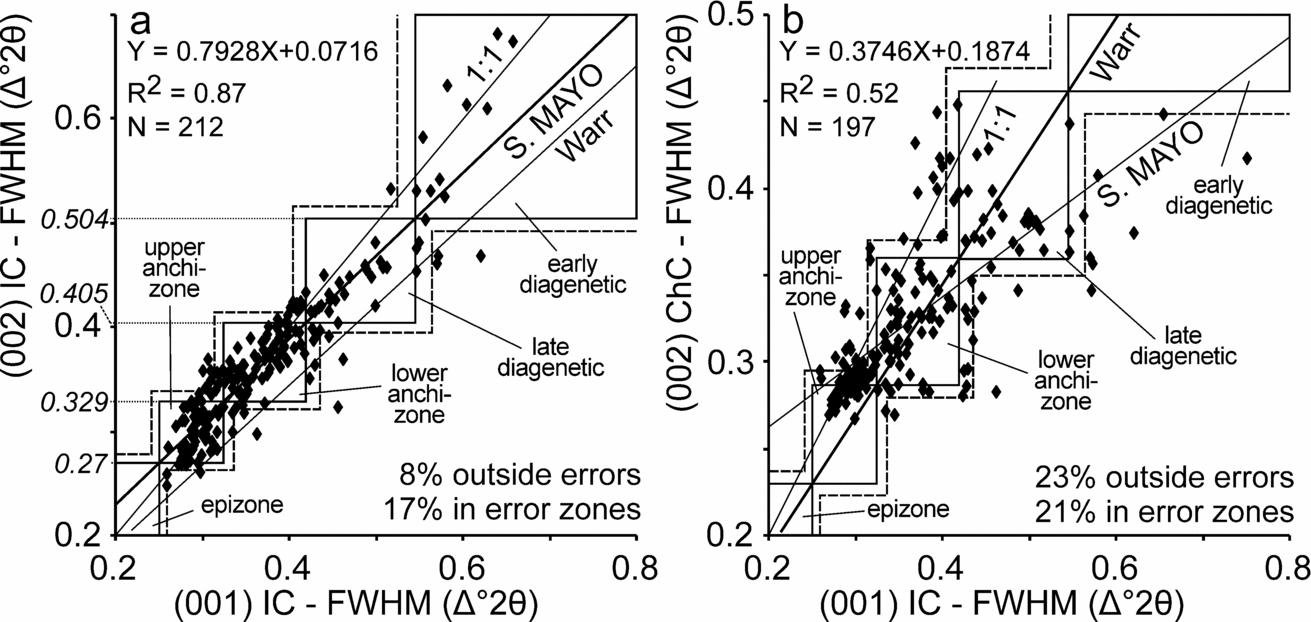
Peak-widths show correlations of R2 = 0.76–0.87 between peaks of the same phase (Table 4); (001)–(002) IC data gave the best correlation. Illite–chlorite peak-width correlations are poorer (R2 = 0.47–0.68). The (001)–(002) IC best-fit line lies subparallel to the line defined by the Crystallinity Index Standard (001) IC and the Warr (Reference Warr1996) (002) IC boundary values (Warr line; Fig. 4a), but closer to the 1:1 line. If the Crystallinity Index Standard (001) IC zone boundaries are projected onto the South Mayo best-fit line, to infer (002) IC boundaries, 75% of samples lie in the same zone, rising to 92% lying within the error limits. In contrast, with the Warr line only 69% of points lie in the same zone within error. For the (001) IC–(002) ChC data (Fig. 4b), 55% of samples lie in the same zone, increasing to 82% within error, using the Warr line. This is better than when (002) ChC zone boundaries are inferred from the South Mayo best-fit line, for which 77% lie in the same zone within error. Thus the Warr (Reference Warr1996) (002) ChC boundary values appear to be relatively reliable, while the (002) IC boundary values give inconsistent results compared to (001) IC.
Bulk peak-width correlations (R2)

Comparison of crystallinity peak-widths with zone boundaries for (a) (001)–(002) IC and (b) (001) IC and (002) ChC. The determined errors have been plotted outside the zone boundaries. S. MAYO refers to the best-fit line through the data. ‘Warr’ refers to the line defined by combining the (001) IC Crystallinity Index Standard zone boundaries with the (002) IC and (002) ChC zone boundaries proposed by Warr (Reference Warr1996). Formula and R2 have been given for the S. MAYO line. The number of data points lying outside the error boundaries and between the zone boundary and the error (error zones) are also given; calculated for the S. MAYO line in (a) and for the Warr line in (b). Inferred zone boundaries for (002) IC are given on the ordinate in (a).

5.b. Bulk b0 spacing data
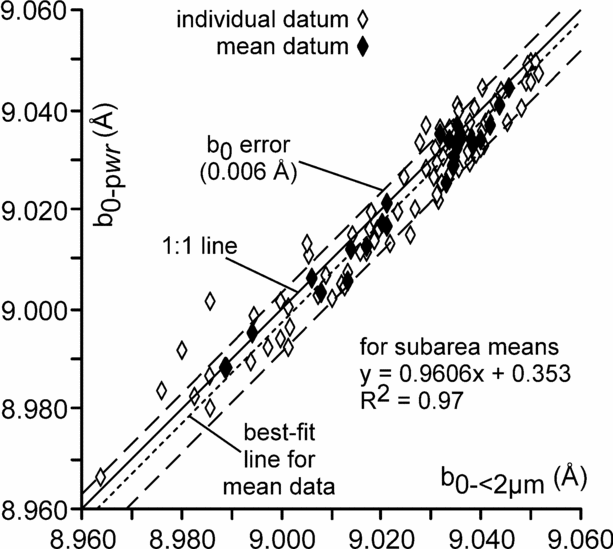
Correlation of b0−<2μm and b0−pwr spacings, using individual data, yielded R2 = 0.93, with the best-fit line subparallel to the 1:1 relationship (Fig. 5); plotting subarea means gave R2 = 0.97. The maximum difference between two mean values is 0.008 Å, only slightly larger than the coefficient of variation determined for the method (Table 3) but enough for some values to differ significantly. For individual samples, the difference is up to 0.016 Å. Thus, where tested, the b0−wr data are essentially the same as the b0−<2μm data, and were used here.
Plot of b0−pwr v. b0−<2μm data.

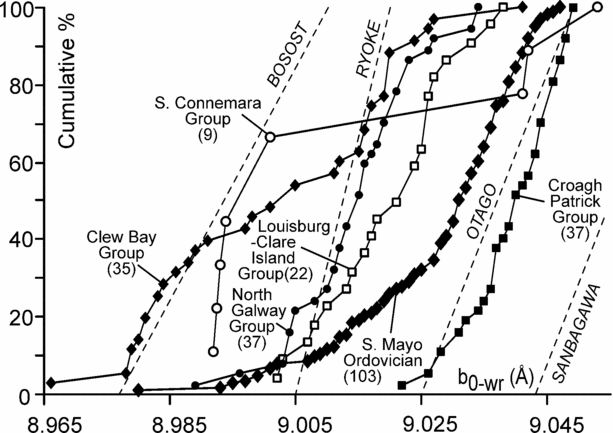
The b0−wr data range from 8.966 to 9.053 Å (Fig. 6). Major datasets have standard deviations similar to other areas, although since they are from anchizone–diagenetic zone samples, these are relatively large (Table A1 in online appendix). For b0−wr versus IC peak-widths, R2 ranges between 0.00 and 0.97. Higher R2 values come from small datasets, although other small sets have low regression coefficients. No dataset has a large enough (001) IC range to show the IC-b0−wr relationship described by Padan, Kisch & Shagam (Reference Padan, Kisch and Shagam1982).
Cumulative b0−wr plots for the main datasets. These are subdivided in Figure 8.

5.c. Subareas
5.c.1. Clew Bay Group
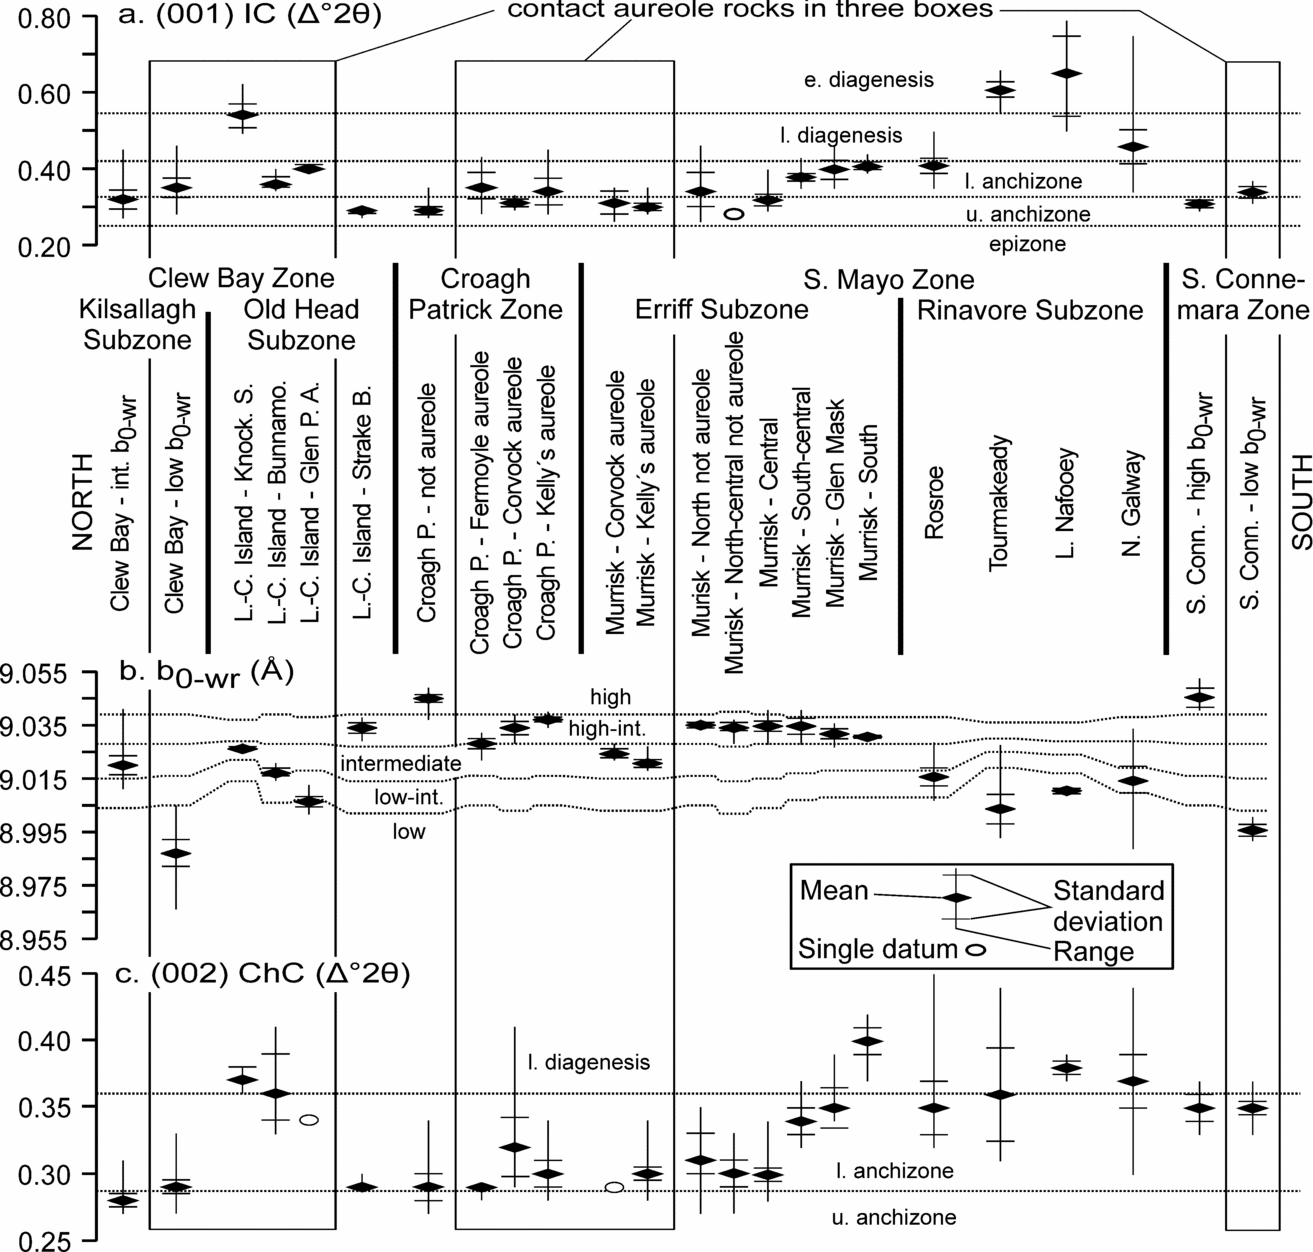
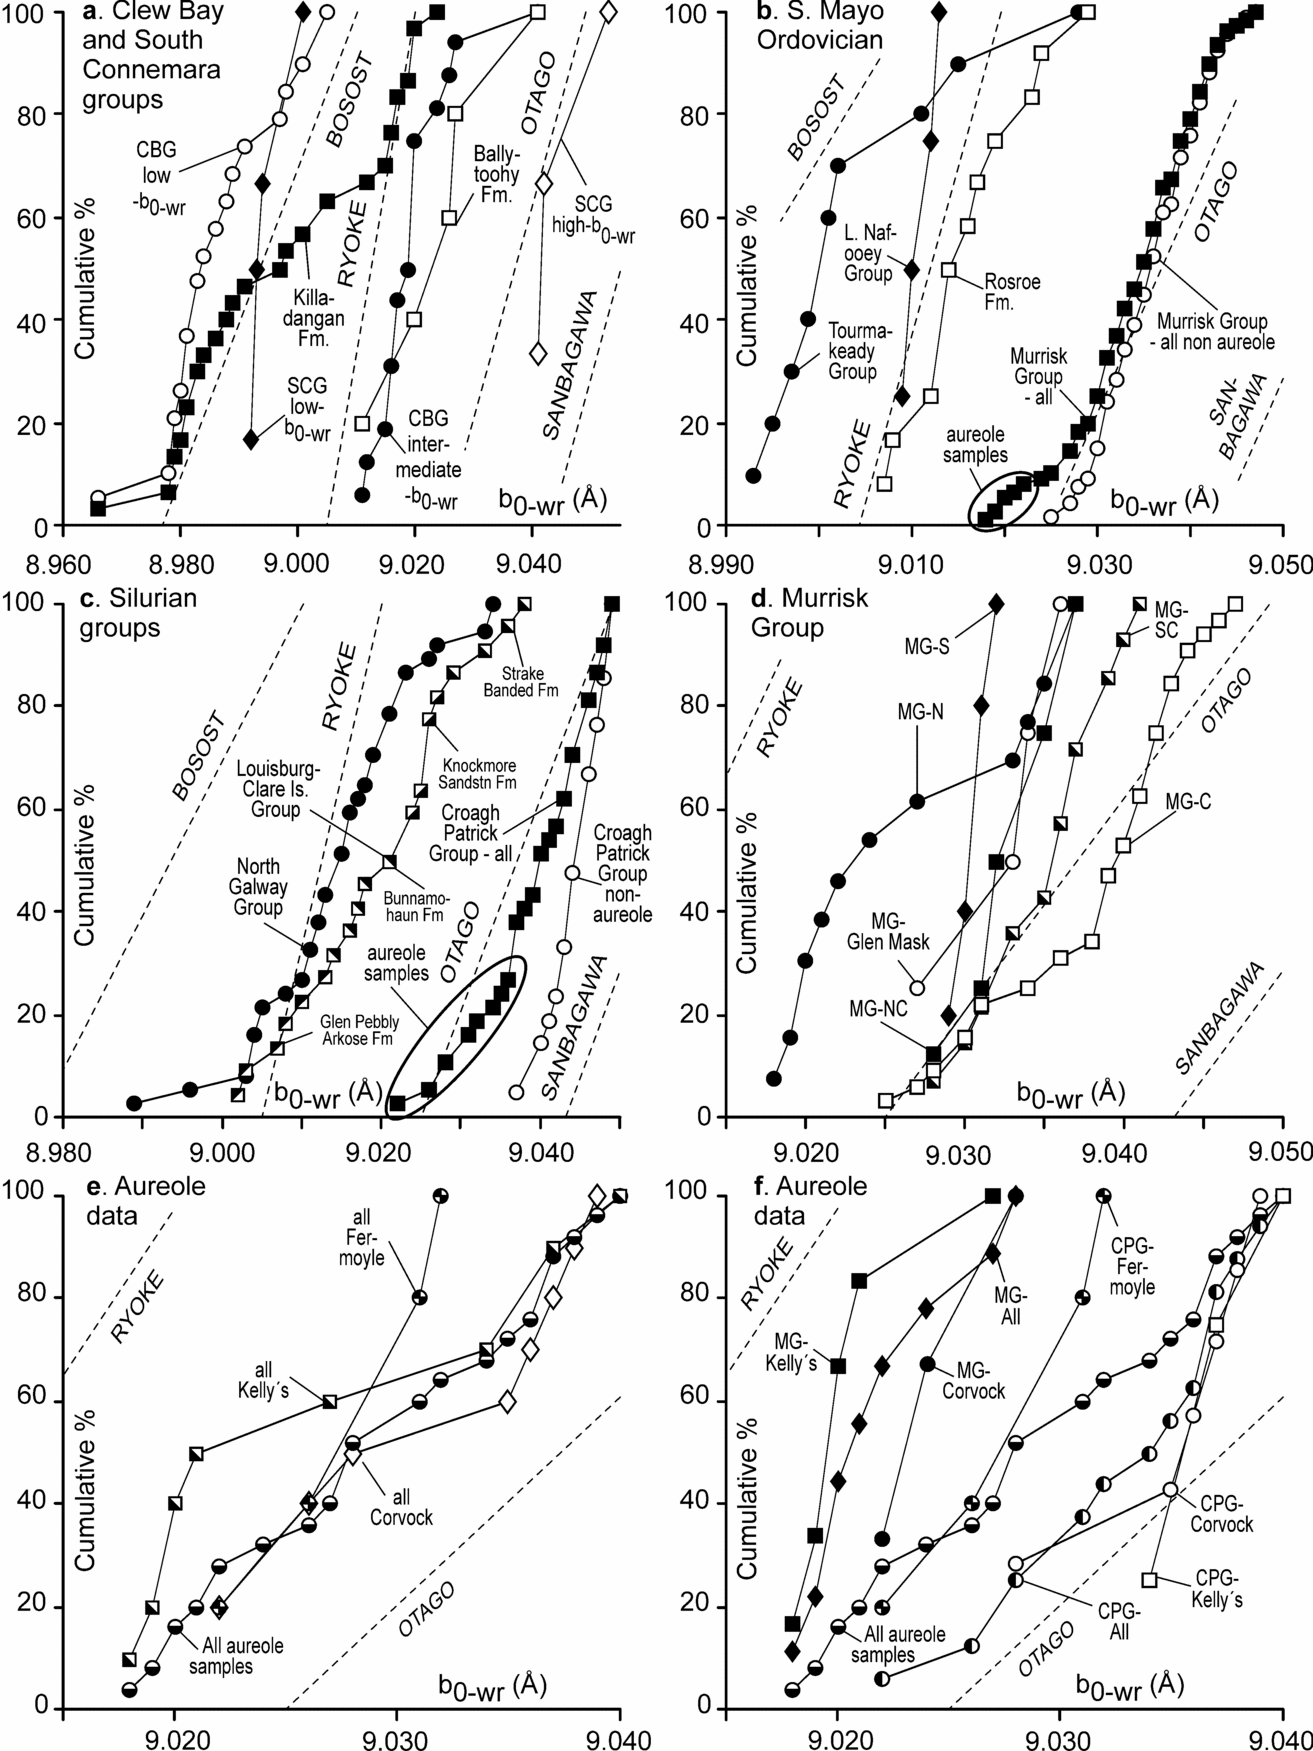
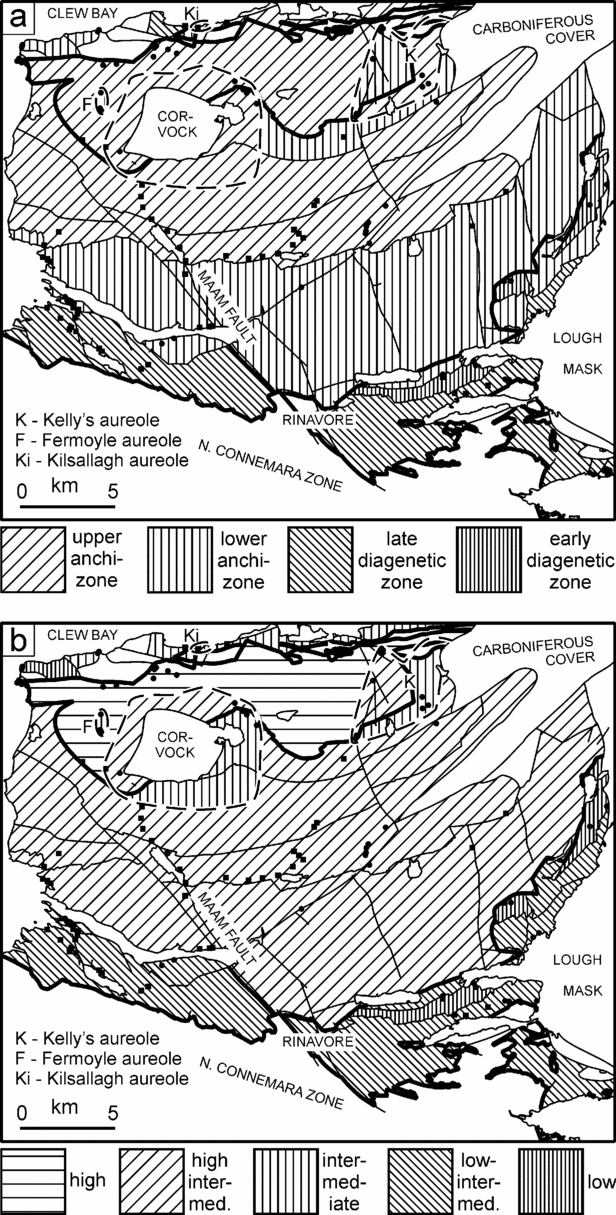
Thirty-four samples were collected from the Killadangan Formation and five from the Ballytoohy Formation (datasets 1–5, Table A1). The bulk (001) and (002) IC data indicate a mean lower anchizone alteration. The bulk mean b0−wr spacing indicates a low baric-type, but a marked low-angled zone (Fig. 6) suggests two datasets are present. Taking 9.005 Å as the boundary value gave two significantly different datasets (Fig. 7b, 8a); the significance is likely partly a result of dividing the data without an overlap. The low-angled zone also occurs in the b0−<2μm data. Low b0−wr data, from the west end of the coastal section, have a lower anchizone (001) IC mean peak-width, while the intermediate b0−wr data, from the east end and Clare Island, have an upper anchizone (001) IC mean (Fig. 7). Similarly, the (002) ChC peak-width is slightly broader for the low b0−wr group, although the difference is not significant (Fig. 7c).
(a) (001) IC, (b) b0−wr and (c) (002) ChC data schematically projected onto a N–S-trending profile through the study area. L.-C. – Louisburg-Clare Island; Knock. S. – Knockmore Sandstone; Bunnamo. – Bunnamohaun; Glen. P. A. – Glen Pebbly Arkose; Croagh P. – Croagh Patrick; S. Conn. – South Connemara. Stratigraphic ranks not given.

5.c.2. Louisburg–Clare Island Group
Twenty-two samples were collected from four fault blocks (datasets 6–10, Table A1). The mean (001) IC peak-width lies on the anchizone–diagenetic zone border. (002) IC and ChC have mean peak-widths in the late diagenetic and lower anchizone, respectively. The bulk mean b0−wr spacing indicates an intermediate baric-type (Fig. 6).
In detail, each stratigraphic unit has different b0−wr and crystallinity ranges (Figs 7, 8c, 9). The Glen Pebbly Arkose Formation has a lower anchizone mean (001) IC peak-width with low baric-type b0−wr and b0−pwr values and a intermediate mean b0−<2μm value. The mean (002) IC and ChC peak-widths lie in the late diagenetic zone and lower anchizone, respectively. The Bunnamohaun Siltstone Formation mean (001) IC peak-width lies in the lower anchizone, with mean (002) IC and ChC values in the late diagenetic zone. The mean b0−wr spacing just lies in the intermediate baric-type field as does the single b0−<2μm result. The Knockmore Sandstone Formation mean (001) and (002) IC peak-widths lie near the late–early diagenetic zones boundary, but the mean (002) ChC peak-width lies in the late diagenetic zone. The mean b0−wr spacing falls in the intermediate baric-type range, while the single b0−<2μm measurement lies in the high-intermediate baric-type range. The Strake Banded Formation mean (001) IC peak-width lies in the upper anchizone, with mean (002) IC and ChC peak-widths in the lower anchizone. The mean b0−wr and b0−pwr spacings lie in the high-intermediate range, while the mean b0−<2μm spacing lies in the high baric-type range.
Cumulative b0−wr plots divided into subareas. CBG – Clew Bay Group; CPG – Croagh Patrick Group; MG – Murrisk Group; S, SC, C, NC, N – South, South-central, Central, North-central, North; SCG – South Connemara Group.

Metamorphic maps of (a) (001) IC, (b) baric-type. The mean value has been used in all cases. For the Clew Bay Group, all the eastern outcrops have been assumed to have the same conditions. For the Louisburg–Clare Island Group, only the fault blocks sampled have been shaded. Contact metamorphic conditions have been shown in the known and inferred aureoles of the Corvock, Fermoyle and Kelly's plutons and in the Kilsallagh area of Clew Bay. The Derryveeny Formation has been shaded the same as the probably correlative Rosroe Formation. Thick lines denote terrane boundaries, including where offset by subsequent normal faults.

5.c.3. Croagh Patrick Group
Thirty-nine samples were examined, including 16 from late- to post-Caledonian contact metamorphic aureoles, or presumed aureoles around unexposed plutons (datasets 11–20, Table A1). The data have a bulk upper anchizone mean (001) IC peak-width with a large range (Figs 7, 9). Peak-widths of (002) IC and ChC have large ranges, with means in the lower anchizone. If samples from presumed contact metamorphic aureoles are excluded, the mean peak-widths become narrower but lie in the same zones. Three crenulated samples have lower anchizone peak-widths; excluding these further reduces the means. The bulk mean b0−wr spacing lies in the high baric-type range but the cumulative frequency plot flattens out at low percentages (Fig. 8c). Excluding the samples from this flattened part gives a steeper cumulative profile, with a high baric-type mean b0−wr spacing, significantly different from the data removed. Of the samples removed, seven come from the Corvock metamorphic aureole; the others come from Fermoyle (five samples) and Liscarney (four samples; Fig. 2), overlying presumed extensions of the Corvock Granite.
5.c.4. Murrisk Group
For this unit, 80 samples were analysed (datasets 22–37, Table A1 at http://journals.cambridge.org/geo). (001) IC peak-widths vary from near epizone to late diagenetic zone values, with a lower anchizone bulk mean (dataset 22, Table A1). (002) IC and ChC peak-widths range from upper anchizone to late diagenetic zone. Excluding presumed contact metamorphic aureoles samples broadens the mean (001) IC peak-width within the lower anchizone (dataset 23, Table A1).
A wide range of b0−wr values were recorded, with a high-intermediate mean (Figs 6, 7). If the analysis with the lowest value is considered anomalous (although b0−<2μm gave a comparable result), the mean is unchanged, but the range and standard deviation drop. The subsequent text does not include this sample; statistics including it are marked b0−wr* (Table A1). The b0−wr cumulative frequency plot has a reduced slope at low percentages (Fig. 8b); excluding these presumed contact aureoles samples increases the mean b0−wr spacing, with a smaller standard deviation within the high-intermediate range.
The data were divided into six subareas (Fig. 2, datasets 24–37, Table A1). (001) IC data from the North subarea have an upper anchizone mean peak-width (Fig. 9). (002) IC and ChC data have smaller ranges, with mean peak-widths in the upper and lower anchizone, respectively. If presumed contact aureole samples are excluded, the mean (001) IC peak-width moves into the lower anchizone; the mean (002) IC and ChC peak-widths also become slightly broader. The bulk mean b0−wr spacing lies in the intermediate baric-type (Fig. 8d); without contact aureole data, it lies in the high-intermediate baric-type zone. The mean b0−pwr spacing is the same as the mean b0−wr spacing, but the mean b0−<2μm spacing is lower, although still in the high-intermediate baric-type.
The five other subareas show a gradual broadening of the mean (001) IC peak-width, from upper anchizone to close to the lower anchizone–late diagenetic zone boundary. A significant difference occurs at the boundary between the Central and South-central subareas, with the southern three subareas having essentially the same values (Table 1A; Figs 7a, 9). The (002) ChC data are similar, with the two northern subareas having statistically identical values in the lower anchizone, near the border with the upper anchizone. The South-central and Glen Mask subareas have comparable values at the lower end of the lower anchizone, with no overlap of standard deviations with either the two northern subareas or with the South subarea, which has a mean (002) ChC peak-width in the late diagenetic zone. In contrast, mean b0−wr spacings all lie within the high-intermediate baric-type range, gradually getting lower in more southerly subareas. The b0−wr standard deviation of the South subarea differs significantly from those of the three northern subareas (Fig. 7). The b0−pwr values are all lower than the b0−<2μm values, by up to 0.005Å.
5.c.5. Rosroe Formation
Twelve samples were collected, including one mud-flake conglomerate (dataset 38, Table A1). The mean (001) IC peak-width indicates lower anchizone metamorphism (Fig. 7a), although the standard deviation overlaps the late diagenetic zone. The mean (002) IC and ChC peak-widths lie in the late diagenetic zone and lower anchizone, respectively. The mean b0−wr spacing indicates a low-intermediate baric-type (Fig. 7b). The mean b0−<2μm spacing indicates an intermediate baric-type, with the large standard deviation overlapping the b0−pwr standard deviation.
5.c.6. Lough Nafooey and Tourmakeady groups
Four Lough Nafooey Group and ten Tourmakeady Group samples were analysed (datasets 39–41, Table A1). Both units gave early diagenetic zone mean (001) IC peak-widths. No (002) IC data are available from the Lough Nafooey Group, due to peak decomposition difficulties, but the Tourmakeady Group has an early diagenetic zone mean (002) IC peak-width. Mean (002) ChC peak-widths from both groups are narrower, with ranges extending into the anchizone. The mean b0−wr value (Fig. 7b) indicates a low baric-type metamorphism. The b0−pwr data from the two groups are slightly higher than b0−wr means, with similar mean b0−<2μm values.
5.c.7. North Galway Group
Thirty-five samples were analysed (datasets 42–44, Table A1); mean (001) IC peak-widths from the eastern and western regions indicate late diagenetic zone alteration, with ranges from the lower anchizone to the early diagenetic zone. The mean (002) IC peak-width lies in the late diagenetic zone while the mean (002) ChC value lies close to the anchizone–diagenetic zone boundary. The east and west areas both have low-intermediate baric-type mean b0−wr values (Figs 7b, 8c). The mean b0−pwr spacing has a large standard deviation overlapping the b0−wr and b0−<2μm means.
5.c.8. South Connemara Group
Three samples from the base of the Lettermullen Formation in the central part of the group's outcrop were analysed and six from the Loch Faoileán and Ryans Farm formations in the west (datasets 45–47, Table A1). The latter six are from close to mafic intrusions (Ryan, Max & Kelly, Reference Ryan, Max and Kelly1983) and the whole area abuts the Galway Granite contact aureole. The bulk mean (001) IC peak-width lies close to the boundary of the upper and lower anchizone, while the mean (002) IC peak-width lies in the lower anchizone. However, the b0−wr cumulative profile shows a pronounced step (Fig. 6). Lough Faoileán Formation samples, which have higher b0−wr values, have an upper anchizone mean (001) IC peak-width, while the other samples have a lower anchizone mean (001) IC peak-width. The Lough Faoileán Formation samples mean (002) IC peak-width is slightly narrower compared to the other formations but both means lie in the lower anchizone. The lower anchizone mean (002) ChC peak-width is the same in both datasets. The Lough Faoileán Formation samples have a high baric-type mean b0−wr and the Lettermullen and Ryan's Farm formations samples a low baric-type mean (Figs 7b, 8a), with no overlap of standard deviations. The b0−pwr and b0−<2μm values for the two datasets are the same or similar to the mean b0−wr values.
5.c.9. Contact Metamorphic Aureoles
Data from the Corvock Granite and Kelly's Pluton aureoles (datasets 15–20, 35–37, 49–50, Table A1) show wide b0−wr ranges, with central low-angled zones, suggesting that some aureoles comprise two datasets (Fig. 8e). In contrast, plotting Croagh Patrick and Murrisk Group contact aureole data separately yields relatively narrow b0−wr ranges (Fig. 8f).
Four Croagh Patrick Group samples from the Corvock Granite contact aureole have an upper anchizone mean (001) IC peak-width, with a high-intermediate mean b0−wr (Fig. 7). The mean b0−pwr is the same, but the mean b0−<2μm is slightly higher. Five samples from the Fermoyle area, just outside the defined Corvock Granite contact aureole (Graham, Leake & Ryan, Reference Graham, Leake and Ryan1989), have a lower anchizone mean (001) IC peak-width, with a mean b0−wr value on the high-intermediate to intermediate baric-types border (Fig. 7b). These low values compared to Croagh Patrick Group samples outside the metamorphic aureoles suggest late contact metamorphic overprinting from unexposed granitoid rocks. Similar values were obtained from b0−pwr, although the mean b0−<2μm value is higher and similar to the b0−wr value of the Corvock contact metamorphic aureole samples. These five samples have a lower anchizone mean (001) IC peak-width. The (002) IC and (002) ChC mean peak-width values both lie on the lower–upper anchizone boundary.
Four Croagh Patrick Group samples from near Knappagh (Fig. 2), with a lower anchizone mean (001) IC peak-width, gave high-intermediate baric-type b0−wr values (Fig. 7) and comparable b0−<2μm and b0−pwr values. The mean (002) IC peak-width lies in the lower anchizone and the mean (002) ChC peak-width on the upper–lower anchizone boundary. These samples are presumed to come from the contact aureole of Kelly's Pluton.
For the Murrisk Group, the upper anchizone mean (001) IC peak-widths from the Corvock Granite and Kelly's Pluton contact aureoles are similar. The (002) IC and (002) ChC also have comparable mean peak-widths, on the upper–lower anchizone border. The samples have intermediate baric-type mean b0−wr values. Mean b0−pwr and b0−<2μm values for the Kelly's Pluton contact metamorphic aureole are comparable, but significantly lower than the value b0−wr.
6. Discussion
6.a. b0 analysis
The b0 method was developed in greenschist-facies rocks and extended into the upper anchizone by Padan, Kisch & Shagam (Reference Padan, Kisch and Shagam1982). Since then, it has been applied to diagenetic zone rocks, giving results ‘compatible’ with other data and the regional geology (cf. Robinson & Bevins, Reference Robinson and Bevins1986; Rice et al. Reference Rice, Bevins, Robinson, Roberts, Daly, Cliff and Yardley1989; Rice & Roberts, Reference Rice and Roberts1995; Warr, Primmer & Robinson, Reference Warr, Primmer and Robinson1991; Stone & Merriman, Reference Stone and Merriman2004; Kemp & Merriman, Reference Kemp and Merriman2008). Similarly, the b0−wr data from diagenetic zone rocks presented here are compatible with the known regional geology. Nevertheless, such results must be treated cautiously in the absence of a theoretical basis.
Padan, Kisch & Shagam (Reference Padan, Kisch and Shagam1982) considered that detrital grains and metamorphic grade (essentially IC) might adversely affect the b0−wr value determined, assuming that a suitable mineral assemblage for b0 analysis was present (cf. Frey, Reference Frey1987). Comparison of grain-size fractions with whole-rock b0 data from epizone–anchizone grade terranes recorded an increase in b0 with decreasing grain-sizes, ascribed to detrital influences (Padan, Kisch & Shagam, Reference Padan, Kisch and Shagam1982), although the differences were less than the data range. Árkai et al. (Reference Árkai, Faryad, Vidal and Balogh2003), however, noted that b0−<2μm was typically, but not always, similar to b0−wr.
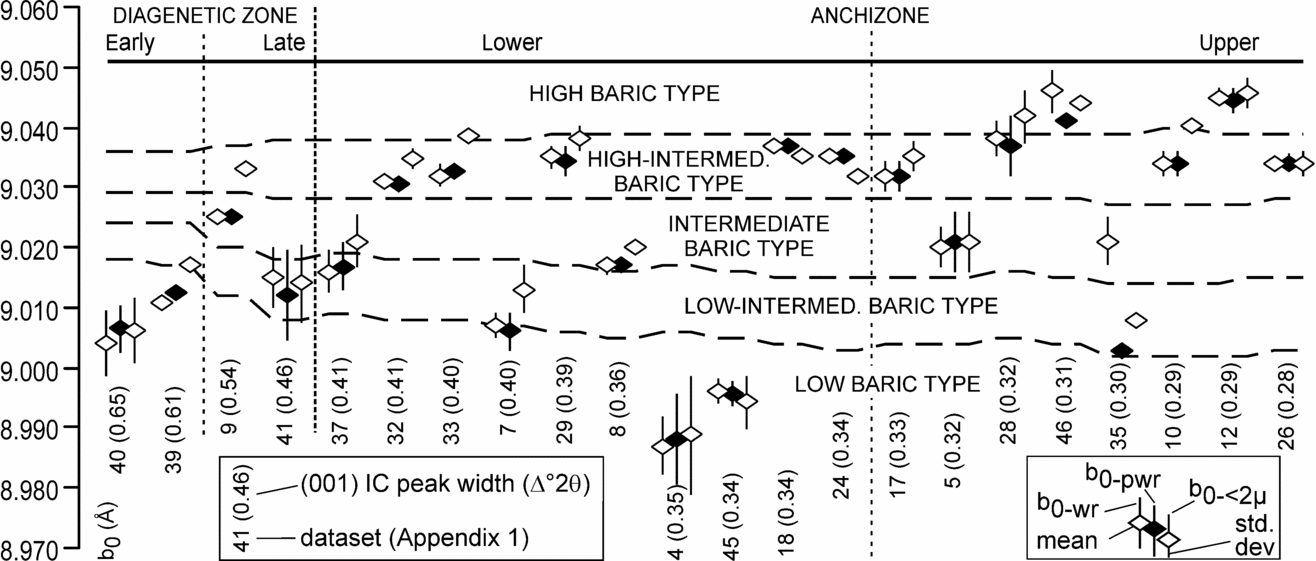
The similarity of b0−pwr and b0−<2μ values reported here suggests that the < 0.25 mm detrital white-mica grains in some samples only slightly affected b0−wr and b0−pwr results. Typically b0−<2μm > b0−pwr although most mean b0−<2μm analyses lie within 0.004 Å of the mean b0−pwr, with overlapping standard deviations (Figs 5, 10). The maximum difference is 0.008 Å. There is no indication that lower metamorphic grades have greater b0−pwr–b0−<2μm differences (Fig. 10). This suggests either that the detrital material forms an insignificant percentage of the total pelitic fraction or that the b0 spacing of detrital grains was reset during metamorphism, as noted by Árkai et al. (Reference Árkai, Faryad, Vidal and Balogh2003). This similarity is important, since most published measurements were dubious, because no tests for the effects of detrital grains were made.
Comparison of b0−wr with b0−pwr and b0−<2μm spacings arranged in order of decreasing bulk (001) IC peak-width determined from the complete b0−wr dataset. Baric-type zones determined from the mean (001) IC value calculated from the samples used to determine the mean b0−pwr, which is why the zone boundaries are not smooth. For datasets, see Table A1 in online appendix at http://journals.cambridge.org/geo.

Only in the Louisburg–Clare Island Group, where (001) IC ranges from the late diagenetic zone to upper anchizone, do the b0−pwr and b0−<2μm standard deviations differ significantly, the mean of the latter being higher. There are, however, large baric-type differences in this group (Fig. 7), so a single detrital source cannot account for all b0−pwr–b0−<2μm differences.
In summary, the effects of detrital grains on the b0−wr results are minimal. Thus, units with two b0−wr populations are taken to have undergone polymetamorphism, rather than having been locally affected by detrital grains.
6.b. P–T–t space
Since the relationship between illite crystallinity and temperature is uncertain and no simple geobarometer is available, very low-grade metamorphism based on clay-mineral X-ray diffraction data is a qualitative part of P–T space. However, as b0 spacing is related to P–T gradients at specific temperatures (Guidotti & Sassi, Reference Guidotti and Sassi1986), this can be used to qualitatively infer pressures, assuming (001) IC as a proxy of metamorphic temperature.
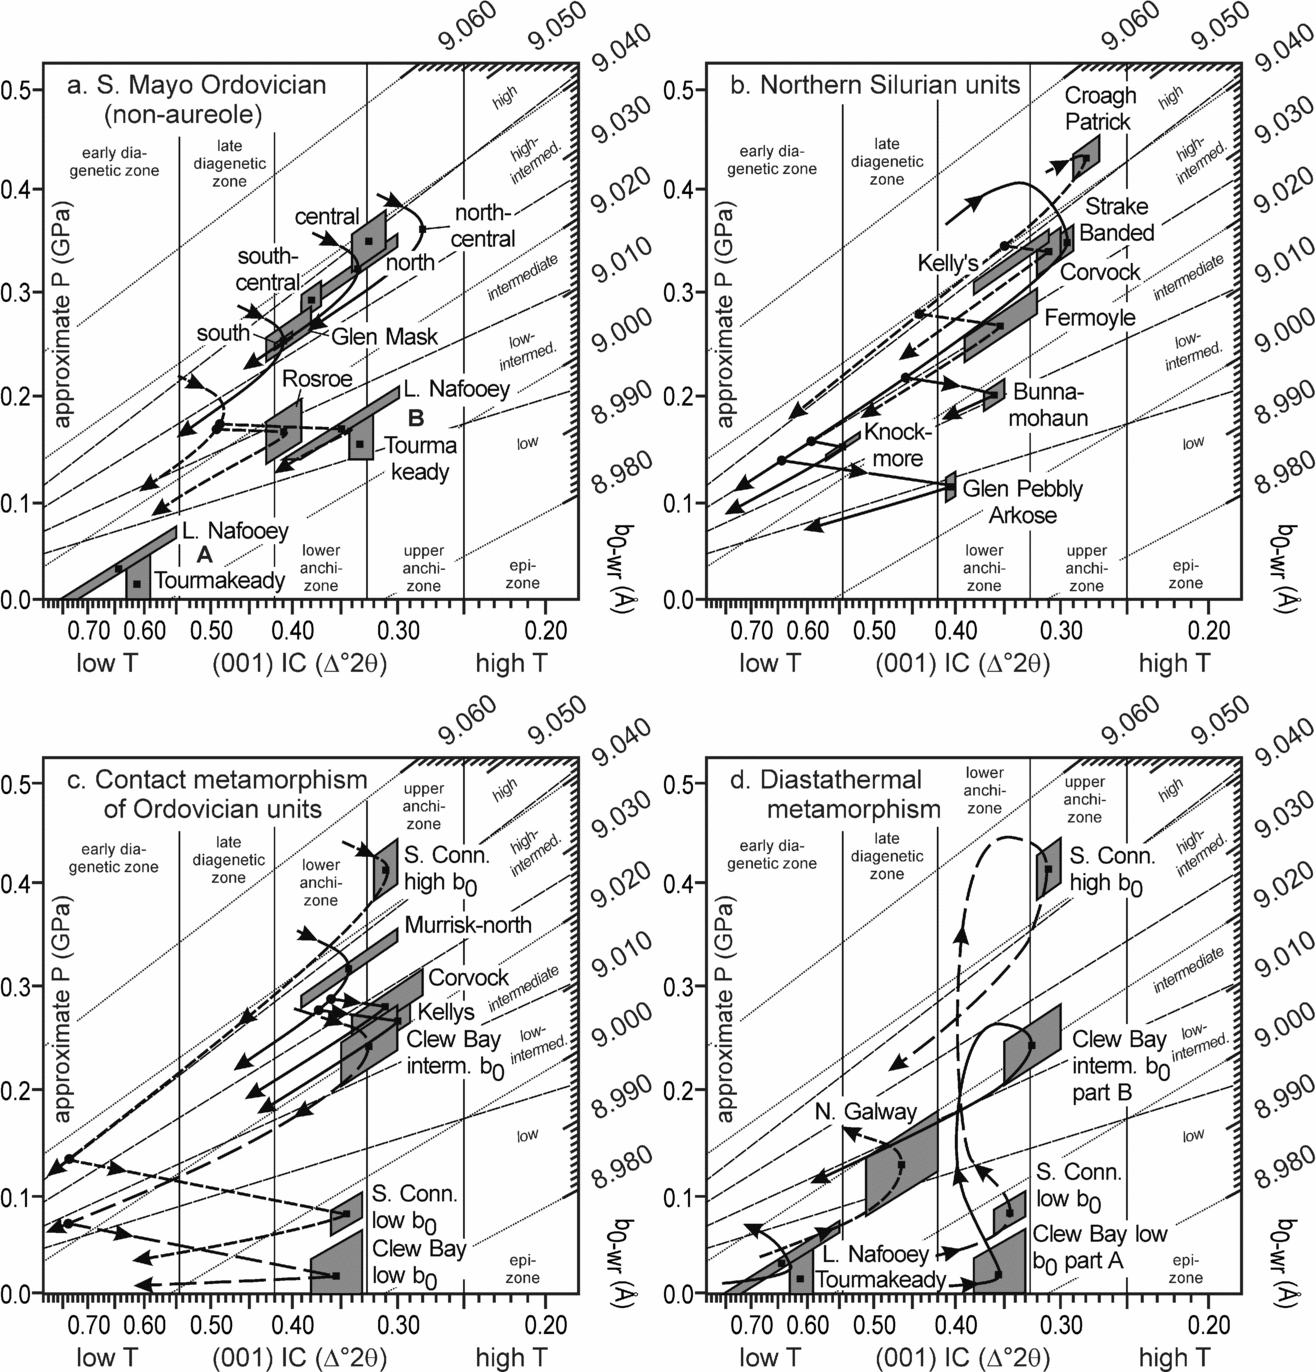
Offler, McKnight & Morand (Reference Offler, McKnight and Morand1998) and Arkai et al. (2003) extrapolated the b0 isopleths to middle anchizone conditions (~ 250 °C) and used them to infer approximate P–T conditions. In Figures 11 and A2, the isopleths have been further extrapolated, into the early diagenetic zone; a linear extrapolation was made to facilitate use, although they are very gently curved (Guidotti & Sassi, Reference Guidotti and Sassi1986). The b0 isopleths generally lie at lower angles than P–T gradients; only at b0 > 9.033 Å are the isopleths parallel or steeper (Fig. A2 at http://journals.cambridge.org/geo). Hence, baric-type boundary values change with IC (001) (Table 1; cf. Padan, Kisch & Shagam, Reference Padan, Kisch and Shagam1982). The b0 range of the three ‘intermediate’ zones decreases with broader (001) IC peak-widths (Fig. 11, Table 1), and, in the early diagenetic zone, their separation is not much greater than the b0 error (Table 3). The b0 range available to the low- and high-baric-types decreases with narrower (001) IC peak-widths.
Mean and standard deviations of (001) IC–b0−wr data, with schematic P–T–t paths. See Figure A2 at http://journals.cambridge.org/geo for an enlarged version of the basic plot.

The approximate pressures indicated on the ordinate of Figure 11 should be treated with extreme caution. By taking (001) IC anchizone boundaries (0.25 and 0.42 Δ°2θ) as being equivalent to about 200 and 300 °C (Merriman & Frey, Reference Merriman, Frey, Frey and Robinson1999) and using a logarithmic scale for illite crystallinity (Merriman & Roberts, Reference Merriman and Roberts2001), an approximate linear temperature scale has been inferred on the abscissa (Fig. A2).
6.c. Terrane analysis and P–T–t evolution
6.c.1. Clew Bay Zone
The kink in the cumulative curve (Fig. 6) separates low b0−wr data at the western end of the coastal section from intermediate b0−wr data at the eastern end and on Clare Island (Fig. 7). The low b0−wr data suggest contact or diastathermal metamorphism. The latter is due to rapid sedimentation onto newly stretched hot continental or young oceanic crust (Robinson, Reference Robinson1987); re-equilibration to a stable geotherm causes anticlockwise P–T–t paths. However, although the low b0−wr data are comparable to Welsh diastathermal b0 values (Robinson & Bevins, Reference Robinson and Bevins1986), the ophiolitic fragments are best preserved on Clare Island, where intermediate b0−wr values occur. Also, local preservation of diastathermal metamorphism in a ‘regional’ subduction event is unlikely.
Alternatively, low baric-type metamorphism could have been caused by an unexposed extension of the Corvock Granite, which lies 3 km to the south, with a broad contact aureole (Fig. 2). The presence of buried plutons east and west of this granite (T. J. Kelly, unpub. Ph.D. thesis, National Univ. Ireland Galway, 1976) suggests they might also occur to the north and have overprinted earlier metamorphism. This is consistent with the intermediate-baric-type metamorphism on Clare Island, further from the Corvock Granite.
The Clew Bay Group underwent subduction-related deformation; the intermediate baric-type metamorphism suggests slow burial, allowing the P–T gradient to move towards a medium-pressure geotherm. Kemp, Oliver & Baldwin (Reference Kemp, Oliver and Baldwin1985) and Stone & Merriman (Reference Stone and Merriman2004) reported similar b0 values (9.023–9.041 Å) for the Southern Uplands accretionary complex. This model infers small-scale S-directed obduction and middle Silurian mélange formation (Williams, Harkin & Higgs, Reference Williams, Harkin and Higgs1996; Williams, Harkin & Rice, Reference Williams, Harkin and Rice1997; Higgs & Williams, Reference Higgs, Williams and Graham2001) on a clockwise P–T–t path, with subsequent contact metamorphism at lower pressures (Fig. 11c).
Chew et al. (Reference Chew, Daly, Page and Kennedy2003) determined D2 ages of c. 460 Ma in the Achill Beg Formation in the north of the Clew Bay Group. This is incompatible with Silurian fossil plants in the Ballytoohy and Killadangan formations (Williams, Harkin & Higgs, Reference Williams, Harkin and Higgs1996), suggesting that the Clew Bay Group comprises a northern segment (Achill Beg Formation) with Ordovician deformation and a southern segment (Ballytoohy & Killadangan formations) with only Silurian deformation (Fig. 3). This implies diachronous basin deformation, similar to the Highland Border Complex, with which the Clew Bay Complex has been equated (Max, Reference Max1989). The boundary between these segments probably had a sinistral strike-slip faulting component.
The Louisburg–Clare Island Group b0−wr data show a continuous cumulative profile (Fig. 6), although each stratigraphic unit has a different range and mean b0−wr (Figs 7, 11b). Similar differences occur in the crystallinity data and consequently in the baric-type. Since each stratigraphic unit was sampled in a separate fault block (Figs 2, 9), each may have had a different P–T history and be partly allochthonous compared to the others. Alternatively, regional metamorphism could have been comparable to P–T conditions in the Strake Banded Formation, with subsequent lower pressure contact metamorphism elsewhere from unexposed late- to post-Caledonian granitoids (Fig. 11b). The wide range of b0−wr values could reflect varying contact alteration times and hence distances from the intrusive contact. This model, which is consistent with that proposed for the Clew Bay Group in the Kilsallagh area (Fig. 2), requires rapid exhumation after intrusion.
The lack of overlap in the standard deviations of the Clew Bay Group and Strake Banded Formation b0−wr data (Fig. 7b) indicates that they were juxtaposed after peak metamorphism. Since the Louisburg–Clare Island Group requires amphibolite facies and serpentinitic source areas (Maguire & Graham, Reference Maguire and Graham1996) and the Deer Park Complex contains such rocks, these units are here combined in an Old Head Subzone, with the Clew Bay Group forming a Kilsallagh Subzone, probably comprising several terranes with different deformation ages (Fig. 3).
6.c.2. Croagh Patrick Zone
Excluding contact metamorphic data, the Croagh Patrick Group results indicate upper anchizone high baric-type alteration (Fig. 11), reflecting metamorphism prior to terrane docking with the Louisburg–Clare Island Group, confirming their status as separate terranes (Williams & Harper, Reference Williams and Harper1991). An exception would be if the Strake Banded Formation b0−wr data do not reflect peak conditions, but a resetting from a pressure facies equivalent to that in the Croagh Patrick Group.
The high baric-type suggests rapid burial with subsequent rapid exhumation, processes generally ascribed to subduction channels. If an Ordovician subduction age is assumed for the Clew Bay Group (cf. Johnston & Phillips, Reference Johnston and Phillips1995), then subduction-related high-pressure alteration of the Croagh Patrick Group would have had to occur in a later subduction event. However, that at least some parts of the Clew Bay Group are of Silurian age is demonstrated by the microflora they have preserved (Williams, Harkin & Higgs, Reference Williams, Harkin and Higgs1996; Higgs & Williams, Reference Higgs, Williams and Graham2001) and this constrains those parts to a Silurian subduction age, potentially coeval with that affecting the Croagh Patrick Group. Since the Croagh Patrick Group rests on Laurentian basement, it must have been separated from Laurentia, likely by strike-slip faulting across promontories (cf. Johnston & Phillips, Reference Johnston and Phillips1995; Williams et al. Reference Williams, Harkin and Rice1997) prior to northwards-directed subduction. This, together with the lack of structural evidence for a distinct two-stage deformation history (subduction and sinistral strike-slip) in the Croagh Patrick Group (Johnston & Phillips, Reference Johnston and Phillips1995) strongly suggests that the two events essentially merged into each other. The Silurian regional strike-slip deformation, recorded as SW-directed sinistral shearing at the base of the group (Johnston & Phillips, Reference Johnston and Phillips1995), could have resulted from initial oblique shortening in a subduction complex, with penecontemporaneous reactivation during dominant strike-slip movement.
6.c.3. South Mayo Zone
The difference in mean b0−wr spacing between the Croagh Patrick and Murrisk groups (Fig. 7b) confirms that these are separate terranes. Thus, no metamorphic link has been established between the three northern tectonic zones, prior to granitoid-related contact metamorphism (Fig. 3).
The Murrisk, Lough Nafooey and Tourmakeady groups and Rosroe Formation are nowhere linked stratigraphically (Figs 2, 3), although previously interpreted as a continuous sequence (Clift & Ryan, Reference Clift and Ryan1994). The Rosroe Formation and Lough Nafooey Group are unconformably overlain by the North Galway Group, which also rests on the North Connemara Zone (Figs 2, 3). The Tourmakeady Group, structurally lying between the Rosroe Formation and Lough Nafooey Group, must also have been overlain by the North Galway Group (Fig. 3).
The Murrisk Group b0−wr data differ significantly from the Lough Nafooey and Tourmakeady groups data; although they overlap in stratigraphic age (Figs 3, 7b), they cannot have been part of the same sequence originally. Thus, as noted by Johnston & Phillips (Reference Johnston and Phillips1995), tectonic models cannot assume that the present positions of the L. Nafooey and Bohaun formations reflect their original relative distribution and so be used to infer southwards-directed subduction (Dewey & Ryan, Reference Dewey and Ryan1990; Clift & Ryan, Reference Clift and Ryan1994).
Similarly, the differences between the Rosroe Formation and Murrisk Group b0−wr data indicate that they cannot have been adjacent during metamorphism/deformation, supporting arguments that the Rosroe Formation is not an across-strike equivalent of the lower Murrisk Group (Williams, Reference Williams2002; Ryan & Williams, Reference Ryan and Williams2007; Ryan et al. in press).
Northwards, the Murrisk Group exhibits narrower peak-widths and increasing high-intermediate b0−wr values (Fig. 7). Tuff bands forming chronostratigraphic markers across the Mweelrea–Partry Syncline encompass 470 m of sediment on the south and 740 m on the north limb. Late Silurian upright folding and tectonic thickening of this northwards-thickening sedimentary wedge may have caused the increasing pressure facies towards the north.
The step in the Central subarea b0−wr data suggests that more than one tectonometamorphic event occurred (Fig. 8d), with a higher baric-type (b0−wr > 9.038 Å) locally preserved. However, no field evidence for polymetamorphism has been documented, and a combination of all non-contact aureole Murrisk Group data gives a smooth cumulative curve (Fig. 8b), highlighting difficulties in interpreting irregular cumulative frequency profiles.
The L. Nafooey and Tourmakeady volcanic groups have significantly different (001) IC peak-widths compared to the Rosroe Formation (Fig. 7a). Consequently, the former units have a low baric-type (position A, Fig. 11a) compared to the low-intermediate baric-type of the latter, although the mean b0−wr values are only just significantly different (Fig. 7). The data from the L. Nafooey and Tourmakeady groups could thus be interpreted in terms of an anticlockwise diastathermal metamorphism (Robinson, Reference Robinson1987) due to deposition on hot new oceanic crust (Fig. 11d). Alternatively, Ryan, Floyd & Archer (Reference Ryan, Floyd and Archer1980) reported prehnite–pumpellyite facies assemblages in the L. Nafooey Group, diagnostic of the anchizone (Frey, Reference Frey1987). If anchizone alteration is inferred for both volcanic groups, implying (001) IC peak-broadening, the b0−wr data indicate a low-intermediate baric-type, comparable to that in the Rosroe Formation (position B, Fig. 11a). This suggests that peak broadening does not significantly affect b0 spacing (Padan, Kisch & Shagam, Reference Padan, Kisch and Shagam1982). Thus although the Lough Nafooey Fault separates the Rosroe Formation from the volcanic groups, there is currently no evidence that they are different terranes; consequently they have been combined in a Rinavore Subzone, with the Murrisk Group forming an Errif Subzone (Fig. 3).
The North Galway Group low-intermediate baric-type data indicate a slightly lower P–T gradient than in typical collision zones, taken here to reflect deposition on a hot North Connemara Zone during exhumation along the Gowlaun Detachment (Williams & Rice, Reference Williams and Rice1989). The P–T–t path (Fig. 11d) is comparable to diastathermal metamorphism, with sedimentation on thinned continental crust which cooled during deposition; the amount of heating depends on the detachment geometry (Grasemann & Dunkl, Reference Grasemann and Dunkl2003). Similarly, Ordovician rocks in the Rinavore Subzone could have been heated as they moved obliquely onto deeper and hotter parts of the Gowlaun Detachment footwall, giving a contact type of metamorphism (Fig. 11a). This model requires that the Connemara Dalradian Supergroup continues to the north, to underlie the Rinavore Subzone.
Johnston & Phillips (Reference Johnston and Phillips1995) suggested that the Lough Nafooey Group was deformed prior to Silurian deposition, although no Ordovician folds were truncated by the sub-Silurian unconformity. These units underwent Silurian compression, with the North Connemara Zone thrust northwards, and the Rosroe Formation thrust southwards, over the North Galway Group. This occurred soon after deposition of the North Galway Group, coeval with the high heat-flow, and hence the two events have been treated as one; this might account for the lack of any relationship between stratigraphic depth and b0−wr in the North Galway Group.
Since all Silurian contacts with the Murrisk Group are tectonic, there is no need to invoke a pre-Silurian, non-cleavage-forming folding event (Dewey & Ryan, Reference Dewey and Ryan1990), removing constraints on the oldest age of deformation. As tectonometamorphism in the southern part of the South Mayo Zone is inferred to have been of Silurian age, as was metamorphism in the Killadangan and Ballytoohy formations and Croagh Patrick Group, the Murrisk Group probably also underwent only Silurian deformation.
6.c.4. South Connemara Zone
The South Connemara Group represents arc–seamount volcanism which approached a trench in Early to Middle Ordovician times (Dewey & Ryan, Reference Dewey and Ryan2004). Low b0−wr values could indicate diastathermal metamorphism, with high b0−wr values from later subduction-related metamorphism (Fig. 11d). However, it is likely that low b0−wr values reflect Galway Granite contact alteration (Fig. 11c) after high-pressure subduction-related metamorphism.
6.c.5. Contact metamorphism
Data from the aureole samples indicate a lower pressure facies than in surrounding rocks, indicating exhumation between peak metamorphism and intrusion, consistent with late- to post-Caledonian emplacement ages (Figs 7b, 9b). In the Croagh Patrick Group, (001) IC peak-widths are broader in the contact aureoles than the country rocks, while in the Murrisk Group they are slightly narrower in the aureoles. In both groups, the b0−wr values drop only slightly, going into the contact aureole, but in the Clew Bay, Louisburg–Clare Island and South Connemara groups the mean b0−wr drops much more significantly. This might be reflecting a larger distance from the intrusion, allowing greater exhumation to occur between peak and contact metamorphism.
Since the Corvock Granite and Kelly's Pluton both cut the boundary of the Croagh Patrick and Murrisk groups the pressure must have been the same in both units during intrusion, although their thermal gradients would have differed. Hence, for each aureole, the b0−wr-(001) IC data should lie on a horizontal line, at the same pressure. Figure 11b, c shows that the Murrisk Group data indicate a lower pressure in both instances. The data from the two groups around the Corvock metamorphic aureole just overlap in pressure space, but for Kelly's Pluton there is no overlap of standard deviations (Fig. 7b). A possible explanation is that the samples from the Murrisk Group lie further from the granite, so contact metamorphism occurred later and thus at a lower pressure; this would require very rapid contemporary exhumation.
7. Conclusions
The b0−<2μm and b0−pwr data show differences that are less than the b0−wr errors; thus detrital white-micas have little effect on b0−wr measurements. Although the b0−wr data from lower anchizone and diagenetic zone samples gave results consistent with other aspects of their geology, such data must be treated with reserve.
Intermediate pressure metamorphism in the Clew Bay Group suggests slow subduction zone burial/exhumation, allowing partial thermal re-equilibration. In contrast, the Croagh Patrick Group underwent high-pressure subduction-related alteration, confirming that it is a separate terrane from the adjacent Louisburg–Clare Island and Murrisk groups. In turn, the high-intermediate pressure metamorphism in the latter is distinct from the low-intermediate pressure metamorphism in the L. Nafooey and Tourmakeady groups and Rosroe Formation to the south. It seems likely that this relatively low-pressure alteration was due to heating by movement over exhuming hot Dalradian rocks, along the Gowlaun Detachment. The North Galway Group was similarly heated at low-intermediate pressures as it was deposited on the Gowlaun Detachment. High-pressure alteration also occurred in the South Connemara Group, although this was locally overprinted by contact metamorphism from the Galway granite. In the north, contact alteration from late- to post-Caledonian intrusions has also been recorded in the Murrisk and Croagh Patrick groups and possibly also in the Louisburg–Clare Island and Clew Bay groups.
These results confirm that studies of very low-grade metamorphism, especially using the b0−wr method can make significant contributions to recognizing strike-slip terrane boundaries.
Acknowledgements
We thank: Christa and Rhian Hofmann for sampling assistance; Margaret and Abigail Gibson for hospitality; Stephen Daly for Louisburg–Clare Island Group localities; Laurence Warr, Susi Gier, Peter Faupl and Michael Wagreich for XRD assistance; Laurence Warr for refereeing the text; Jane Holland and Lori Snyder for their editorial work.