


INTRODUCTION
The international community, through some of its most important international and nongovernmental organizations, has been engaged in a quiet campaign to foster bottom-up political change in developing countries. These interventions, known as community-driven development (CDD) programs, are designed to improve public service delivery in poor areas through the creation of more inclusive governing institutions and social capital. CDD interventions have begun to draw the attention of social scientists.Footnote 1 We contribute to this literature by reporting findings from a randomized field experiment conducted in 24 communities (16 treated and 8 control) in rural Sudan. The program we study, the Community Development Fund (CDF), was a 95-million-dollar program implemented in 616 war-ravaged communities in Sudan between 2008 and 2011. By 2013, 915 projects were completed, providing services to over two million people. These projects included extensive improvements and new construction of primary schools, health, water-supply, and solar-electrification facilities, and midwife training (Gossa Reference Gossa2013). The World Bank launched the initiative to encourage postwar reconstruction and reconciliation following the (temporary) termination of Sudan’s civil war. We assess whether the program caused more participatory local political institutions and increased social capital as was intended.
The theory of how CDD might produce these changes to the political systems of the recipient villages has been somewhat vague both in the policy statements of the donors and the scholarly literature.Footnote 2 Our first contribution is a clearer theoretical statement of how these programs might alter the political landscape of the recipient villages. The model shows that the program could have increased prosociality in recipient villages if only it had expanded villagers’ social networks as intended. Importantly, transforming villagers’ norms to be more prosocial is not a necessary condition for success in the model.Footnote 3 Our main empirical contribution is our measurement of social capital. We adhere to Putnam’s definition of social capital as “. . . social networks and the norms of reciprocity and trustworthiness that arise from them” (Putnam Reference Putnam2000, 19). Similarly Rothstein (Reference Rothstein2005) defines social capital as the number of network links multiplied by the quality of trust between the persons in those links. Thus social networks and their associated prosocial norms (like trust) are the sine qua non of social capital.Footnote 4 We surveyed subjects’ participation in a set of social networks that extensive focus group discussions revealed to be the most important in the communities we studied. Second we used lab-in-the-field techniques to measure norms of trust, trustworthiness, and willingness to contribute to public goods.
Our measurement strategy allows us to isolate the effects of the program on social capital because we measure these two components of social capital directly rather through the outcomes of the program, which may be then confounded by changes in local governance or other factors. Our networks data allow us to test if participation in the public activities mandated by the program encouraged participation in more and broader social networks. Combined with behavioral indicators of prosocial norms from the lab, these data allow us to test if these two components of social capital have improved as a result of the program we study. In addition to allowing us to zero-in on networks and norms, our measurement strategy guards against circularity—measuring an effect of social capital (such as civic participation) and relabeling it the cause. This is a problem that has plagued well-known studies of social capital in the past.Footnote 5 By measuring the fundamental components of social capital we can examine the effects of the program on social capital itself rather than on social outcomes that, if they are associated with the program, may or may not be due to social capital.
Using these two measures we find no evidence that the program increased social capital. Members of treated communities were no more involved in community networks than were members of the control communities; in fact they were significantly less involved on average suggesting that the program may have crowded out some naturally occurring relationships. Consistent with the failure of the program to expand networks, subjects from treated communities did not act more prosocially in the lab. The estimated impacts of the program on lab measures of norms were precisely estimated zeros. Indeed in most cases the estimates of program effects on the lab measures were negative (and very close to zero), alleviating concerns about low-powered tests.
In addition to the networks and norms measures we conducted a household survey of respondents’ perceptions of the inclusiveness of community governance and their self-reported civic participation. Respondents in treated communities felt that their local governing institutions were more participatory than did respondents in control communities, suggesting that the program may have produced more inclusive and participatory governing institutions. According to their answers to our survey, citizens in the treated communities responded to this opening of local governance by increasing their participation in local governance. Consistent with the laboratory measures they did not report engaging in significantly more charitable giving or volunteering in other milieus. In summary, the program appears to have produced more participation in local governance but caused no increase in social capital. Thus we attribute this increase in civic participation to more inclusive local governance and not to increases in social capital, which, in turn, points to a potential pitfall of equating civic participation with social capital: citizens may respond to the opening of local governance with greater participation simply because it increases the expected benefit of participating and not due to any increase in social capital.
CDD AND THE COMMUNITY DEVELOPMENT FUND
CDD has recently been a popular instrument for fostering economic and social development in poor countries (Casey, Glennerster, and Miguel Reference Casey, Glennerster and Miguel2012; Mansuri and Rao Reference Mansuri and Rao2013; Wong Reference Wong2012). The World Bank is particularly committed to the CDD approach. For example, the International Development Association (IDA), the World Bank’s fund for the world’s poorest countries, has averaged over 1.3 billion USD in loans per year to CDD over the last decade. In 2008 alone they allocated almost two billion USD to CDD projects (IDA 2009). There are several varieties of CDD programs. The type we study here offers grants for new community infrastructure, physical capital investments in schools, clinics, water points, and solar electrification.Footnote 6 Beath, Christia, and Eniolopov (Reference Beath, Christia and Eniolopov2012a ,Reference Beath, Christia and Eniolopov b ; Reference Beath, Christia and Eniolopov2013), Casey, Glennerster, and Miguel (Reference Casey, Glennerster and Miguel2012), and Fearon, Humphreys, and Weinstein (Reference Fearon, Humphreys and Weinstein2009) also evaluate this type of CDD program. These programs require the communities themselves to identify their needs and priorities through a participatory process rather than having these decisions made for them by an authority. This participatory approach grew out of a variety of concerns, one of which was the observation that, with the old top-down approach, communities often failed to maintain these infrastructure investments once the donor was no longer involved. As Ostrom (Reference Ostrom, Dasgupta and Serageldin2000b ) pointed out in a World Bank produced volume:
Only the crumbling remains of poorly maintained . . .facilities are left today in many countries for all the billions invested. There is a serious need to rethink the overemphasis on physical capital alone. The recent groundswell of attention in the development literature on social capital is a refreshing and needed change.
Thus a recognition that social capital investments were as important as physical capital investments to preempt future “crumbling remains” was a major impetus to CDD programming.Footnote 7 CDD programs attempt to increase citizen participation in local governance by establishing village development committees and requiring relatively frequent community-wide meetings for selecting, planning, and monitoring the local public infrastructure projects. These efforts are combined with civics training and social mobilization to build social capital, foster local collective action, and instill a sense of local ownership of the project. CDD programs also often seek to improve inclusion of marginalized groups, especially women, in community governance.
CDD is seen as a particularly effective approach in postconflict countries because, by requiring community members to work cooperatively, CDD is argued to restore social cohesion. The following types of claims are common:
CDD has proved an effective way of rebuilding communities in post-conflict situations. By restoring trust at a local level and rebuilding social relationships, it has produced valuable peace dividends in places like, Afghanistan, Bosnia-Herzegovina, East Timor, and Rwanda. (IDA 2009, emphasis added).
Thus restoring these two components of social capital—social relationships (i.e., networks) and prosocial norms like trust—are important goals of these programs, and according to this assertion, CDD has been effective in delivering them.
No country is more in need of a “peace dividend” than Sudan, which has been in a state of civil war with only brief interruptions for three decades. The Community Development Fund (CDF) was designed alongside the Comprehensive Peace Agreement of October 2005 to address potential underlying economic causes of Sudan’s civil war and any destruction of public infrastructure and social cohesion as a result of the violence. The four states chosen for the program, South Kordofan, North Kordofan, Kassala, and Blue Nile, were selected with a peace-building goal in mind. Each of these states has been scarred by war over the last three decades. The reemergence of war in Blue Nile and South Kordofan made it impossible for us to complete the study in those two states and we are only able to report results from North Kordofan and Kassala.
Building social capital was an important goal of the project and was mentioned in a multitude of project documents. For example according to project documents from June 2008, CDF staff provided “training and capacity-building for better management of sub-projects to ensure sustainability and build social capital in socially fragmented communities.” From a request for funding in 2005 one of the three “main outcomes supported by the project” was to “. . .develop social capital at the local level by strengthening the role of local partners in implementing social development activities” (World Bank 2005). Thus building social capital was central to CDF’s goals from the start. The program sought to accomplish this goal with a community participatory approach to infrastructure building in which the villagers themselves selected the infrastructure project, contributed resources to building it, and took over management of it.
“Social mobilizers” were dispatched to each village. They established community-based organizations in all 616 program communities to assess the communities’ development needs and assets. Social mobilizers helped the residents of the villages complete a “community scorecard” through which villagers came to a collective understanding of their community’s development and infrastructure needs and identified assets that could be used to help meet those needs. Through this exercise the social mobilizers taught the community that they had capacity to solve some of their own problems through collective action, a message that was reinforced by requiring the community to supply at least ten percent of the cost of its chosen project through monetary or in-kind contributions. They also organized frequent community meetings to ensure transparent project planning, procurement, monitoring, and evaluation processes.Footnote 8
EXISTING EVIDENCE
Unfortunately the empirical record suggests that international efforts to build social capital in developing countries have come up short. A main theme of Ostrom’s work was that institutions and social capital could be improved by self-organized locals but that changing them through international intervention was very difficult (Ostrom Reference Ostrom1990; Reference Ostrom, Dasgupta and Serageldin2000b ). In a panel study spanning seven years, Krishna (Reference Krishna2007) corroborates Ostrom’s qualitative impressions. He shows that international interventions (as well as interventions by national government agencies) had no effect on the growth of social capital in the Indian villages he surveyed. Importantly he was able to detect growth in social capital even after just seven years. Consistent with Ostrom’s claims, though, the new social capital was created by homegrown initiatives, not outside interventions. While seven years is long in comparison to other studies of social capital (including this one) his findings also speak to critics who contend that it is not possible to improve social capital except in the long run.
A variety of studies evaluate the effects of CDD programs on social capital directly. The central finding has been that their impact is mixed at best. Wong (Reference Wong2012) offers a review of 14 such programs. She concludes that while these programs do improve local public service delivery, they have no impact on local social capital. Similarly Mansuri and Rao (Reference Mansuri and Rao2013), in their extensive study of participatory development programs, point to the difficulty that these programs have in overcoming local collective action problems.
Casey, Glennerster, and Miguel (Reference Casey, Glennerster and Miguel2012) evaluated a World Bank program in Sierra Leone very similar to CDF.Footnote 9 They find no impact of the project on village decision-making processes, inclusion of women or communities’ abilities to raise money for public goods. Fearon, Humphreys, and Weinstein (Reference Fearon, Humphreys and Weinstein2009), in a randomized study of a CDD program in Liberia, found that the program significantly increased villagers’ contributions to a development project, however this result was limited to the behavior in one treatment arm—mixed groups of men and women. All-female groups of subjects showed no difference between treated and control communities. Humphreys, de la Sierra, and van der Windt (Reference Humphreys, de la Sierra and van der Windt2012) completed an extensive randomized study of a community driven reconstruction project in eastern Congo, examining many possible impacts of the program, including its potential effect on local governance and social capital. They found no noteworthy impact of the program along either of those dimensions. In their measures of quality of local governance, which generally had to do with transparency, honesty, and inclusivity, both the treated and control communities scored quite highly and, like Casey, Glennerster, and Miguel (Reference Casey, Glennerster and Miguel2012), they found no significant difference between them.Footnote 10 Social capital, measured by survey responses to hypothetical survey questions about trust, sharing and other prosocial behaviors, also exhibited no significant differences between the treated and control communities. Labonne and Chase (Reference Labonne and Chase2011) used difference-in-difference estimation and propensity score matching to identify the causal effects of the program they studied in the Philippines. The program they evaluated appeared to increase participation in some community activities but it also appeared to reduce it in others, suggesting that perhaps the greater participatory demands of the program may have crowded out other civic activities (a point we return to later).Footnote 11
Taken together these studies indicate that the causal chain between CDD and social capital is weak if not broken. Our formal model clarifies the links in this chain and thereby identifies where the chain may be breaking. Our measurement approach focuses directly on networks and norms to show that the first of these links (and therefore the second) was not enhanced by the program.
A THEORY OF CDD-GENERATED SOCIAL AND POLITICAL CHANGE
In the Appendix we present simple formal models of the possible effects of a program like CDF on trust relationships and public goods provision in the villages where they are implemented. The main direct effect of the program assumed in the model is an expansion of social networks—citizens make new friendships and other social connections through participation in the program’s community meetings. This expansion of social networks then leads to an expansion of the application of prosocial norms. The model also assumes the creation of more participatory local governance which has a direct effect on increasing civic participation by increasing the expected value of that participation.
To some theorists (Putnam, Leonardi, and Nanetti Reference Putnam, Leonardi and Nanetti1993), for any policy to have a “theory of change” of social capital misunderstands social capital’s very nature. For these theorists social capital is not mutable by social programs but is instead built up over generations. As Krishna observed:
Putnam . . .presents us with a nagging conundrum. While demonstrating that social capital matters critically for government performance he claims that this asset cannot be grown. . . . Social capital matters and at the same time it does not for if one can do nothing to grow social capital then practically speaking why does it matter what difference social capital can make? (Krishna Reference Krishna2007, 941)
Not all social capital theorists are as pessimistic as Putnam about the prospects for growing social capital. Rothstein (Reference Rothstein2005), for example, completely reverses Putnam’s causal sequence: Putnam claimed that social capital in society creates good institutions in government while Rothstein argued that good governing institutions (fair, deliberative, impartial, and open instiutions, which he called “universal”) create social capital in society. If one accepts Rothstein’s argument then CDD programs’ efforts to create social capital by improving local governing institutions seem neither heroic nor naive. Other preeminent researchers have studied how international interventions can encourage social capital accumulation in developing countries. Indeed one might characterize this endeavor, at least in part, as Elinor Ostrom’s life work, for which she was recognized with the Nobel prize. She clearly thought that building social capital through external intervention was very difficult and often counterproductive (Ostrom Reference Ostrom, Dasgupta and Serageldin2000b ). She did not, however, say it is impossible and her continual research into how to accomplish that goal and her efforts to advise development practitioners (Dongier et al. Reference Dongier, Van Domelan, Ostrom, Rizvi, Wakeman, Bebbington, Alkire, Esmail, Polski and Klugman2002; Ostrom Reference Ostrom, Dasgupta and Serageldin2000b ) suggest that she thought it was a worthwhile endeavor.
There is in fact evidence from multiple sources that social capital can change in relatively short periods of time. Krishna (Reference Krishna2007) found perceptible increases in social capital in just seven years in the Indian villages he studied. Voors et al. (Reference Voors, Nillesen, Verwimp, Bulte, Lensink and van Soest2012) and Gilligan, Pasquale, and Samii (Reference Gilligan, Pasquale and Samii2014) using laboratory measures similar to our own found that exposure to wartime violence (again over a relatively short period of time) produced a marked increase in what they call prosocial preferences (what we call norms). In a somewhat related vein, Apicella et al. (Reference Apicella, Azevedo, Christakis and Fowler2014) found that members of a very isolated tribe in Tanzania developed endowments effects (preferring owned items to unowned items) after a short exposure to market economies.
The first step in our theory is an expansion of social networks through the greater public participation required by the program. The hypothesized expansion of social networks as a result of CDD programs can be found in the World Bank’s policy statements. According to a major World Bank policy statement on CDD:
[CDD] can give . . . communities the opportunity to build social capital . . . by expanding the depth and range of their networks. (Dongier et al. Reference Dongier, Van Domelan, Ostrom, Rizvi, Wakeman, Bebbington, Alkire, Esmail, Polski and Klugman2002, 308)
As villagers participate in the CDD activities they may forge new friendships, thereby creating larger social networks. Feigenberg et al. (Reference Feigenberg, Field, Pande, Rigol and Sarkar2014) provide evidence for this hypothesis: participating in microfinance groups produced positive spillovers in some other social relations, although their measure of networks was limited.Footnote 12 If requiring villagers to attend CDF community meetings had a similar effect we should observe denser social networks in the treated communities. Thus the most direct test of this theory of change is our network survey. If CDD was indeed “expanding the depth and range” of villagers’ social networks we should observe it in our careful cataloging of the relationships that our focus groups identified as the most important to the region we studied.
Thus our first hypothesis is:
Hypothesis 1 Communities that received the program will have larger social networks.
The second link in the causal chain through which CDD may create more prosocial behavior is through the increased application of prosocial norms via expanded social networks. The concept of norms has taken on several disparate meanings in the literature (Ostrom Reference Ostrom2005, Chap. 6). These definitional disagreements need not detain our discussion because what we refer to as “norms” is a set of parameters that play a very clear and specific role in the model presented in the Appendix. We employ the same definition as Ostrom (Reference Ostrom1998): norms are an “internal valuation . . . to taking a particular action.” This is very similar to Becker’s definition of norms as “those common values of a group which influence an individual’s behavior through being internalized as preferences (Becker Reference Becker1996, 225).”Footnote 13 In this sense norms are akin to Andreoni’s (Reference Andreoni1990) “warm-glow” utility. We operationalize norms in the formal model as an added intrinsic payoff from acting prosocially toward persons in one’s network.
Ostrom’s definition distinguishes norms from rules. For Ostrom (Reference Ostrom1998, 9) rules are “shared understandings that certain actions in particular situations must, must not or may not be undertaken and that sanctions will be taken against those who do not conform.” Thus, while rules are enforced by society, norms are not. Instead, according to Ostrom’s definition, norms are internalized: people (usually) choose to comply with them even when no extrinsic punishments are applied because they suffer intrinsic costs for failing to comply with them.Footnote 14 The distinction between norms and rules is not particularly important in our theoretical model but it is important to our measurement strategy: since subjects’ behavior in the lab was anonymous, our lab activities, strictly speaking, measure norms and not rules by Ostrom’s definition. We do not want to overstate this point however: Subjects may rely on heuristics developed in their daily lives when they make their lab decisions. If so, rules or other societal factors that mold these heuristics will impact laboratory behavior through the subjects’ heuristics. Unfortunately due to time constraints in the lab sessions we could not explicitly measure rules without jettisoning some of the measures we did gather. Thus we cannot explore these ideas here. Since we do not have explicit measures of rules we leave them out of the theoretical discussion below in the interests of parsimony. We discuss the role rules may play in our Findings section below.
It is important to note that a CDD program does not need to change norms (or rules) in order to achieve the goal of increased application of prosocial norms. As long as members of a community behave more prosocially within their social network than outside of it, the hypothesized expansion of each person’s network should automatically expand the set of people each villager treats more prosocially. If the program’s educational activities make norms more prosocial it would enhance this effect, but it is not necessary for the program to increase prosocial behavior.Footnote 15 A significant expansion of networks suffices. People may trust more simply because their circle of trust has expanded. They may act more trustworthily and contribute more to public goods simply because they have more friends among the beneficiaries of those actions.
The effect of these changes—the extension of networks and the resulting extension of prosocial norms—on trust and trustworthiness is illustrated with a simple model of the trust game, presented in the Appendix. Players are randomly assigned to one of two roles, A or B, and each A is randomly paired with a B. Both types are given an endowment normalized to 1. Each player in the A role chooses x ∈ [0, 1] to entrust to the player in the B role with whom he is matched. Players in the B role earn β > 1 units of income from each unit of x A sends them. After receiving βx as a result of A’s action, B must then decide how much of her pot to return to A, r ∈ [0, 1 + βxi ]. At the final node, A’s monetary payoff is 1 − x + r and B’s monetary payoff is 1 + βx − r. In addition we assume subjects gain a utility increment from trusting and being trustworthy toward members of their social network. We show that even though subjects do not know their partner in the game the amount the subjects in the player B role return (r) is increasing in the percent of the subject pool in their network and the amount that subjects in the A role give (x) is weakly increasing in the percent of the subject pool in their network.
This discussion leads to the hypothesis that subjects will behave more prosocially in the trust game in groups that contain more members of their social network.
Hypothesis 2 ri is increasing in the size of subject i ’s social network.
Hypothesis 3 xi is increasing in the size of subject i ’s social network.
Combining Hypothesis 1 with Hypotheses 2 and 3 leads naturally to the following two hypotheses about observed behavior in the trust game:
Hypothesis 4 The average amount returned in the trust game will be larger in treated communities than in control communities.
Hypothesis 5 The average amount entrusted in the trust game, will be larger in treated communities than in control communities.
Hypotheses 2 through 5 refer to predicted behavior in our laboratory trust game. In the Appendix we present a second model that offers predictions about behavior in the laboratory public goods game and about self-reported public-goods contributions and civic participation in the survey. The model proceeds in two subgames. First villagers decide whether to participate in the community decision that chooses the public-goods project to build. Civic participation is costly and nonexcludable, so there is incentive to free ride on the civic participation of other villagers with similar preferences. After the public-goods project is selected, villagers decide whether to contribute to its construction (which is costly), again with the incentive to free ride on the contributions of other villagers.
In the model the program affects civic participation in two ways. First more inclusive governing institutions raise the probability that villagers’ civic participation will affect the community’s choice of project thereby increasing the expected value of participation. Second, as in the trust game, if the program promotes the expansion of social networks villagers will be more willing to engage in civic participation, which is a public good, because they gain greater utility from contributing to a public good with people in their network than they do from contributing with people outside their network. In the the second subgame the program increases contributions to the chosen project through two avenues. First due to the increased civic participation just discussed the chosen program is more likely to be one citizens value more highly and therefor citizens are more willing to contribute to it. Second if the program expands social networks villagers will be more willing to contribute to the public goods program because they gain greater utility from contributing to a public good that benefits people in their network.
The public goods model produces a variety of hypotheses. We test four of them in addition to the trust-game hypotheses mentioned above. First, as in the trust game we assume that subjects are more prosocial in groups that contain more members of their social network:
Hypothesis 6 Subject i ’s probability of contributing in the public goods game is increasing in the size of subject i ’s social network.
Combining Hypotheses 6 and 1, the larger social networks that, by hypothesis, are created by the program should elicit greater contributions to community public goods. Thus, in the dichotomous public good game we conducted in the lab:
Hypothesis 7 Average contributions to community public goods will be higher in treated communities than in control communities.
CDD programs purportedly require local governance to be more inclusive, thus:
Hypothesis 8 Community governance will be more inclusive in treated communities than in control communities.
We measured the degree of participatory governance from responses to our household survey.
As shown in the Appendix at the end of this article, within the conditions of the model, citizens should participate more in local governance in treated villages because of the (hypothesized) social network expansion and more inclusive governance as a result of the program. Thus:
Hypothesis 9 Average civic participation will be higher in treated communities than in control communities.
We measured each respondent’s civic participation with self-reported behavior in our household survey.
PROGRAM ASSIGNMENT
Random assignment of the program was conducted in close consultation between CDF leadership and World Bank staff in Washington. CDF staff chose ten target localities (somewhat like counties) in the four targeted states. They then picked the six neediest villages in each locality according to a predetermined scoring procedure. These six villages in each locality were eligible for the program. World Bank staff in Washington then randomly assigned the program to four of the six villages with the remaining two villages serving as controls. Programming began in 2008. We conducted field work in October and November 2011. With the exclusion of South Kordofan and Blue Nile due to the war, we were left with 24 villages (16 treated and 8 control) in four localities in North Kordofan and Kassala. The communities in which we worked are listed in the Online Appendix.
We present pretreatment balance statistics from a baseline survey conducted before our involvement in the project in the Online Appendix. The randomization produced excellent balance. Differences between the household characteristics of treated and control groups are statistically insignificant in all cases. Survey responses about pretreatment social cohesion are virtually identical in treated and control communities in all ten questions and differences between the treated and control communities on these social cohesion measures are statistically insignificant in 9 of 10 questions. The activities of other aid agencies are always a concern in randomized studies for fear that those other agencies may focus programming on control villages and confound the treatment. We asked villagers a battery of questions about the activities of other aid agencies in the treated and control communities. Treated communities were no less likely to receive help from other aid agencies than were control communities. These results are reported in the Online Appendix. Finally due to the extreme geographic isolation of the villages we are unconcerned about control villages being affected by the program through spillover effects.
Table 1 provides manipulation checks on the program from our 2011 survey. Almost all respondents knew where the CDF project was constructed and the average distance from the subjects’ home to the project is a little less than one kilometer. Over 90 percent of the respondents report that the project is intended for all members of the community (not just the elites) and 92 percent report using it frequently. When asked whose idea it was to build the project and where to place it almost half of the subjects reported that it was the people of the community that made that decision (the modal response), suggesting that participatory programming was successfully implemented. About one-third of the respondents did report that it was the community leaders who made those decisions however. When asked a list-all-that-apply question about who was responsible for constructing the CDF project, about 60 percent listed the state government, suggesting a continued sense of reliance on the state to solve collective action problems, however a large percentage (almost half) also listed “people in the community.” Thus a large minority of our respondents seem to have understood CDF’s message of self-reliant collective action. Finally, 85 percent of the respondents reported that they were “very satisfied” (the highest category) with the project. These figures indicate that the CDF project was well known, frequently used, and greatly appreciated throughout the community and that the program’s participatory message was received.
Manipulation Checks: Household Survey Respondents’ Knowledge of the CDF Project

Note: These descriptive statistics indicate that respondents possessed a high degree familiarity with both the CDF project in their community and the social goals of the CDF program. The sample is restricted to treated individuals. Source: Household questionnaire 2011.
† SPLM is the acronym for the Sudan People’s Liberation Movement, the main rebel group in Sudan’s civil war.
MEASUREMENT
Our research design places special emphasis on the measurement of the components of social capital—networks and norms. Measurement of social networks is fairly straightforward. We developed a list of the most important social networks in the communities through focus group discussions with CDF social mobilizers and Sudanese villagers. We completed a matrix of these relationships among our laboratory subjects in each of these categories. For example, every person was asked whether he or she is a family relation to another subject. We aggregated each person’s connectedness to the group by summing the number of relationships each person had in each category and dividing these scores by the total number of subjects in the village’s subject pool, which varied across villages due to attrition in subject recruitment. We instructed our enumerators to crosscheck each relationship with the other person in the reported relationship to make sure that both people agreed they were in such a relationship.Footnote 16
Table 2 provides an overview of the questions we asked and a summary of their responses.Footnote 17 We categorize relationships into five types: (A) basic social relations (family, friends, neighbors and worshipers at the same mosque), (B) favor-exchange relationships where there is some expectation of reciprocity but it is diffuse like babysitting and advice giving, (C) standard economic relationships (buying and selling, working with or for another subject), (D) voluntary groups (joint membership in community-wide service groups like producers groups, parent-teacher associations (PTAs) or women’s groups), and (E) trust-based exchange relationships where expectations of reciprocity are specific, such as a revolving credit groups and labor exchange relationships.
Summary Statistics of Key Network Variables

Note: Each subject was asked whether he or she is in the specified relationship with each other subject in his/her village subject pool. We crosschecked reported relationships with the other subject in the reported relationship. In the two columns under (1) Relative to Group Size we report the percentage of the subject pool that shared the specified link, i.e., we divide each subjects’ total number of relations in the specified category by the number of subjects in the their village and report the average of the values across the entire subject pool. The number of subjects varied across villages due to a small amount of subject attrition. The three columns under (2) Absolute report the mean, standard deviation, and maximum number of relationships in each category across the entire subject pool. Source: Network data 2011.
The data show a large degree of connectedness through basic social relationships but sparse relations otherwise. On average, in this randomly selected group of participants, a subject was family-related to about 22 percent of the other subjects in the village. Neighbor relationships were also quite common with the average subject being a neighbor to about 16 percent of the other subjects in the village. Subjects socialized (i.e., met for dinner, coffee or other social engagements) on average with about 13 percent of the other subjects in the village. We use the terms “socialize with” and “friendship” interchangeably. Our laboratory subjects attended the same mosque with about 39 percent of the other subjects.
The remainder of the relationships show very little interaction. Only three percent attended the same PTA meetings despite the large number of subjects with school-age children and communities that contained only one school. This figure is surprising because 82 percent of the treated communities received a primary school from CDF (see the Online Appendix). None of our subjects were in irrigation groups with each other despite the fact that these groups were flagged as important in our focus-group vetting of the questionnaire and the gravity of water problems in rural Sudan.
Measuring norms is more challenging. Researchers often use surveys in which they effectively ask respondents if they possess a certain norm (e.g., “Do you think people are generally trustworthy?”). Program staff typically stress the importance of prosocial norms in their interactions with treated communities and, of course, they do not operate in the control communities at all. Thus respondents in treated communities may subconsciously feel more compelled to give the “right” answer to such questions than do control-community members, who may not even know what the “right” answer is since they have not received this training. Behavioral measures are designed to elicit responses based on the subjects’ true preferences and beliefs, which is why Casey, Glennerster, and Miguel (Reference Casey, Glennerster and Miguel2012) and Fearon, Humphreys, and Weinstein (Reference Fearon, Humphreys and Weinstein2009) used them.
For the same reason we also rely on behavioral measures but we adopted a different measurement strategy than the above-mentioned studies. We used behavioral games that permit us to measure these attributes through subjects’ behavior in a controlled laboratory setting. Since the games were conducted in the laboratory where subjects interacted with each other anonymously according to precisely the same rules, local governing institutions or informal social punishments should play a substantially reduced role in subjects’ decisions. Governing institutions and informal social punishment no doubt still played some role in subjects’ behavior because they affected the heuristics that subjects brought with them into the lab, but by guaranteeing anonymity and ensuring that each subject faced precisely the same incentive structure we isolated the effect of the program on subjects’ norms to the greatest extent possible. Moving data collecting to the laboratory raises questions about external validity, but we argue that the trade-off (if it exists) is worth it, particularly in light of the established results mentioned above.
We implemented adaptations of well-established games. Games like these were used to measure social capital by Karlan (Reference Karlan2005) and Henrich et al. (Reference Henrich, Boyd, Bowles, Camerer, Fehr and Gintis2004) and in the studies in developing countries as reviewed in Cardenas and Carpenter (Reference Cardenas and Carpenter2008). Ostrom Reference Ostrom2006 (p. 150) advocates using them for precisely the reason we do: “to test the impact of specific variables in . . . controlled settings, something that is never available to a scholar studying field settings.” We conducted two activities to measure the three norms discussed in our formal model: trust, trustworthiness, and willingness to contribute to a public good. We also measured three possible confounders: generalized altruism, measured by willingness to share with the needy, attitudes toward risk, and discount rates. The first of these in addition to being a possible confounder of the three norms in the model is a prosocial norm and therefore of interest in its own right, although we did not discuss it in the model.
The games are described in greater detail in the Online Appendix. We measured subjects’ willingness to share with the needy with a simple alteration of the standard dictator game. Subjects were given three Sudanese pounds in six half-pound coins and asked to decide how much, if anything, of that amount to donate to an anonymous local needy family. We used the standard trust game (Berg, Dickhaut, and McCabe Reference Berg, Dickhaut and McCabe1995) to measure trust and trustworthiness. “Investors” and “trustees”Footnote 18 were each given an endowment of three Sudanese pounds. We tripled the amount sent by the investor to the trustee. Our dichotomous public goods game is similar to the one described in Barrett (Reference Barrett2005). Our measures of the two other possible confounders, risk and time preferences, are described in the Online Appendix.
We are interested in measuring subjects’ norms. Hoffman, McCabe, and Smith Reference Hoffman, McCabe and Smith1998, p. 350, provide a compelling argument for why laboratory activities are well-suited to that task:
A one-shot game in a laboratory is part of a life-long sequence, not an isolated experience that calls for behavior that deviates sharply from one’s reciprocity norm. Thus we should expect subjects to rely upon receiprocity norms in experimental settings [. . .].
While the laboratory activities no doubt seemed quaint to our subjects the activities confronted them with choices that were well known to them: “How much do I give to the poor and how much do I keep for myself?,” “Do I give money to my fellow villager knowing he may not pay me back?” “Do I return money to the fellow villager who trusted me?” “Do I contribute to the group or keep the money for myself?” The lab environment may have been new, but these questions were neither complicated nor abnormal and we expect our subjects to have developed, over the course of their lives, a set of norms for how to answer them. Furthermore we know our subjects understood the games well. The justification for the lab measures is that in the type of one-shot games we implemented subjects will rely on these norms to make their decisions (also see Ostrom Reference Ostrom1998; Reference Ostrom2000a ; Reference Ostrom, Ostrom and Walkeri2002; Reference Ostrom2005).
Total payouts from all five games were aggregated and made in one lump sum at the end of the session. The average payout was approximately 15 Sudanese pounds (roughly five US dollars), about one day’s wage in the rural areas where we worked. Game instructions were given verbally according to a specific script in the local language. Illiteracy rates are very high in rural Sudan, and our subjects were very unaccustomed to using paper and pens, so we had the subjects complete the game tasks for four of the five games under the supervision of a facilitator/record keeper. This is a common practice when conducting games in the field in developing countries with illiterate populations (Henrich et al. Reference Henrich, Boyd, Bowles, Camerer, Fehr and Gintis2004; Karlan Reference Karlan2005). While we were concerned about Hawthorne effects, having the subjects play under supervision was the only way we could ensure that they understood the decisions they were making. Such observation was not required for the public goods game.
All of our facilitators were extensively trained to conduct the activities in as consistent a way as possible and in repeated spot checks we were satisfied that they achieved that goal. In any case, idiosyncratic differences in the way facilitators did their job (which, to repeat, were imperceptible to us) could not have caused any systematic bias in subject’s behavior because subjects were randomly assigned to facilitators. Neither Hawthorne effects nor idiosyncratic differences between facilitators are plausible explanations for our results. We implemented the same protocols and used the same facilitator teams throughout the study. Thus in order to generate our null findings Hawthorne effects or facilitator idiosyncrasies would have had to somehow make subjects in the treated communities behave less prosocially than they normally would (despite the fact that they had been coached on the importance of prosocial behavior for the last several years) or it would have had to make subjects in the control communities behave more prosocially than they otherwise would (despite the fact that they received no such coaching). While we accede that Hawthorne affects may have made our subjects more prosocial in the lab than they would under no observation we can think of no plausible reason why that effect should have been significantly smaller for subjects in treated communities especially since they were the ones who had been coached by the program on the importance of prosocial behavior. Finally, as mentioned above, no observation or facilitation was required for the public goods game and subjects’ behavior in that game is completely consistent with their behavior in the other activities.
The laboratory sessions proceeded as follows: A facilitator explained a single game to the subjects as a group. Subjects were encouraged to ask questions about the game at that time. The facilitators then explained the games further in response to any questions that were raised. Once the group explanation was concluded the subjects were called one-by-one to one of four games stations. The facilitator at the games station again explained the games using the materials at the games station. The facilitator then asked the subject a series of questions to determine if the subject understood the game and the consequences of his or her decision. Only after the subject answered these questions correctly were they allowed to register their decision. Only after all subjects had finished playing the one game did a facilitator go on to explain the next game on the agenda.
The household survey was implemented by enumerators from the Central Statistics Office of the Government of Sudan. The survey team randomly selected 24 households in each of these 24 communities and enumerated these 576 households in October of 2011. Enumerators interviewed an adult member of the household capable of speaking for the household. At the conclusion of each interview the enumerator invited the respondent to participate in the laboratory activities at a later date. Of the 576 households sampled for the survey 475 sent a representative to the games session. The survey always preceded the lab session and the survey respondents were not invited to the lab session until the survey was completed.Footnote 19 We offer post-treatment descriptive statistics for our 576 survey respondents and 475 game participants in the Online Appendix.
FINDINGS
In the tables below we present Ordinary Least Squares (OLS) estimates of the mean of the dependent variable in the control community and the average treatment effect (ATE). In most cases we present these results for each individual measure and then combine the estimates of these individual effects into a single mean effect expressed in standard deviation units, using the same method as Kling, Liebman, and Katz (Reference Kling, Liebman and Katz2007) and Casey, Glennerster, and Miguel (Reference Casey, Glennerster and Miguel2012). There are too many survey questions about participatory governance to report them all individually and so we report only the mean effects of those variables and list the results for individual survey questions used to generate the mean effects in the Online Appendix. Standard errors are clustered at the village level.
Finding 1 Networks are no larger in treated than in control communities.
Indeed they are a bit smaller. This finding refutes Hypothesis 1. We present the results from the network survey in Table 3. The table is split into six sections: basic social relations (A), favor exchange relationships (B), basic economic relationships (C), voluntary groups (D), trust-based relations (E), and a final section that presents the mean effect across all five of these categories (F). For basic social relations the estimated effect of the program is negative—it leads to a reduction in such social relationships. For socializing/friendships the effect is statistically significant. The mean effect of the program on these basic relationships is also negative and significant.Footnote 20 The estimated effect of the program on favor-exchange relationships is close to zero in both cases—one positive, one negative. The mean effect is 13 percent of a standard deviation and not statistically significant. This is the only category where the estimated mean effect is positive. In the remaining three categories (basic economic relations, voluntary groups, and trust-based relationships) the mean effects are negative and not significant. With the exception of advice giving and women’s groups, where the estimated effect was positive but not significant, the estimated effect of the program across all 14 types of social relations was either negative or zero to two decimal places. Averaging the effects of the program across all 14 of these types of relations produces a statistically significant negative mean effect of 0.18 percent of a standard deviation.
Effects of Treatment on Networks

Note: OLS-estimated ATEs. The dependent variable is each subject’s network size relative to village-specific subject-group size. The table is split into parts (A)–(E) for each of the five types of relations indicated. Column headings (1)–(14) refer to the specific network indicated. Section (F) presents the mean effect across all five categories. Standard errors are clustered at the village level and presented in parentheses. *, **, *** indicate significance at the 10, 5, and 1 percent level, respectively. Source: Network data 2011.
A clear picture emerges from these various network results: participation in the selection and planning of these infrastructure projects did not foster other sorts of social relationships. If anything the effect of the program was to reduce the number of these relationships slightly. This estimated mean reduction in relationships is consistent with the findings of Labonne and Chase (Reference Labonne and Chase2011) who conjectured that the CDD program they studied may have crowded out other social activities that would have naturally occurred.
Finding 2 Prosocial behavior in the lab is positively correlated with density of friends and family networks in the subject pool.
This finding corroborates Hypotheses 2, 3, and 6. Behavior in the lab varies in the predicted way with density of the most important social networks in the villages we studied. As mentioned above social networks outside of basic social relationships are very sparse. Therefore we focus on the correlation between density of basic social networks and prosocial behavior in the lab. These results must be interpreted with caution since both are post-treatment measures and as such may suffer from potential confounding. However it is important to establish the predicted correlation between networks and laboratory measures of prosocial behavior to establish their prima facie validity and to comment on the hypothesized causal link between CDD programs and prosociality. Furthermore, from the results in Table 3 it appears that family did not respond to the treatment, reducing concerns about confounding at least with that particular variable, which showed a strong correlation with prosocial behavior in the lab. The results in Table 4 show the relationship between each subject’s density of family, friends, neighbors, and mosque relationships. We report results for sender and receiver behavior in the trust game and contribution in the public goods game. We do not report results for the altruism game because the beneficiary in that game was outside the subject pool. Family and friends networks show a strong positive correlation with prosocial behavior in the lab. People with denser family networks exhibited significantly more prosocial behavior across all three activities. People with more friends in the subject pool exhibited more prosocial behavior in the trust game but not in the public goods game. The remaining two kinds of relationships—neighbors and joint mosque attendance—show little correlation with behavior in the lab, which we attribute to the much less personal nature of these relationships.
Basic Social Relationships and Lab Behavior

Note: OLS estimates. The dependent variable in columns (1) and (2) is the amount sent by the “investor” in the first round of the trust game (Trust). The dependent variable in columns (3) and (4) is the amount returned to the “investor” by the “trustee” as a percentage of the total amount available to the “trustee” (Trustworthiness). In columns (5) and (6) the dependent variable is a dichotomous variable equal to 1 if the subject contributed in the public goods game described in the main text and Online Appendix and 0 otherwise (Public). Regressions in columns (2), (4), and (6) also contain a dichotomous treatment variable and its interaction with the respective network. The networks-based explanatory variables are the relative family relationships (Panel A), the relative friends relationships (Panel B), the relative neighbors-relationships (Panel C), and the relative mosque relationships (Panel D). The number of networks refers to the number relative to subject-group size. Standard errors are clustered at the village level and presented in parentheses. *, **, *** indicates significant at the 10 percent, 5 percent, and 1 percent level, respectively. Source: Network data and behavioral measures 2011.
Finding 3 Subjects in treated communities did not behave more prosocially in any of the laboratory activities than did subjects from control communities.
This finding refutes Hypotheses 4, 5, and 7 and is no surprise in light of the failure of the program to expand social networks—the first step in the causal chain of our theoretical model. The results from the lab activities are presented in Table 5. The table is split into an upper and lower panel. In the upper panel we report the control-group means and ATEs from each of the four games-based measures of prosociality, and measures of two possible confounders (risk attitudes and the discount rate). In the lower panel we report the mean effect of the program across all four of the prosociality measures. There is a very consistent pattern across all four of these measures and their mean effect: the point estimate of the program is actually negative (showing a slight reduction in the prosociality in the treated communities) but the coefficients are very close to and statistically indistinguishable from zero.
Observed Lab Behavior

Note: OLS-estimated ATEs. In the upper panel the dependent variable in column (1) is the amount donated to the needy family, in column (2) it is the willingness to contribute to a collective good, in column (3) it is the amount sent by the “investor” in the first round (generalized trust), in column (4) the amount returned to the “investor” by the “trustee” as a percentage of the total amount available to the “trustee” (trustworthiness). Columns (5) and (6) report possible confounders, i.e., risk choice and discount rate. Fuller game descriptions are provided in the Online Appendix. The lower panel reports the mean effect for columns (1)–(4). Standard errors are clustered at the village level and presented in parentheses. *, **, *** indicate significance at the 10 percent, 5 percent, and 1 percent level, respectively. Source: Behavioral measures 2011.
Column (1) in the upper panel shows the ATE on the amount donated to the needy family.Footnote 21 Subjects in both the treated and control communities contributed 1.55 pounds, on average, a little over half of their endowment.Footnote 22 The point estimate of the ATE suggests that persons in treated communities actually contributed slightly less than did those in the control communities but the coefficient is very small and statistically indistinguishable from zero. Column (2) shows the ATE of CDF programming on propensity to contribute in the public goods game. On average about 76 percent of subjects in both the treatment and the control villages contributed to the public good. Again, the point estimate of the ATE is negative, very close to zero and far from statistically significant. Columns (3) and (4) in the upper panel show the estimates from the trust game measures.Footnote 23 The dependent variable in column (3) is the amount sent by the “investor” in the first round, our measure of generalized trust. On average subjects in both the treatment and control communities sent about 1.4 Sudanese pounds, about 47 percent their endowment.Footnote 24 The ATE is, again, negative, very close to zero and not statistically significant. The dependent variable in column (4) is the amount returned to the “investor” by the “trustee” as a percentage of the total amount available to the “trustee,” our measure of trustworthiness. On average, subjects in both the treatment and control communities returned about one-third of their total pot to their “investor.”Footnote 25 As in the other cases the point estimate of the ATE is negative, but statistically it is a precisely estimated zero. The lower panel of Table 5 presents the mean effect of the program across all four of the aforementioned laboratory measures. It is negative and statistically insignificant. The final two columns in the upper panel of Table 5 present the ATEs of our measures of risk preferences and the discount rate. These variables may have been important confounders, but the results show there is no such cause for concern. The attitudes toward risk and the discount rates are statistically identical in the treated and control communities. Finally, while not reported in the main text, we used interactive terms to check if the program had impacts on subgroups such as women or youths. The estimates from these specifications are exhibited in the Online Appendix. In no case did those estimates indicate that subgroups in the treated communities behaved more prosocially than they did in the control communities.
In summary, the results using the laboratory measures clearly indicate that subjects behaved no more prosocially in treated communities than in control communities. The estimates of the treatment effect are very close to zero and the fact that all of the point estimates were negative—the opposite of the hypothesized sign—assuages power concerns. Indeed the mean effect across the four measures of prosociality was borderline significant and negative. Our results are not due to large standard errors around large point estimates but rather the opposite, small standard errors around small (indeed negative) point estimates.
Finding 4 Respondents from treated communities reported that their community governance was significantly more participatory and inclusive than did respondents in control communities.
This finding corroborates Hypothesis 8. There are 16 questions on participatory and inclusive local institutions in the survey. We report mean effects of these various measures in column (1) of Table 6, and results for each of the separate indicators in the Online Appendix. Respondents in treated communities characterized their local government as more inclusive than did respondents from control communities with a mean effect of about 22 percent of a standard deviation. This effect is significant at better than the one-percent level. CDF programmers were particularly concerned that local government became more inclusive of women and so we asked five questions about inclusiveness toward women. We present the mean effects of these five indicators in the second column of Table 6 and results from the individual questions in the Online Appendix. The results show a positive mean effect of the program on respondents’ perceptions of the status of women—20 percent of a standard deviation and statistically significant at the five percent level.
Mean effects of Various Indicators of Participatory Governance

Note: OLS estimated ATEs. Column (1) reports the mean effect of the program on a set of survey measures of participatory governance. The estimated ATEs of the program on each the 16 measures used to estimate this mean effect are reported in the Online Appendix in Table A.7. Column (2) reports the mean effect of the program on a set of survey measures of women’s political and social status. The estimated ATEs of the program on each the five measures used to estimate this mean effect are reported in the Online Appendix in Table A.8. Source: Household questionnaire 2011.
Finding 5 Respondents in treated communities self-report greater civic participation than do respondents in control communities.
This finding is consistent with Hypothesis 9. Results from a variety of questions about civic participation are presented in columns (1) through (8) of Table 7 with mean effects of all eight measures presented in column (9). All of the questions in this table had the form “In the last three years have you done: X?” where X is listed at the heading of each of the columns. The actions about which the survey asked are (1) voting in an election, (2) joining a civic association, (3) contacting an influential person about a problem in the community, (4) contacting the media about a problem in the community, (5) participating in an information campaign about a problem in the community, (6) participating in an election campaign, (7) contacting an elected representative about a problem in the community, and (8) discussing problems in the community with others. These are all yes-or-no questions. The variable equals 1 if the respondent reported doing the listed action or 0 if they did not, so coefficients in columns 1 through 8 are estimates of a linear probability model. The program produced significant increases in four of the eight actions: joining an association, contacting an influential person, contacting the media, and discussing problems in the community with others. The mean standardized coefficient in column 9 implies that the program produced an increase of 22 percent of a standard deviation on average across all eight indicators and this effect is highly significant.
Civic Participation (ℓ i ) and Community Public Goods Contributions (ci ): Self-Reported Behavior

Note: OLS-estimated ATEs. The dependent variable is 1 if the answer to question “In the last three years have you done X” is yes and 0 otherwise; where X is listed at the heading of each of the columns. Column (9) reports the mean effect of the responses on self-reported civic participation from columns (1) to (8) and column (12) reports the mean effect on self-reported public goods contributions for columns (10) and (11). Standard errors are clustered at the village level and presented in parentheses. *, **, *** indicate significance at the 10 percent, 5 percent, and 1 percent level, respectively. Source: Household questionnaire 2011.
Finding 6 Respondents’ self-reported contributions to charity are no larger in treated communities than in control communities.
In addition to the lab measures, we measured contributions to community public goods with two questions in the household survey. The results are presented in columns (10) and (11) of Table 7 with mean effects in column (12). The questions are of the same form as the other eight questions in the table and they ask about (10) making a monetary or in-kind donation to a charitable organization and (11) volunteering for a charitable organization. The mean effect of these two variables in column 12 indicates no significant difference between responses in treated and control communities. These results corroborate the findings in the lab.
The final set of parameters in our theoretical model are the costs of provision of public goods and civic participation. The focus of our inquiry was social capital and political participation, so we could not gather laboratory measures of these cost parameters due to time and resource constraints. However, as shown in the Online Appendix, residents of program villages received significantly more training and felt that their sources of information were better than did residents of control villages, with a strong average affect of 34 percent of a standard deviation. If this training and information provision was successful it should have reduced the costs of collective action in treated community villages although we cannot evaluate the behavioral ramifications of that claim given the measures we have.
Subjects’ actions in the lab were anonymous and so the lab activities mainly measure internalized norms—intrinsic costs and benefits of prosocial action. However, subjects, when making their lab decisions, may have employed heuristics from their daily life that were conditioned by extrinsic social punishments. If there are extrinsic social benefits and punishments that we failed to measure in the lab then these might be another potential explanation for the greater self-reported civic participation. Unfortunately due to resource constraints (villagers’ free time to spend in the lab being the most binding) we were not able to measure explicitly extrinsic social punishments in addition to the measures we did gather, so we cannot test that contention. However we do know that social networks are no larger (in fact a little smaller) in treated communities than they are in control communities. Thus the entities that would have to mete out these extrinsic social punishments are no stronger in the treated communities than in control communities, suggesting that they are an unlikely explanation for the greater civic participation in the treated communities. Furthermore if extrinsic social punishment were an important factor one would expect more of an impact of the treatment on charitable giving and volunteering reported in Table 7. Therefore more participatory policy making institutions and (possibly) lower civic participation costs are better explanations.
Finally, social conflict and social cohesion are not features of our theoretical model or the subject of this article but they are a concern for CDD programmers especially in a highly conflicted country like Sudan, where communities were recently torn apart by war and are currently experiencing an influx of refugees, returnees, and ex-combatants. As such social conflict and social cohesion merit some comment. Did the program create greater social cohesion and less conflict in recipient communities? In general the answer is no. The survey asked a plethora of questions about different aspects of social conflict and social cohesion. The results for each of these individual questions are reported in the Online Appendix. The mean effect of the program derived from responses to these questions was a miniscule seven percent of a standard deviation with a p value of about 0.14.
We can summarize the findings as follows. According to survey responses the program appears to have caused an opening of local governing institutions and citizens appear to have responded by increasing their civic participation. This increase in civic participation occurred despite no expansion of social networks and no apparent wider application of prosocial norms. Thus increased social capital is not an explanation for the increase in civic participation. A more plausible mechanism is that the more inclusive local governance induced greater participation by increasing its expected benefits. It is also possible that the training offered by the program reduced the costs of civic participation although we have no direct evidence of that mechanism. Extrinsic social punishments via rules (to use Ostrom’s term) are a possible but rather unconvincing mechanism given the absence of network expansion or significantly greater self-reported charitable giving in treated communities. Finally we would like to highlight the fairly strong correlation between family and friends networks and prosocial behavior in the lab, corroborating those measures and suggesting that the program’s failure to improve prosocial norms stemmed from its failure to foster larger networks.
CONCLUSION
CDD programs have become a common means of delivering development aid to poor countries. Development programmers were aware that previous infrastructure projects ended up as “crumbling remains” (Ostrom Reference Ostrom, Dasgupta and Serageldin2000b ) because their beneficiaries failed to maintain them after the donors withdrew. Therefore they adopted CDD to ensure that the programs offered infrastructure investments that the recipients most valued and to improve communities’ ability to overcome the collective action problems inherent in maintaining the new infrastructure after the donors left. To that end CDD was designed to leave the recipient communities not only with increased stocks of physical capital but also with increased stocks of social capital to forestall the rapid depreciation of the physical investment.
We presented a theoretical model of how these programs may create social capital understood as norms and the social networks that support them. The model was based on the premise that people act more prosocially toward those in their social networks than they do to people outside of those networks. The first step in the causal chain between CDD and social capital in our model was that the greater communitywide interaction that was required by the program expanded villagers’ social networks. In this way the program could accomplish an expansion of the application of prosocial norms even if it did not change the norms themselves. Obviously the effect would be even stronger if the program were able to make norms more prosocial. The model also illustrated how creating more inclusive village governing institutions could encourage more civic participation and greater contributions to public goods.
We tested the predictions of this model with data from a randomized study of one such program in war-ravaged Sudan. Did the program we study create social capital, understood as prosocial norms and the social networks that support them? The answer to that question based on our analysis is clearly “no.” Networks did not expand as a result of the program. On the contrary, they were a little smaller. Furthermore norms, those intrinsic costs and benefits that induce people to act more prosocially, did not change as a result of the program as evidenced by subjects’ behavior in laboratory activities. Survey responses clearly indicated that local governing processes became more inclusive, and this appears to have been a contributing factor to villagers becoming more civically active. We found a clear positive correlation between family and friends networks and prosocial behavior in the lab, a finding that corroborates the intuition in much social capital theorizing that prosocial norms are stronger when embedded in strong networks. The finding also suggests that this program might have been successful at building social capital if it had been more successful at fostering friendship networks.
What can these findings tell us about the prospects for international attempts to build social capital in other countries and contexts? Comments on external validity are by their nature speculative since they compare cases researchers did study to cases they did not study. However there is enough mounting evidence of the effects of these programs on social capital in different contexts using different measurement techniques (Casey, Glennerster, and Miguel (Reference Casey, Glennerster and Miguel2012); Humphreys, de la Sierra, and van der Windt (Reference Humphreys, de la Sierra and van der Windt2012); Krishna (Reference Krishna2007) are exemplary) that we can begin to say with some confidence that these programs do not produce social capital. What we offer that is new is a clearer theoretical statement combined with evidence about how these programs fail to produce social capital: they failed to expand networks and the resulting wider application of prosocial norms. The implication is that these programs could work if they were better at fostering social networks.
Also new is our finding of more participatory local governance and greater civic participation, which the above-mentioned studies did not find. Given the novelty of these participation findings future research is necessary to establish the sources of these differences. Furthermore it is not clear that the community-driven and participatory aspects of the program were producing these findings. Those components of CDD are bundled with large public infrastructure investments. Thus it is not clear if the participatory character of the program was necessary for this greater civic engagement: perhaps any infrastructure project would have caused such a response, especially in areas so starved for public investment. Regardless, these participation results do raise a warning about inferring greater social capital from greater civic participation. The model shows that more inclusive governing institutions can increase civic participation independent of any change in social capital, and in this case the data suggest that that is what happened.
The program we study was successful on a variety of dimensions. The recipients of the infrastructure projects are clearly very satisfied with those projects and the program did appear to cause more civic engagement. However, the program clearly failed “to build social capital . . .by expanding the depth and range of . . . networks.” (Dongier et al. Reference Dongier, Van Domelan, Ostrom, Rizvi, Wakeman, Bebbington, Alkire, Esmail, Polski and Klugman2002, 308). Building social capital was a stated goal of the program and thus, while the program accomplished much, the absence of social capital growth is a concern. Without an increase in social capital will the villagers maintain the new infrastructure they have been given or if researchers return in a few years will they find nothing but Ostrom’s (Reference Ostrom, Dasgupta and Serageldin2000b ) “crumbling remains?”
APPENDIX
We first present a model of the subjects’ trust game incentives and behavior. Consider a set of subjects
 $\mathcal {N}$
indexed by
 $\mathcal {I}(n) = \lbrace 1, 2, \ldots, n \rbrace$
, who are identical except that they belong to different, possibly overlapping, social networks. Call the set of people that is i’s network, other than i herself,
 $\mathcal {N}_i$
. Two persons are chosen from
 $\mathcal {N}$
and randomly and anonymously paired. Each subject i can observe the other members of
 $\mathcal {N}$
, and therefore knows the probability,
 $p_i = \left|{\mathcal {N}_i} \right|/ \left|{\mathcal {N}} \right|$
, that they are paired with a person in their network although they do not know which of those subjects is their pair. To eliminate unnecessary complications we assume that
 $\mathcal {N}_i$
is nonempty so that pi
> 0∀i. Subjects also know the mass function of the probabilities that people will be matched with someone in their network:
 $f: \mathcal {I} \rightarrow [0,1]$
. If the group of subjects is a random draw from the community this assumption is equivalent to knowing the mass function in the community. With probability one-half one of these subjects is assigned the role of A in a standard one-shot two-person trust game and the other is assigned the role of player B. Both A and B have an initial endowment of 1. A must choose x ∈ [0, 1] to entrust to B. B earns β > 1 units of income from each unit of x received from A and has quasilinear utility 1 + βx − r + u where r is the amount of money B returns to A at the last node of the game and u ∈ {0, U(r/βx)} captures B’s norm for reciprocating A’s trust. One could think of u as B’s “warm-glow” utility from reciprocating A’s trust (Andreoni Reference Andreoni1990). Alternatively one could think of − u as the cost of guilt that is avoided when B reciprocates A’s trust. If A is not in B’s social network u = 0. If A is in B’s network u = U(r/βx), where U(·) is a strictly increasing twice differentiable strictly concave function in
 $\mathbb {R}^+$
. r/βx is the amount that B returns to A relative to the increase in her income thanks to A’s trust. B does not know whether A is in her network so at the last node of the trust game B’s problem is
 $\smash{\max_r}\,1 + \beta x - r + p_B U(r / \beta x)$
. B’s best response function is r*(x) = Γ(βx/pB
) where Γ(·) is the inverse of ∂U/∂r. Since ∂U/∂r is a strictly decreasing monotone function in
 $\mathbb {R}^+$
, its inverse, Γ(·), is also monotone and strictly decreasing, which leads to:
Proposition 1
B’s best-response function, r*(x), is increasing in
 $p_B = \left|{\mathcal {N}_B} \right|/ \left|{\mathcal {N}} \right|$
.
In other words the amount that B returns to A is increasing in the size of B’s network.
A’s utility is given by 1 − x + r + v. Similar to u in B’s utility function v ∈ {0, V(x)} captures A’s norm for trusting B. If B is not in A’s social network v = 0. If B is in A’s network v = V(x), where V(x) is a strictly increasing concave function in
 $\mathbb {R}^+$
. Substituting r*(x) into A’s utility function yields A’s expected utility
 $1+ \sum _{\mathcal {I}} f \Gamma (\beta x/ p_{\mathcal {I}}) - x +p_A V(x)$
. A maximizes its utility by setting
 $$
\frac{1-\sum _{\mathcal {I}} f \Gamma ^\prime (\beta x/ p_{\mathcal {I}})}{p_A}= V^\prime (x).
$$
U(·) is a strictly concave function, so Γ′(·) < 0. V′(x) is a positive-valued strictly decreasing function. There are three possible cases:
-
1.
 $ V^\prime (0) > \frac{1-\sum _{\mathcal {I}} f \Gamma ^\prime (0)}{p_A}$
and
$ V^\prime (1) < \frac{1-\sum _{\mathcal {I}} f \Gamma ^\prime (1)}{p_A}$
,
$x(p_A) > x(\hat{p}_A), \forall p_A>\hat{p}_A$
.
-
2.
$ V^\prime (1) \ge \frac{1-\sum _{\mathcal {I}} f \Gamma ^\prime (1)}{p_A}$
,
$x(p_A) > x(\hat{p}_A)$
or
$x(p_A) = x(\hat{p}_A) = 1$
for
$p_A>\hat{p}_A$
. -
3.
$V^\prime (0) \le \frac{1-\sum _{\mathcal {I}} f \Gamma ^\prime (0)}{p_A}$
,
$x(p_A) > x(\hat{p}_A)$
or
$x(p_A) = x(\hat{p}_A) = 0$
for
$p_A>\hat{p}_A$
.


Thus:
Proposition 2
 $x(p_A) \ge x(\hat{p}_A), \forall p_A>\hat{p}_A$
.
In other words, the amount A entrusts to B is weakly increasing in pA .
We now turn to a model of the hypothesized effects of the program on civic participation and the provision of public goods. Like any theoretical model it is not meant to be a completely realistic portrayal of these societies. Instead it is meant to clarify our variables of interest, how they operate in the villages’ political economies, and how we expect them to change as a result of the program. Consider a community composed of two identical citizens, A and B (the model scales straightforwardly to more citizens), and a leader, L. We will not study the leader’s choices in this model. The citizens must decide whether to participate in the choice of a public goods project and then, once chosen, whether to contribute to it voluntarily. There are two possible projects, 1 and 2. A and B prefer Project 1 and L prefers project 2. The game is composed of two subgames, a civic participation subgame followed by a contribution subgame. The game form of the civic participation subgame is illustrated in Figure 1. L, A, and B are all endowed with one indivisible unit of labor, ℓ
i ∈ {A, B, L}, to exert in the participation subgame at cost e > 0. The leader always sets ℓ
L
= 1. At the start of this subgame A and B simultaneously decide whether to lobby the leader to choose project 1 (ℓ
i ∈ {A, B} = 1) at cost e or abstain (ℓ
i ∈ {A, B} = 0) at cost 0. F(ℓ
A
+ ℓ
B
, α) is the probability that project 1 is chosen; ∂F/∂α > 0 and F(0, α) = 0.
 $\alpha \in \mathbb {R}^+$
captures how participatory the community’s decision-making processes are. α close to zero implies that the citizens have little say in the choice of the project. An example of a function that meets these criteria is
 $\frac{\alpha (\ell _A + \ell _B)}{1+\alpha (\ell _A + \ell _B)}$
.
Participation Subgame

Once the two citizens make their participation decisions the project is chosen probabilistically and the game moves to the contribution subgame illustrated in Figure 2. At the start of this subgame the citizens know which project will be built. They now must decide their contribution—either ci
= 0 or ci
= 1. Contributions are voluntary and cost g > 0. Citizen i ∈ {A, B} receives utility y + Uk
(ci
+ c
j ≠ i
) − cig − (1 − ci
)(c
j ≠ i
)w where y > g is i’s income, k ∈ {1, 2} indexes the project, and
 $w \in \lbrace \underline{w}, \overline{w} \rbrace$
captures the norm—the intrinsic costs (“guilt” or foregone “warm glow” utility) that i pays for not contributing when j does, similar to u and v in the trust game above. If j is in i’s social network
 $w=\overline{w}>0$
. To reduce notation we will normalize
 $\underline{w}$
to 0. Uk
(2) > Uk
(1) > Uk
(0) = 0 and U
1(cA
+ cB
) > U
2(cA
+ cB
) for fixed cA
+ cB
> 0.
Contribution Subgame

Proposition 3 The equilibria of the contribution subgame can be summarized as follows:
-
Case 1 Uk (1) − g < 0 and − w ⩽ Uk (2) − Uk (1) − g:
There are two pure strategy equilibria cA = cB = 0 and cA = cB = 1 and one mixed strategy equilibrium where A and B contribute with probability
$\pi =\frac{g-U_k(1)}{U_k(2)-2U_k(1)+w}$
. -
Case 2 Uk (1) − g < 0 and − w > Uk (2) − Uk (1) − g :
The unique pure strategy equilibrium is cA = cB = 0.
-
Case 3 Uk (1) − g ⩾ 0 and − w ⩽ Uk (2) − Uk (1) − g :
The unique pure strategy equilibrium is cA = cB = 1.
-
Case 4 Uk (1) − g ⩾ 0 and − w > Uk (2) − Uk (1) − g :
There are two pure strategy equilibria ci = 0, c j ≠ i = 1, i ∈ A, B and one mixed strategy equilibrium
$\theta =\frac{g-U_k(1)}{U_k(2)-2U_k(1)+w}$
.


Case 1 is a Stag Hunt game. Case 4 is a Chicken game. The zones where each of these cases hold are shown as functions of g and w in Figure 3. Case 4 is the only bounded set. Cases 1 and 3 extend downward in w and Case 2 extends rightward in g. The conditions of the cases jointly ensure that π and θ are nonnegative.
Zones of the Possible Cases of the Contribution Subgame in gw Space

The several hypothesized effects of CDD on the contribution decision can be seen in Figure 3. The program would like to produce a permanent reduction in g (over and above the funding for the program’s specific infrastructure investment) so that the community will continue to provide a more efficient level of public goods after the donor is no longer involved, especially the public good of maintaining the new infrastructure created by the program. The various training programs conducted by the project are meant to accomplish this reduction in g. If g is reduced from the right of Uk (1) to the left of it, the sets of equilibria shift from Cases 1 and 2 to Cases 3 and 4, where at least one citizen contributes in pure strategies. If g is reduced U(2) − U(1) − g will also shift downward, but that shift will only affect the cutoff between Cases 3 and 4. The following remark identifies an important motivator for creating more participatory governing institutions in the participation subgame. A and B will contribute weakly more to project 1 than they will to project 2.
Remark 1 cA + cB ∣k = 1 ⩾ cA + cB ∣k = 2.
Since U 1(·) > U 2(·) when cA + cB > 0 there is a range of g ∈ [U 2(·), U 1(·)] where A and B will contribute to project 1, either with certainty or in mixed strategies, and where they will not contribute to project 2. This range can be identified in Figure 3. The vertical line for U 2(·) would be to the left of the one shown for U 1(·), reducing the size of Case 3 where both contribute in pure strategies and Case 2 where one contributes in pure strategies and both contribute in mixed strategies with probability θ. Of course if g > U 1(1), A and B contribute to neither project.
Our main interest, of course, is in the effect of improving social capital. The program strives to increase w through the expansion of social networks so that A and B suffer costs
 $\overline{w}$
rather than 0 if they fail to contribute to the project. If g > Uk
(1) a sufficient increase in w moves the set of equilibrium outcomes from Case 2 where both citizens have a dominant strategy not to contribute to Case 1 where they may contribute in mixed strategies or even in pure strategies (they also may not contribute in pure strategies). If g ⩽ Uk
(1), increasing w may have no effect if g is already sufficiently small because both citizens may have a dominant strategy to contribute regardless. However if g is large enough, increasing w sufficiently will move the set of equilibria from Case 2 where either A or B contribute but not both, or A and B contribute only in mixed strategies, to Case 3 where both contribute in pure strategies. The effects of the program on contributions via increases in w can be stated as a proposition:
Proposition 4 Contributions, ci , are weakly increasing in w.
Define U*1 as the equilibrium expected payoff of the contribution subgame when project 1 is chosen and U*2 analogously when project 2 is chosen. Obviously U*1 > U 2* for fixed cA + cB > 0 and equal (at zero) otherwise. Define Δ = U*1 − U 2*. We now move up the game tree to consider the participation decision. Civic participation gives i ∈ {A, B} expected utility F(ℓ A + ℓ B , α)Δ − ℓ i e − (1 − ℓ i )(ℓ j ≠ i )w. F(2, α) > F(1, α) > F(0, α) = 0. The participation subgame is almost identical to the contribution subgame in that civic participation is a public good. When one citizen lobbies, both benefit in expectation from the increased probability that project 1 will be chosen, but only those who exert the effort pay the cost, e. Furthermore as in the contribution subgame they pay costs w if they let down their fellow citizen and fail to lobby when the other did. Not surprisingly then, for a fixed α, the sets of equilibrium outcomes are very similar to those of the contribution subgame:
Proposition 5 For fixed α the equilibria of the participation subgame can be summarized as follows:
-
Case 1 F(1)Δ − e < 0 and − w ⩽ [F(2) − F(1)]Δ − e :
There are two pure strategy equilibria ℓ A = ℓ B = 0 and ℓ A = ℓ B = 1 and one mixed strategy equilibrium where A and B contribute with probability
$\rho =\frac{e-F(1) \Delta }{[F(2)-2F(1)]\Delta +w}$
. -
Case 2 F(1)Δ − e < 0 and − w > [F(2) − F(1)]Δ − e :
The unique pure strategy equilibrium is ℓ A = ℓ B = 0.
-
Case 3 F(1)Δ − e ⩾ 0 and − w ⩽ [F(2) − F(1)]Δ − e :
The unique pure strategy equilibrium is ℓ A = ℓ B = 1.
-
Case 4 F(1)Δ − e ⩾ 0 and − w > [F(2) − F(1)]Δ − e :
There are two pure strategy equilibria ℓ i = 0, ℓ j ≠ i = 1, i ∈ A, B and one mixed strategy equilibrium where A and B contribute with probability
$\sigma =\frac{e-F(1) \Delta }{[F(2)-2F(1)]\Delta +w}$
.


The cases are illustrated in Figure 4. The conditions of the cases jointly ensure that ρ and σ are nonnegative. Holding α constant for the moment, the effects of the program-induced changes in e and w on civic participation are similar to those in the contribution subgame. The program aims to reduce the costs of civic participation by providing information and training to villagers. The program would like to create a permanent reduction in these costs so that civic participation—and the better provision of public goods that may follow—continues even after the donor leaves. Furthermore if the program causes a permanent increase in w, through the expansion of social networks and therefore an expansion of the number of people to whom
 $\overline{w}$
applies it would also increase participation. The effects of reducing e are the same mutatis mutandis as those from reducing g in the contribution subgame and the costs of increasing w are the same mutatis mutandis as the effects of increasing w in the contribution subgame. Thus we can state the following proposition:
Zones of the Possible Cases of the Participation Subgame in ew Space

Proposition 6 Civic participation, ℓ i , is weakly increasing in w.
In addition to lowering the costs of civic participation and increasing the intrinsic costs of free riding in the civic participation subgame the program attempts to make a permanent change in the community’s governing institutions so that they will remain more participatory after the program leaves. The effect of more participatory institutions is apparent in Figure 4. If α T captures the participatory character of treated communities’ governance and α C captures the participatory character of control communities’ governance, then by hypothesis α T > α C . Since F(·) is increasing in α this implies that F(α T ) > F(α C ). Δ is a constant so the hypothesized increase in α as a result of the program shifts the vertical line marked F(1)Δ to the right, increasing the area of Case 3, where both citizens participate with certainty and Case 4 where one citizen participates in pure strategies and both citizens contribute with probability θ in mixed strategies. Depending on the degree of F(·)’s concavity in α it is possible that the increase in α may shift [F(2) − F(1)]Δ − e downward but such a shift will only affect the cutoff between Case 3 and Case 4. Thus there will be regions of the space where citizens will contribute at least probabilistically in treated communities (due to their higher α) but not in control communities. We can state this more formally as:
Proposition 7
 $\ell _i(\alpha) \ge \ell _i(\hat{\alpha }), \forall \alpha > \hat{\alpha }$
.
This implies that there are situations where citizens will participate in mixed strategies, or at least one will participate in pure strategies in treated communities where they would not participate in control communities. The purpose of the hoped-for increase in the participatory character of local governance is to ensure that citizens will continue contributing to public goods after the program leaves. As stated in Remark 1, villagers are weakly more likely to contribute to the project they prefer. Thus setting up participatory institutions that increase the probability that a more preferred program will be undertaken may educe greater contributions for community public goods.
We cannot test directly the model’s predictions about a reduction e and g because gathering measures of them was beyond the (already large) scope of the project and the focus of our study is the effects of the program via social capital. Furthermore collective action costs have already been the main focus of previous work (Casey, Glennerster, and Miguel Reference Casey, Glennerster and Miguel2012). The Online Appendix provides evidence that the program invested in human capital through its training programs. By hypothesis these investments should have produced lower g and e, but we cannot test that prediction directly.
Supplementary Materials
To view supplementary material for this article, please visit http://dx.doi.org/10.1017/S0003055415000210
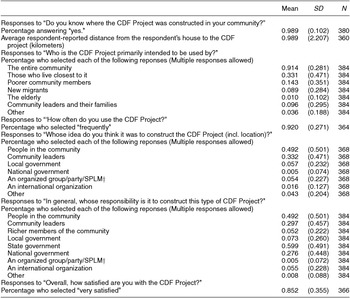
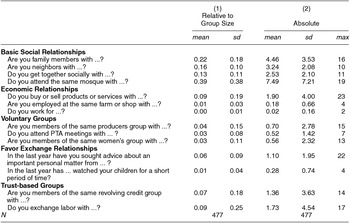
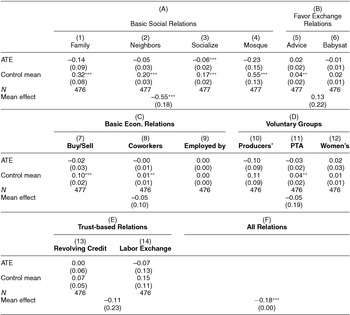
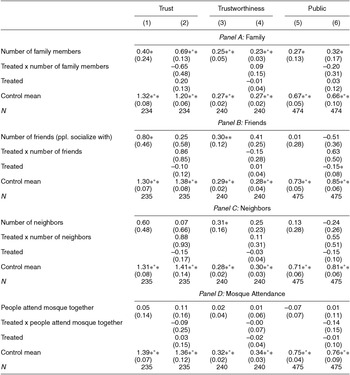
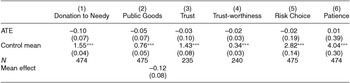
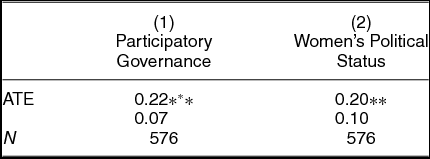
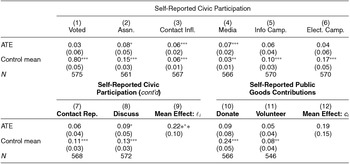


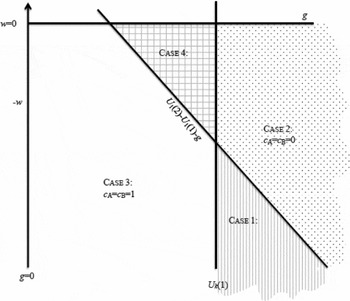
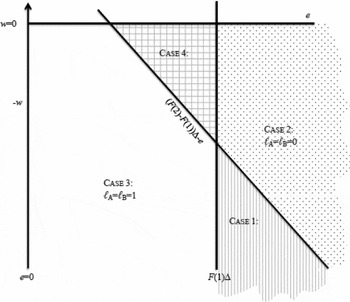




Comments
No Comments have been published for this article.