1 Introduction
Hydraulic fracturing is widely used for the production of oil and gas from shale formations in many parts of the world (Holditch Reference Holditch2007). The process utilises a viscous fluid, usually water, mixed with various additives and injected under high pressure in order to induce deformation and propagate conductive fractures, through which the surface area for fluid–shale contact is significantly increased and hydrocarbon extraction is facilitated. Once the well is depressurised, the flow direction reverses and the fracturing fluid and the hydrocarbons come out through the well-head. The flow generated during the relaxation of the fractures typically results in fluid waste that can amount to a significant fraction of the initially injected volume, in some cases flowing out of the well for decades following the initial fracturing operation (King Reference King2010). This wastewater represents a growing threat to the environment, particularly water resources, which has prompted recent interest in developing fundamental understanding of the dynamics of this so-called ‘flowback’ problem.
Several studies have already accounted for the flow out of a hydraulically fractured elastic or poroelastic medium. Patzek, Male & Marder (Reference Patzek, Male and Marder2013) compared the late-time (
 ${>}3$
months) gas flow, modelled via a nonlinear diffusion equation, to field data from the Barnett shale, the oldest shale basin in the USA. Their analysis showed good agreement with the production data, demonstrating a scaling curve that declines like a
 $-1/2$
power law in time, followed by an exponential decay. Additionally, similar studies by Marck & Detournay (Reference Marck and Detournay2013) and Marck, Savitski & Detournay (Reference Marck, Savitski and Detournay2015) investigating the fluid release from a poroelastic layer bounded by an impermeable elastic space have also shown power-law asymptotic behaviours of pressure and displacement at various time scales.
Before we consider our model for backflow, we discuss briefly the form of some crack networks. Chau, Bažant & Su (Reference Chau, Bažant and Su2016) performed a numerical investigation of the growth of branched three-dimensional hydraulic crack systems. They concluded that the resulting network is expected to consist of roughly orthogonal vertical cracks and that V-shaped branching is not a realistic hypothesis for static crack growth. The present work makes use of a simple model to envision the complex nature of such a network and hence neglects branching angles and junction geometry, which is partially justified due to the low-Reynolds-number flow. Thus, the model is considered to be consistent with a variety of existing ideas on the geometric nature of the network. Another recent study by Santillán, Mosquera & Cueto-Felgueroso (Reference Santillán, Mosquera and Cueto-Felgueroso2017) has analysed the influence of the spatial variability of mechanical properties on the complexity and spatial structure of the trajectories (i.e. the deviation from the straight deterministic path) of fluid-driven fractures in the toughness-dominated regime. They found that most deviations can be characterised using normal distributions and that the absolute maximum deviations of each fracture trajectory follows log-normal distributions whose mean and standard deviation increase with the variability of the properties. Furthermore, heterogeneity in the mechanical properties of the fracturing fluids can significantly influence the complexity of the fluid-driven fracture trajectories.
While the above-mentioned studies have focused on the fracturing stage, the relaxation of a fluid-filled crack when the pressure, responsible for crack opening or filling, is released has only recently been studied experimentally in a controlled manner (Lai et al.
Reference Lai, Zheng, Dressaire, Ramon, Huppert and Stone2016). The fractures were shown to relax without changing their length and the late-time dependence of the aperture closure was shown to tend to a
 $-1/3$
power law, which the authors demonstrated using scaling arguments, coupling fluid flow in a narrow gap with elastic relaxation of the surrounding matrix. This problem was theoretically treated by Dana et al. (Reference Dana, Zheng, Peng, Stone, Huppert and Ramon2018), where, firstly, a single crack was modelled as two parallel rigid plates of a constant length bound by a pre-strained elastic foundation, and secondly, an extension was made to consider a model network comprising
 $n$
generations of repeatedly bifurcating similar channels branching from a single root. Late-time solutions for the aperture and pressure distributions were shown also to tend to a
 $-1/3$
power law in time, and a solution for the late-time maximal pressure in the network was obtained. Although the assumed network structure provided insight on the dynamics of backflow, different branching structures or matrix properties may change the shape of the pressure and volume distributions in the system. Certainly, ‘real’ fracture networks possess far more complex attributes. Thus, a more accurate representation of reality might include, for example, a non-parallel plate geometry, a more elaborate elastic model (e.g. including spring interactions or a poroelastic foundation), irregular variability in distributions of branching and length, interconnectivity between generations, etc.
The various properties (i.e. length, aperture, etc.) of fracture networks, despite extensive study in the past decades, are still subject to a high degree of uncertainty (Bonnet et al. Reference Bonnet, Bour, Odling, Davy, Main, Cowie and Berkowitz2001). Clearly, there is much difficulty in analysing three-dimensional fractures in situ. Therefore, most studies rely on the extrapolation of data from outcrops, core samples and various geophysical techniques. In a review of such studies, Bonnet et al. (Reference Bonnet, Bour, Odling, Davy, Main, Cowie and Berkowitz2001) present a synthesis of data for various fracture properties in natural systems. Length distributions appeared mostly to obey power-law distributions although some exponential and log-normal (mostly in mature or high-density systems) distributions are also possible. Furthermore, according to Bonnet et al. (Reference Bonnet, Bour, Odling, Davy, Main, Cowie and Berkowitz2001), several studies claim that fracture networks exhibit fractal properties, for example in the fracture density (i.e. number of fractures per unit area or volume) or the geometric dimensions. Fractal dimensions, they state, usually do not fully characterise the structural pattern of these networks, but can be useful since they provide a better description of the data than other alternatives.
The model by Dana et al. (Reference Dana, Zheng, Peng, Stone, Huppert and Ramon2018) represents a complex crack network, which is the subject of very limited observations in the current literature, using linear elasticity and two-dimensional geometry. We therefore set out to account for some of the various issues that may occur in more realistic systems. In this paper, we will focus on the geometrical branching and length distribution because they are the most natural evolution of our original model. Length distributions must be accounted for in order to imitate a real network that is likely to show a variability in fracture lengths after it finishes to propagate. We consider branching as a relevant parameter because already today many industrial technologies are seeking structures that may result in more robust and efficient production from fracture networks (Jinzhou et al. Reference Jinzhou, Lan, Cheng and Li2018). We further note that the model presented here may be relevant to other situations that involve the deformation, relaxation or depressurisation of rigid or compliant materials such as, for example, in common microfluidic devices (Weibel et al. Reference Weibel, Siegel, Lee, George and Whitesides2007) or soft robotics (Matia & Gat Reference Matia and Gat2015).
Herein, we generalise the model proposed by Dana et al. (Reference Dana, Zheng, Peng, Stone, Huppert and Ramon2018) to allow variability in both the geometry and the manner in which the elasticity of the surrounding matrix is represented (figure 1). Since there is great variance and uncertainty regarding the structure of fracture networks, we have used a simple length variation in the form of a geometric sequence that provides insight into the dynamics of such a system, though it may not be quantitatively representative of real systems. We assume that the created fracture network relaxes, driven by a linear elastic response to the initial strained state, while retaining a constant fracture length. This relaxation process is resisted by the pressure developed in the viscous incompressible flow within the narrowing apertures.
In order to keep the model simple, we neglect the effects of the precise geometry at the network junctions, as such features only modify the effective resistance of the channel. Furthermore, the model does not account for the effects of wall permeability, surface roughness, multi-phase flow, proppants and other possible extensions (see Dana et al. (Reference Dana, Zheng, Peng, Stone, Huppert and Ramon2018) for a more detailed discussion).
The paper is organised as follows. In § 2 we formulate a self-similar model for the spatially varying properties, namely length, matrix elasticity and number of channels in a generation. In § 3 we present numerical results revealing different dynamic regimes, followed by the derivation of late-time asymptotic solutions for the different cases and a regime plot of qualitatively different asymptotic behaviours. In § 4, numerical solutions are then compared with the asymptotic analyses. In § 5, we analyse the effects of the different parameters on the network drainage time. Finally, in § 6 we make some concluding remarks and discuss the implications for industrial processes.
2 Self-similar parametrisation of a fracture network
Schematic of a model network with self-similar variation determined by three parameters: the length factor
 $\unicode[STIX]{x1D719}^{\ast }$
, the branching factor
 $\unicode[STIX]{x1D6FC}^{\ast }$
, and the elasticity factor
 $\unicode[STIX]{x1D702}^{\ast }$
. Each generation, indexed by
 $i$
, contains
 $\unicode[STIX]{x1D6FC}^{\ast i}$
identical individual liquid-filled channels, which are modelled as two rigid plates being squeezed together by the elastic medium. The details of the flow near the junctions are not modelled. Although the schematic shows the channels in each generation grouped together, in reality the channels are spread out and have any orientation. In the example shown,
 $\unicode[STIX]{x1D719}^{\ast }<1$
and
 $\unicode[STIX]{x1D6FC}^{\ast }=2$
, but any positive real values of
 $\unicode[STIX]{x1D719}^{\ast }$
,
 $\unicode[STIX]{x1D6FC}^{\ast }$
and
 $\unicode[STIX]{x1D702}^{\ast }$
are possible.

We consider a network as a hierarchical structure (see figure 1) originating from a single channel, which we refer to as the outlet or ‘root’ channel with the outlet located at
 $x^{\ast }=0$
. The outlet is the furthest downstream point and the pressure there (for the study of backflow) is assumed to be zero. Upstream, the root channel splits into a number of identical channels that in turn regularly split upstream in a model geometric progression. The complete set of channels at the same distance (or number of nodes) from the root is referred to as a generation. The network is assumed to have
 $n$
generations, which we index using
 $i$
, with
 $i=0$
signifying the root and
 $i=n-1$
signifying the ‘tip’ generation, as shown in figure 1. The tip end of the network is the furthest upstream point(s) in the network and flow cannot occur through it. For simplicity, this work does not consider effects resulting from the geometry of the junctions, for example the branching angles. Since we assume that the fluid flows through long fractures separated by short junctions, the effect of the junction geometry will, due to the low Reynolds number, manifest itself mainly as a small change in the overall pressure drop (Dana et al.
Reference Dana, Zheng, Peng, Stone, Huppert and Ramon2018). The structure of the network is given using a set of parameters (
 $\unicode[STIX]{x1D719}^{\ast },\unicode[STIX]{x1D6FC}^{\ast },\unicode[STIX]{x1D702}^{\ast }$
) that provide each generation with its own properties related to the previous generation by constant factors.
The branching factor
 $\unicode[STIX]{x1D6FC}^{\ast }>0$
is the number of branches into which each channel splits, so that the number of channels in the
 $i$
th generation is
 ${\unicode[STIX]{x1D6FC}^{\ast }}^{i}$
(where
 $i$
ranges from 0 to
 $n-1$
). Similarly, we assume that the length of each channel in the
 $i$
th generation is
 $L{\unicode[STIX]{x1D719}^{\ast }}^{i}$
, where the length factor
 $\unicode[STIX]{x1D719}^{\ast }>0$
. Finally, the elastic stresses in the medium are assumed to result in a linearly elastic law (see (2.2b
) below) for each channel, with effective elastic modulus (per unit length)
 $\hat{E}{\unicode[STIX]{x1D702}^{\ast }}^{i}$
in the
 $i$
th generation, where the elasticity factor
 $\unicode[STIX]{x1D702}^{\ast }>0$
. For example, for a finite elastic layer,
 $\hat{E}{\unicode[STIX]{x1D702}^{\ast }}^{i}$
would be its Young’s modulus divided by its original (pre-strained) thickness. The elasticity parameter is such that, when the pressure is uniform, it satisfies
 $p_{i}^{\ast }={\unicode[STIX]{x1D702}^{\ast }}^{i}\hat{E}h_{i}^{\ast }$
, where
 $p_{i}^{\ast }$
and
 $h_{i}^{\ast }$
are the pressure and aperture of the
 $i$
th fracture. (This set-up is a generalisation of the case
 $(\unicode[STIX]{x1D719}^{\ast },\unicode[STIX]{x1D6FC}^{\ast },\unicode[STIX]{x1D702}^{\ast })=(1,2,1)$
, i.e. a bifurcating system with uniform elasticity and fracture lengths, studied by Dana et al. (Reference Dana, Zheng, Peng, Stone, Huppert and Ramon2018).)
The simple elasticity law can represent any linearly elastic foundation in which there is no interaction between the different channels. Values for
 $\unicode[STIX]{x1D702}^{\ast }\neq 1$
represent the medium becoming more (
 $\unicode[STIX]{x1D702}^{\ast }>1$
) or less (
 $\unicode[STIX]{x1D702}^{\ast }<1$
) rigid as the network branches. Various foundations can be emulated by choosing a suitable
 $\unicode[STIX]{x1D702}^{\ast }$
, including a Winkler foundation (in which case the elastic modulus is the foundation modulus) or a spring array (in which case the elastic modulus is the product of the spring stiffness and the spring density). The factor
 $\unicode[STIX]{x1D702}^{\ast }$
captures variations in the effective elasticity along the flow path, which include spatial variations in the elasticity of the foundation but also any simple dependence of the elastic behaviour on the channel lengths (in which case
 $\unicode[STIX]{x1D702}^{\ast }$
would include a dependence on
 $\unicode[STIX]{x1D719}^{\ast }$
, the length factor) or on the number of channels in the generation due to interaction between them (in which case
 $\unicode[STIX]{x1D702}^{\ast }$
would include a dependence on
 $\unicode[STIX]{x1D6FC}^{\ast }$
, the dimensional branching factor). Similarly, the branching factor
 $\unicode[STIX]{x1D6FC}^{\ast }$
captures the change in the number of channels due to branching, and can also be modified to include the effects of the channel widths (in the third dimension) varying between generations. (This is possible since the model neglects the effects of the junctions on the flow, which results in
 $\unicode[STIX]{x1D6FC}^{\ast }$
only appearing in the governing equations below as a flux multiplier in (2.3d
).) Hence, although the basic bifurcating set-up in figure 1 implies that
 $\unicode[STIX]{x1D6FC}^{\ast }$
is an integer and equal to or greater than 2, in fact other positive values of
 $\unicode[STIX]{x1D6FC}^{\ast }$
are also realistic, and in general we consider any positive values of
 $\unicode[STIX]{x1D719}^{\ast }$
,
 $\unicode[STIX]{x1D6FC}^{\ast }$
and
 $\unicode[STIX]{x1D702}^{\ast }$
.
2.1 Governing equations
The problem formulation remains similar to that in Dana et al. (Reference Dana, Zheng, Peng, Stone, Huppert and Ramon2018), adjusted by the appropriate parameters. Hence, we give only a brief description of the model here. We define the position variable
 $x^{\ast }$
to be the distance from the outlet measured along the flow path (see figure 1), and denote the locations of the junctions by
 $$\begin{eqnarray}x_{0}^{\ast }=0,\quad x_{i+1}^{\ast }=x_{i}^{\ast }+L{\unicode[STIX]{x1D719}^{\ast }}^{i}.\end{eqnarray}$$
For simplicity, the parallel plates bounding each channel are considered to be rigid and impermeable and therefore the aperture,
 $h_{i}^{\ast }(t)$
, is solely a function of time. The governing equations for each fracture are then given by the lubrication equation
 $$\begin{eqnarray}\displaystyle \frac{12\unicode[STIX]{x1D707}}{h_{i}^{\ast }(t^{\ast })^{3}}\frac{\text{d}h_{i}^{\ast }(t^{\ast })}{\text{d}t^{\ast }}=\frac{\unicode[STIX]{x2202}^{2}p_{i}^{\ast }(x^{\ast },t^{\ast })}{\unicode[STIX]{x2202}{x^{\ast }}^{2}}\quad (i=0,1,\ldots ,n-1) & & \displaystyle\end{eqnarray}$$
and the force balance
 $$\begin{eqnarray}\displaystyle \int _{x_{i}^{\ast }}^{x_{i+1}^{\ast }}p_{i}^{\ast }(x^{\ast },t^{\ast })\,\text{d}x^{\ast }=\hat{E}{\unicode[STIX]{x1D702}^{\ast }}^{i}L{\unicode[STIX]{x1D719}^{\ast }}^{i}h_{i}^{\ast }(t^{\ast })\quad (i=0,1,\ldots ,n-1). & & \displaystyle\end{eqnarray}$$
The problem now consists of
 $2n$
equations with
 $2n$
unknowns,
 $h_{i}^{\ast }$
and
 $p_{i}^{\ast }$
. Since each lubrication equation requires an initial condition and two boundary conditions, we require a total of
 $n$
initial conditions and
 $2n$
boundary conditions in order to complete the problem statement. These are given by
 $$\begin{eqnarray}\displaystyle h_{i}^{\ast }(0) & = & \displaystyle \frac{p^{\ast }}{\hat{E}{\unicode[STIX]{x1D702}^{\ast }}^{i}}\quad (i=0,1,\ldots ,n-1),\end{eqnarray}$$
 $$\begin{eqnarray}\displaystyle p_{0}^{\ast }(0,t^{\ast }) & = & \displaystyle 0,\end{eqnarray}$$
 $$\begin{eqnarray}\displaystyle p_{i}^{\ast }(x_{i+1}^{\ast },t^{\ast }) & = & \displaystyle p_{i+1}^{\ast }(x_{i+1}^{\ast },t^{\ast })\quad (i=0,1,\ldots ,n-2),\end{eqnarray}$$
 $$\begin{eqnarray}\displaystyle {\unicode[STIX]{x1D6FC}^{\ast }}^{i}{h_{i}^{\ast }}^{3}\left.\frac{\unicode[STIX]{x2202}p_{i}^{\ast }}{\unicode[STIX]{x2202}x^{\ast }}\right|_{(x_{i+1}^{\ast },t^{\ast })} & = & \displaystyle {\unicode[STIX]{x1D6FC}^{\ast }}^{i+1}h_{i+1}^{\ast 3}\left.\frac{\unicode[STIX]{x2202}p_{i+1}^{\ast }}{\unicode[STIX]{x2202}x^{\ast }}\right|_{(x_{i+1}^{\ast },t^{\ast })}\quad (i=0,1,\ldots ,n-2),\qquad\end{eqnarray}$$
 $$\begin{eqnarray}\displaystyle \left.\frac{\unicode[STIX]{x2202}p_{n-1}^{\ast }}{\unicode[STIX]{x2202}x^{\ast }}\right|_{(x_{n}^{\ast },t^{\ast })} & = & \displaystyle 0.\end{eqnarray}$$
 $p^{\ast }$
, while (2.3c
) and (2.3d
) represent, respectively, continuity of pressure and fluid flux at each node. Finally, (2.3e
) corresponds to no flux at the tip end.
2.2 Non-dimensionalisation
Defining a stretched local coordinate
 $x$
by
 $$\begin{eqnarray}x=(x^{\ast }-x_{i})/(L{\unicode[STIX]{x1D719}^{\ast }}^{i})\quad (0\leqslant x\leqslant 1),\end{eqnarray}$$
we non-dimensionalise the system using
 $$\begin{eqnarray}h_{i}=h_{i}^{\ast }\left/\left(\frac{p^{\ast }{\unicode[STIX]{x1D719}^{\ast }}^{i}}{\hat{E}}\right)\right.,\quad p_{i}=p_{i}^{\ast }/p^{\ast }\quad \text{and}\quad t=t^{\ast }\left/\left(\frac{12\unicode[STIX]{x1D707}\hat{E}^{2}L^{2}}{{p^{\ast }}^{3}}\right)\right.,\end{eqnarray}$$
as well as length-compensated elasticity and branching factors,
 $$\begin{eqnarray}\unicode[STIX]{x1D702}=\unicode[STIX]{x1D702}^{\ast }\unicode[STIX]{x1D719}^{\ast },\quad \unicode[STIX]{x1D6FC}=\unicode[STIX]{x1D6FC}^{\ast }{\unicode[STIX]{x1D719}^{\ast }}^{2}.\end{eqnarray}$$
The resulting dimensionless equations are then
 $$\begin{eqnarray}\frac{1}{h_{i}^{3}(t)}\frac{\text{d}h_{i}(t)}{\text{d}t}=\frac{\unicode[STIX]{x2202}^{2}p_{i}(x,t)}{\unicode[STIX]{x2202}x^{2}},\quad \int _{0}^{1}p_{i}(x,t)\,\text{d}x=\unicode[STIX]{x1D702}^{i}h_{i}(t)\quad (i=0,1,\ldots ,n-1),\end{eqnarray}$$
with dimensionless initial and boundary conditions:
 $$\begin{eqnarray}\displaystyle h_{i}(0) & = & \displaystyle \unicode[STIX]{x1D702}^{-i}\quad (i=0,1,\ldots ,n-1),\end{eqnarray}$$
 $$\begin{eqnarray}\displaystyle p_{0}(0,t) & = & \displaystyle 0,\end{eqnarray}$$
 $$\begin{eqnarray}\displaystyle p_{i}(1,t) & = & \displaystyle p_{i+1}(0,t)\quad (i=0,1,\ldots ,n-2),\end{eqnarray}$$
 $$\begin{eqnarray}\displaystyle \unicode[STIX]{x1D6FC}^{i}h_{i}^{3}\left.\frac{\unicode[STIX]{x2202}p_{i}}{\unicode[STIX]{x2202}x}\right|_{(1,t)} & = & \displaystyle \unicode[STIX]{x1D6FC}^{i+1}h_{i+1}^{3}\left.\frac{\unicode[STIX]{x2202}p_{i+1}}{\unicode[STIX]{x2202}x}\right|_{(0,t)}\quad (i=0,1,\ldots ,n-2),\end{eqnarray}$$
 $$\begin{eqnarray}\displaystyle \left.\frac{\unicode[STIX]{x2202}p_{n-1}}{\unicode[STIX]{x2202}x}\right|_{(1,t)} & = & \displaystyle 0.\end{eqnarray}$$
 $i$
when it is clear from the context.
2.2.1 Non-dimensional structure interpretation
An important property of the non-dimensionalisation (2.4)–(2.6) is that it effectively eliminates the length factor
 $\unicode[STIX]{x1D719}^{\ast }$
from the governing equations, resulting in governing equations (2.7) and (2.8) that essentially describe a network with
 $(\unicode[STIX]{x1D719}^{\ast },\unicode[STIX]{x1D6FC}^{\ast },\unicode[STIX]{x1D702}^{\ast })=(1,\unicode[STIX]{x1D6FC},\unicode[STIX]{x1D702})$
. Physically, this shows that, in our model, a network with spatially varying channel lengths (
 $\unicode[STIX]{x1D719}^{\ast }\neq 1$
) is dynamically equivalent to a network with spatially uniform channel lengths (
 $\unicode[STIX]{x1D719}^{\ast }=1$
), albeit with modified branching and elasticity factors.
We illustrate this equivalence for the non-dimensional parameter set
 $(\unicode[STIX]{x1D6FC},\unicode[STIX]{x1D702})=(2,1/2)$
, which we will study in more detail in § 3. This set corresponds, for example, to a network with spatially uniform channel length, each channel splitting into two, and effective elasticity decreasing by a factor of 2 for each generation, i.e.
 $(\unicode[STIX]{x1D719}^{\ast },\unicode[STIX]{x1D6FC}^{\ast },\unicode[STIX]{x1D702}^{\ast })=(1,2,1/2)$
. It also corresponds to a network with, for example,
 $(\unicode[STIX]{x1D719}^{\ast },\unicode[STIX]{x1D6FC}^{\ast },\unicode[STIX]{x1D702}^{\ast })=(1/2,8,1)$
, i.e. with decreasing channel lengths, more extreme branching and uniform elasticity. Another possibility is
 $(\unicode[STIX]{x1D719}^{\ast },\unicode[STIX]{x1D6FC}^{\ast },\unicode[STIX]{x1D702}^{\ast })=(2,1/2,1/4)$
, where the channel length increases (
 $\unicode[STIX]{x1D719}^{\ast }>1$
) and elasticity decreases (
 $\unicode[STIX]{x1D702}^{\ast }<1$
), and
 $\unicode[STIX]{x1D6FC}^{\ast }<1$
is due to the channel width decreasing faster than the network branches.
Throughout the paper we choose, without loss of generality, to discuss the system using
 $\unicode[STIX]{x1D719}^{\ast }=1$
, meaning that all the channels in the system are of the same length,
 $\unicode[STIX]{x1D6FC}=\unicode[STIX]{x1D6FC}^{\ast }$
and
 $\unicode[STIX]{x1D702}=\unicode[STIX]{x1D702}^{\ast }$
.
2.3 Reduction to a system of ordinary differential equations
Since we assume that the apertures,
 $h_{i}(t)$
, have no spatial dependence, we can transform the current form of the governing equations into a ‘discretised’ system of ordinary differential equations (ODEs). We stress that this discretisation is an exact reduction of the model problem and not an approximation of a continuous system.
The pressure field
 $p_{i}(x,t)$
is expressed using the time-dependent values at the endpoints of the
 $i$
th channel (
 $0\leqslant x\leqslant 1$
), defined by
 $$\begin{eqnarray}\hat{p}_{i}=p_{i}(0,t)\quad \text{and}\quad \hat{p}_{i+1}=p_{i}(1,t),\end{eqnarray}$$
and the respective time-dependent fluxes by
 $$\begin{eqnarray}\hat{q}_{i}=\left.\unicode[STIX]{x1D6FC}^{i}h_{i}^{3}\frac{\unicode[STIX]{x2202}p_{i}}{\unicode[STIX]{x2202}x}\right|_{(0,t)}\quad \text{and}\quad \hat{q}_{i+1}=\left.\unicode[STIX]{x1D6FC}^{i}h_{i}^{3}\frac{\unicode[STIX]{x2202}p_{i}}{\unicode[STIX]{x2202}x}\right|_{(1,t)}.\end{eqnarray}$$
The continuity conditions on pressure (2.8c ) and flux (2.8d ) make these definitions consistent between generations.
Integrating the lubrication equation (2.7) in
 $x$
subject to (2.9), we find that the pressure fields within each generation are given by
 $$\begin{eqnarray}p_{i}=\hat{p}_{i}(1-x)+\hat{p}_{i+1}x-\frac{{\dot{h}}_{i}}{h_{i}^{3}}\frac{x(1-x)}{2},\end{eqnarray}$$
where the dot operator signifies the time derivative. Substituting the pressure field (2.11) into the force balance (2.7b ), we obtain
 $$\begin{eqnarray}\frac{\hat{p}_{i}+\hat{p}_{i+1}}{2}-\frac{{\dot{h}}_{i}}{12h_{i}^{3}}=\unicode[STIX]{x1D702}^{i}h_{i},\end{eqnarray}$$
where on the left-hand side the average pressure has been simplified to two terms. The first term, which is the average of the endpoint pressures, is due to the first two, linear, terms in the pressure field (2.11). The second term in (2.12a ) is due to the last, nonlinear, term in the pressure field (2.11), which is the squeezing effect, i.e. the contribution of the relaxing elastic matrix to the pressure due to the squeezing of the fluid. Substituting (2.11) into (2.10), we derive the full discretised system of ODEs
 $$\begin{eqnarray}\displaystyle \hat{q}_{i+1}-\hat{q}_{i} & = & \displaystyle \unicode[STIX]{x1D6FC}^{i}{\dot{h}}_{i},\end{eqnarray}$$
 $$\begin{eqnarray}\displaystyle \frac{\hat{q}_{i+1}+\hat{q}_{i}}{2} & = & \displaystyle \unicode[STIX]{x1D6FC}^{i}h_{i}^{3}(\hat{p}_{i+1}-\hat{p}_{i}),\end{eqnarray}$$
with initial and boundary conditions
 $$\begin{eqnarray}h_{i}(0)=\unicode[STIX]{x1D702}^{-i},\quad \hat{p}_{0}=0\quad \text{and}\quad \hat{q}_{n}=0.\end{eqnarray}$$
Equation (2.12b
) states that the rate of change of the local volume,
 $\unicode[STIX]{x1D6FC}^{i}h_{i}$
, in the
 $i$
th generation and the difference between the inward and outward fluxes must balance and that the local outlet flux is the rate of change of the total upstream volume,
 $$\begin{eqnarray}\hat{q}_{i}=-\mathop{\sum }_{j=i}^{n-1}\unicode[STIX]{x1D6FC}^{j}{\dot{h}}_{j}.\end{eqnarray}$$
Equation (2.12c ) states that the average flux through each channel is proportional to the pressure drop across it.
The system (2.12) is composed of
 $n$
time-dependent unknowns
 $h_{i}$
(
 $0\leqslant i\leqslant n-1$
),
 $2n+2$
time-dependent unknowns
 $\hat{p}_{i},\hat{q}_{i}$
(
 $0\leqslant i\leqslant n$
) and
 $3n$
equations together with two boundary conditions, (2.13b,c
). Since there are time derivatives only for
 $h_{i}$
, only
 $n$
initial conditions are needed. The system can be evolved numerically by solving a tridiagonal matrix equation at every time step (see § A.1). The numerical results are obtained using MATLAB’s subroutine ‘ODE23s’.
2.4 Late-time power-law behaviour
Dana et al. (Reference Dana, Zheng, Peng, Stone, Huppert and Ramon2018) showed that, for a network with uniform properties, the late-time dependence of all the network segments is
 $t^{-1/3}$
. We state that the same late-time scaling applies here and therefore we eliminate time dependence from our equations in order to study the late-time asymptotic behaviour. New similarity variables,
 $P_{i}(X)$
and
 $H_{i}$
, are defined by
 $$\begin{eqnarray}p_{i}(x,t)=t^{-1/3}P_{i}(X),\quad h_{i}(t)=t^{-1/3}H_{i},\end{eqnarray}$$
and a set of discrete similarity variables,
 $\hat{P}_{i}$
and
 $\hat{Q}_{i}$
, by
 $$\begin{eqnarray}\hat{p}_{i}(t)=t^{-1/3}\hat{P}_{i},\quad \hat{q}_{i}(t)=t^{-4/3}\hat{Q}_{i},\end{eqnarray}$$
where the hat indicates the value of the continuous function of the
 $i$
th generation at the point
 $x=0$
(
 $H_{i}$
does not depend on
 $x$
even though it is not decorated with a hat).
The resulting similarity form of the governing equations (2.12) is then
 $$\begin{eqnarray}\displaystyle \hat{Q}_{i+1}-\hat{Q}_{i} & = & \displaystyle -\unicode[STIX]{x1D6FC}^{i}\frac{H_{i}}{3},\end{eqnarray}$$
 $$\begin{eqnarray}\displaystyle \frac{\hat{Q}_{i+1}+\hat{Q}_{i}}{2} & = & \displaystyle \unicode[STIX]{x1D6FC}^{i}H_{i}^{3}(\hat{P}_{i+1}-\hat{P}_{i}),\end{eqnarray}$$
 $$\begin{eqnarray}\displaystyle \frac{\hat{P}_{i}+\hat{P}_{i+1}}{2}+\frac{1}{36H_{i}^{2}} & = & \displaystyle \unicode[STIX]{x1D702}^{i}H_{i},\end{eqnarray}$$
 $$\begin{eqnarray}\hat{P}_{0}=0,\quad \hat{Q}_{n}=0.\end{eqnarray}$$
The total fluid volume in each generation
 $i$
is defined by
 $$\begin{eqnarray}V_{i}=\unicode[STIX]{x1D6FC}^{i}H_{i},\end{eqnarray}$$
and the outlet flux from the
 $i$
th channel,
 $\hat{Q}_{i}$
, can be related to the sum of the upstream volumes by
 $$\begin{eqnarray}\hat{Q}_{i}=\frac{1}{3}\mathop{\sum }_{j=i}^{n-1}V_{j},\end{eqnarray}$$
where the factor
 $-1/3$
compared with (2.14) comes from differentiating the total upstream volume of the system with respect to time. Similarly, we can relate the pressure in the downstream point (outlet) of the
 $i$
th channel to the sum of the downstream pressure drops,
 $$\begin{eqnarray}\hat{P}_{i}=\mathop{\sum }_{j=0}^{i-1}\unicode[STIX]{x0394}P_{j},\end{eqnarray}$$
where the pressure drop is defined by
 $\unicode[STIX]{x0394}P_{i}=\hat{P}_{i+1}-\hat{P}_{i}$
.
3 Numerical results
Numerical solutions for
 $n=6$
with
 $\unicode[STIX]{x1D6FC}=2$
and
 $\unicode[STIX]{x1D702}=1/2$
(i.e. a bifurcating system with decreasing elasticity). (a) Time evolution of the fracture apertures,
 $h_{i}(t)$
, in both physical non-dimensional space (dashed lines) and multiplied by
 $t^{1/3}$
so that the results (solid lines) tend to the constants
 $H_{i}$
according to (2.15b
). (b) Late-time distributions of pressure (solid line), flux (dotted line) and volume (dashed line, equation (2.18)) in the continuous variable
 $X=x+i$
. The time-scaled distributions along the network are normalised by the maximum calculated values.

In this section, we investigate an example system by solving (2.12) and (2.13) in order to introduce the general method of analysis (see § A.1 for the computational details). We choose the values
 $\unicode[STIX]{x1D702}=1/2$
and
 $\unicode[STIX]{x1D6FC}=2$
and note that this case is qualitatively similar to the one presented by Dana et al. (Reference Dana, Zheng, Peng, Stone, Huppert and Ramon2018), where instead
 $\unicode[STIX]{x1D702}=1$
. As previously mentioned in § 2.2.1, we discuss this example using
 $\unicode[STIX]{x1D719}^{\ast }=1$
, meaning
 $\unicode[STIX]{x1D6FC}^{\ast }=2$
and
 $\unicode[STIX]{x1D702}^{\ast }=1/2$
. The resulting system is a bifurcating network with a decreasing elastic modulus towards the upstream direction (i.e. a ‘soft tip’ system).
The time evolution of the apertures for the case
 $n=6$
is presented in figure 2(a). At early times, the solution is significantly influenced by the initial condition (2.8a
), while at late times the solution (dashed lines) tends to a
 $t^{-1/3}$
power law. When multiplied by
 $t^{1/3}$
, we see that the solution tends to the constants
 $H_{i}$
(solid lines) according to (2.15b
). The root channel has the smallest aperture, which, according to the elastic equation (2.7b
), is a direct result of the pressure being the smallest at the root together with the root channel having the largest elastic modulus. Furthermore, it is evident that the transition to the late-time behaviour essentially occurs simultaneously in all generations.
The late-time pressure, volume and flux distributions in the network for
 $n=6$
are presented in figure 2(b). The chosen parameter values yield a somewhat extreme limit, where the pressure gradient is almost entirely concentrated in the root channel and the volume contained in the tip generation is much larger than the downstream volumes. The bifurcation (
 $\unicode[STIX]{x1D6FC}>1$
) causes the majority of the network’s volume to be localised near the tip. This is enhanced by the fact that the softer tip (
 $\unicode[STIX]{x1D702}<1$
) allows the upstream channels to hold more fluid than the downstream ones. Since the volume changes generate the flux (2.19) and the volume is mostly localised at the tip, the flux throughout the rest of the network is approximately constant as shown by the dotted line in figure 2(b). The pressure is approximately constant through much of the network since the pressure drop is concentrated in the root channel.
3.1 Results of limiting behaviours
We now present several numerical results, each based on a specific set of values (
 $\unicode[STIX]{x1D6FC},\unicode[STIX]{x1D702}$
) that correspond to different limiting behaviours, where both the pressure drop and the volume are nearly completely contained within a single generation (root or tip) at the edge of the network. As we explain in more detail in § 4, we define the error estimates
 $\unicode[STIX]{x1D700}_{p}$
and
 $\unicode[STIX]{x1D700}_{v}$
for the ratio between the value of the feature (pressure drop or volume, respectively) in the edge (root or tip) generation and its neighbour. Thus, when
 $\unicode[STIX]{x1D700}_{p}\ll 1$
and
 $\unicode[STIX]{x1D700}_{v}\ll 1$
, both the pressure drop and volume are contained in the appropriate edge generations.
The pressure and volume distributions in the continuous spatial variable
 $X$
for
 $n=10$
and several combinations of
 $\unicode[STIX]{x1D6FC}$
(the branching factor) and
 $\unicode[STIX]{x1D702}$
(the elasticity factor) are shown in figure 3. Each of the four plots represents a different localisation set of the features (volume and pressure drop) to either edge (root or tip) of the network. The reasoning behind the choice of parameter values
 $\unicode[STIX]{x1D6FC}$
and
 $\unicode[STIX]{x1D702}$
, based on the ‘error estimates’
 $\unicode[STIX]{x1D700}_{p}$
and
 $\unicode[STIX]{x1D700}_{v}$
from each regime, will be made clear in § 4. Figure 4 shows analogous results using different sets of parameters (
 $\unicode[STIX]{x1D6FC}$
,
 $\unicode[STIX]{x1D702}$
). Here, although the bulk of the volume and pressure drop are still localised near the respective network edges, they are spread out along multiple channels.
4 Late-time asymptotic regimes
Late-time numerical results (thick lines) of pressure and volume distributions for
 $n=10$
and
 $(\unicode[STIX]{x1D6FC},\unicode[STIX]{x1D702})$
chosen to yield
 $\unicode[STIX]{x1D700}_{v}=\unicode[STIX]{x1D700}_{p}=\unicode[STIX]{x1D700}=0.1$
(see § 4). The results are normalised by their maximum values
 $\hat{p}_{n}$
and
 $V_{max}$
. Results are for: (a)
 $\unicode[STIX]{x1D6FC}=\unicode[STIX]{x1D700}^{1/2}$
,
 $\unicode[STIX]{x1D702}=\unicode[STIX]{x1D700}^{-3/2}$
,
 $\hat{p}_{n}=7.23\times 10^{8}$
,
 $V_{max}=0.51$
; (b)
 $\unicode[STIX]{x1D6FC}=\unicode[STIX]{x1D700}^{-2}$
,
 $\unicode[STIX]{x1D702}=\unicode[STIX]{x1D700}^{-2}$
,
 $\hat{p}_{n}=7.25\times 10^{11}$
,
 $V_{max}=5.13\times 10^{11}$
; (c)
 $\unicode[STIX]{x1D6FC}=\unicode[STIX]{x1D700}^{3/2}$
,
 $\unicode[STIX]{x1D702}=\unicode[STIX]{x1D700}^{1/2}$
,
 $\hat{p}_{n}=0.87$
,
 $V_{max}=0.52$
; and (d)
 $\unicode[STIX]{x1D6FC}=\unicode[STIX]{x1D700}^{-1},\unicode[STIX]{x1D702}=1$
,
 $\hat{p}_{n}=1.46\times 10^{3}$
,
 $V_{max}=1.46\times 10^{12}$
. The thinner lines are the asymptotic predictions from § 4, also scaled by the maximum calculated numerical values.

Numerical results of pressure and volume distributions for
 $n=10$
and
 $\unicode[STIX]{x1D700}_{v}=\unicode[STIX]{x1D700}_{p}=\unicode[STIX]{x1D700}=1/2$
(see § 4). The results are normalised by their maximum values
 $\hat{p}_{n}$
and
 $V_{max}$
. Results are for: (a)
 $\unicode[STIX]{x1D6FC}=\unicode[STIX]{x1D700}^{1/2}$
,
 $\unicode[STIX]{x1D702}=\unicode[STIX]{x1D700}^{-3/2}$
,
 $\hat{p}_{n}=4.23\times 10^{2}$
,
 $V_{max}=6.93\times 10^{-1}$
; (b)
 $\unicode[STIX]{x1D6FC}=\unicode[STIX]{x1D700}^{-2}$
,
 $\unicode[STIX]{x1D702}=\unicode[STIX]{x1D700}^{-2}$
,
 $\hat{p}_{n}=3.46\times 10^{3}$
,
 $V_{max}=3.06\times 10^{3}$
; (c)
 $\unicode[STIX]{x1D6FC}=\unicode[STIX]{x1D700}^{3/2}$
,
 $\unicode[STIX]{x1D702}=\unicode[STIX]{x1D700}^{1/2}$
,
 $\hat{p}_{n}=1.65$
,
 $V_{max}=7.65\times 10^{-1}$
; and (d)
 $\unicode[STIX]{x1D6FC}=\unicode[STIX]{x1D700}^{-1},\unicode[STIX]{x1D702}=1$
,
 $\hat{p}_{n}=1.6\times 10^{1}$
,
 $V_{max}=8.17\times 10^{3}$
. The thinner curves show the self-similar interior solution (A 6), from § A.2.2, in (a); a numerical solution for a network of half the size (
 $n=5$
), as discussed in § A.2.3, in (b,c); and the asymptotic result (4.9), derived in § A.2.1, in (d).

In § 3.1, four main asymptotic cases were introduced, dependent on whether the dominant volume (whose change generates the flux) and pressure drop are located at the root (
 $i=0$
) or at the tip (
 $i=n-1$
), as illustrated in figure 3. In this section, we present asymptotic solutions for the four cases and some of their extensions. Examining the behaviour in the various limits allows a better understanding of the system. In each case, we will identify two parameters, (
 $\unicode[STIX]{x1D700}_{v},\unicode[STIX]{x1D716}_{p}$
), depending on
 $(\unicode[STIX]{x1D6FC},\unicode[STIX]{x1D702})$
, that must be smaller than unity in order for the volume and pressure drop, respectively, to be located at the appropriate end.
4.1 Volume at the tip
4.1.1 Volume at the tip and pressure drop at the root (‘
 $V$
: tip,
$\unicode[STIX]{x0394}P$
: root’)


We first analyse the case where the volume is localised at the tip and the pressure drop at the root, which includes the examples plotted in figures 2 and 3(d). Based on the observed profiles of the similarity forms
 $P$
and
 $V$
along the network, we assume that the pressure is uniform across all the channels except the root (
 $P_{i}\approx P$
, for
 $i\geqslant 1$
) and that almost all of the volume in the system is contained in the tip channel (i.e.
 $V\approx V_{n-1}$
), so that the flux
 $Q$
is constant along the network except in the tip channel (i.e.
 $Q_{i}\approx Q$
, for
 $i\leqslant n-2$
). When solving the governing equations (2.16a,b
) for
 $H_{n-1}$
subject to the boundary condition (2.17b
), we find that
 $$\begin{eqnarray}H_{n-1}^{-2}\sim \hat{P}_{n}-\hat{P}_{n-1}\ll P,\end{eqnarray}$$
since we assume the pressure at both nodes of the tip channel can be approximated as
 $P$
. We note that, since the pressure is approximately uniform in space, the pressure distribution in a single channel is approximately linear, and the nonlinear term in the force balance (2.16c
) can be neglected. This approximation means that, when the pressure changes little across a channel, then the squeezing effect can be neglected. Then, solving (2.16c
) with (4.1) for
 $H_{n-1}$
we obtain
 $$\begin{eqnarray}H_{n-1}=\frac{1}{\unicode[STIX]{x1D702}^{n-1}}P.\end{eqnarray}$$
From (2.19), the flux may now be expressed as
 $$\begin{eqnarray}Q\approx \frac{1}{3}V_{n-1}=\frac{1}{3}\left(\frac{\unicode[STIX]{x1D6FC}}{\unicode[STIX]{x1D702}}\right)^{n-1}P.\end{eqnarray}$$
Subject to the assumptions that
 $P_{1}\approx P$
and
 $Q_{0}\approx Q_{1}\approx Q$
, the governing equations, (2.16b,c
), for the root channel become
 $$\begin{eqnarray}Q=H_{0}^{3}P,\quad \frac{P}{2}=H_{0},\end{eqnarray}$$
which yield
 $$\begin{eqnarray}H_{0}=(Q/2)^{1/4},\quad P=(8Q)^{1/4}.\end{eqnarray}$$
Combining with the flux expression (4.3), we obtain
 $$\begin{eqnarray}P=\frac{2}{3^{1/3}}\left(\frac{\unicode[STIX]{x1D6FC}}{\unicode[STIX]{x1D702}}\right)^{(n-1)/3},\quad Q=\frac{2}{3^{4/3}}\left(\frac{\unicode[STIX]{x1D6FC}}{\unicode[STIX]{x1D702}}\right)^{(4/3)(n-1)}.\end{eqnarray}$$
The leading-order (i.e. assuming uniform pressure) apertures and pressure profiles are thus
 $$\begin{eqnarray}H_{0}=P/2,\quad P_{0}(x)=Px,\end{eqnarray}$$
 $$\begin{eqnarray}H_{i}=P/\unicode[STIX]{x1D702}^{i},\quad P_{i}(x)=P,\quad \text{for }i\geqslant 1,\end{eqnarray}$$
which are plotted using thinner curves in figure 3(d).
We now calculate an asymptotic error estimate for the localisation of the different features. By considering the volume and pressure drop to be contained in the tip and root, respectively, we have neglected all other pressure drops and volumes in the network. Expressing the volume in each generation as
 $V_{i}\sim (\unicode[STIX]{x1D6FC}/\unicode[STIX]{x1D702})^{i}P$
, we can estimate the relative error due to neglecting the volume in generation
 $i=n-2$
(and below) as
 $\unicode[STIX]{x1D700}_{v}\sim V_{n-2}/V_{n-1}\sim \unicode[STIX]{x1D702}/\unicode[STIX]{x1D6FC}$
. Similarly, for the pressure drop, generally expressed by
 $\unicode[STIX]{x0394}\hat{P}_{i}\sim Q/(\unicode[STIX]{x1D6FC}^{i}H_{i}^{3})$
, we obtain near the root that
 $\unicode[STIX]{x1D700}_{p}\sim \unicode[STIX]{x0394}P_{1}/\unicode[STIX]{x0394}P_{0}\sim \unicode[STIX]{x1D702}^{3}/\unicode[STIX]{x1D6FC}$
. The result (4.6) can thus be expected to hold when
 $$\begin{eqnarray}\unicode[STIX]{x1D700}_{v}=\frac{\unicode[STIX]{x1D702}}{\unicode[STIX]{x1D6FC}}\ll 1,\quad \unicode[STIX]{x1D700}_{p}=\frac{\unicode[STIX]{x1D702}^{3}}{\unicode[STIX]{x1D6FC}}\ll 1.\end{eqnarray}$$
When exploring other cases we will obtain analogous, but different, expressions for the errors (
 $\unicode[STIX]{x1D700}_{v},\unicode[STIX]{x1D700}_{p}$
) in each regime.
The change in volume or pressure distribution with the respective error estimates
 $\unicode[STIX]{x1D700}_{v}$
or
 $\unicode[STIX]{x1D700}_{p}$
is presented in figure 5 for
 $n=5$
. As can be seen from (4.8), each pair of values
 $(\unicode[STIX]{x1D700}_{v},\unicode[STIX]{x1D700}_{p})$
corresponds to one set of parameter values, i.e. for the present case
 $(\unicode[STIX]{x1D6FC},\unicode[STIX]{x1D702})=(\unicode[STIX]{x1D700}_{v}^{-3/2}\unicode[STIX]{x1D700}_{p}^{1/2},\unicode[STIX]{x1D700}_{v}^{-1/2}\unicode[STIX]{x1D700}_{p}^{1/2})$
. Figure 5(a) shows the volume distribution as
 $\unicode[STIX]{x1D700}_{v}$
is increased from 0.1 to 10 while
 $\unicode[STIX]{x1D700}_{p}=0.1$
is held fixed. We observe that, as
 $\unicode[STIX]{x1D700}_{v}\rightarrow 1^{-}$
, the volume that was initially contained in the tip is redistributed more evenly along the network. As
 $\unicode[STIX]{x1D700}_{v}$
becomes greater than unity, the volume shifts further towards the root end of the network, until the fluid volume is nearly completely contained (by an order of magnitude) in the root channel. Similarly, figure 5(b) shows the pressure distribution as
 $\unicode[STIX]{x1D700}_{p}$
is increased from 0.1 to 10 while
 $\unicode[STIX]{x1D700}_{v}=0.1$
is held fixed. When
 $\unicode[STIX]{x1D700}_{p}\ll 1$
, the shape of the pressure profile is of a boundary layer near the root end. As
 $\unicode[STIX]{x1D700}_{p}\rightarrow 1^{-}$
, the pressure distribution ‘smears’ over the network, and when
 $\unicode[STIX]{x1D700}_{p}>1$
, the majority of the pressure drop is located near the tip region.
The arrows in figure 5(c,d) show the path taken by the parameter values
 $(\unicode[STIX]{x1D6FC},\unicode[STIX]{x1D702})$
(in logarithmic parameter space) corresponding to the five calculations in each upper plot, figure 5(a) and 5(b), respectively. Each arrow points in the same direction as the corresponding arrow in the respective upper plot (i.e. the direction in which the error is increased). The solid lines are the boundaries where the errors equal unity, i.e.
 $\unicode[STIX]{x1D700}_{v}=\unicode[STIX]{x1D700}_{p}=1$
, for each regime and will be discussed more in § 4.3. The transition through the regime boundaries is in agreement with the intuition that, when the criterion in (4.8) is not fulfilled, the localisation of the appropriate feature is at the opposite end.
In § A.2.1, we present a calculation that considers the volume in multiple channels near the tip of the network and the pressure drop across multiple channels near the root of the network, and hence is expected to hold even for moderate values of
 $\unicode[STIX]{x1D700}_{v}<1$
and
 $\unicode[STIX]{x1D700}_{p}<1$
. The result is
 $$\begin{eqnarray}P\approx \left[\frac{4}{3}\frac{\unicode[STIX]{x1D700}_{v}^{1-n}}{1-\unicode[STIX]{x1D700}_{v}}\left(\frac{2-\unicode[STIX]{x1D700}_{p}}{1-\unicode[STIX]{x1D700}_{p}}\right)\right]^{1/3},\quad Q\approx \left[\frac{4}{81}\left(\frac{\unicode[STIX]{x1D700}_{v}^{1-n}}{1-\unicode[STIX]{x1D700}_{v}}\right)^{4}\left(\frac{2-\unicode[STIX]{x1D700}_{p}}{1-\unicode[STIX]{x1D700}_{p}}\right)\right]^{1/3},\end{eqnarray}$$
which reduces to the simpler result (4.6) in the limit
 $\unicode[STIX]{x1D700}_{v}\ll 1$
and
 $\unicode[STIX]{x1D700}_{p}\ll 1$
.
The case
 $\unicode[STIX]{x1D6FC}=2$
and
 $\unicode[STIX]{x1D702}=1$
(i.e.
 $\unicode[STIX]{x1D700}_{v}=\unicode[STIX]{x1D700}_{p}=1/2$
) was studied by Dana et al. (Reference Dana, Zheng, Peng, Stone, Huppert and Ramon2018), who presented an asymptotic analysis that allows for moderate values of
 $\unicode[STIX]{x1D700}_{v}$
(analogous to (A 3)) but requires
 $\unicode[STIX]{x1D700}_{p}\ll 1$
(analogous to (4.5)) to yield
 $P=c\times 2^{n}$
, where
 $c=2/3^{1/3}\approx 1.3867$
. They also solved numerically the asymptotic equation for moderate values of
 $\unicode[STIX]{x1D700}_{p}$
(analogous to (A 4)) to find
 $c\approx 1.5875$
, which was a much better approximation to their full numerical results. They concluded that the calculation that considers the pressure drop from multiple channels constitutes a noticeable improvement over the simpler calculation, which only considers the pressure drop from the root channel. Our formula (4.9a
) yields the excellent approximation
 $c\approx 4^{1/3}\approx 1.5874$
, without the need for a separate numerical calculation for each choice of parameters
 $(\unicode[STIX]{x1D6FC},\unicode[STIX]{x1D702})$
.
4.1.2 Volume and pressure drop at the tip (‘
$V$
: tip,
$\unicode[STIX]{x0394}P$
: tip’)


Changes in the spatial distributions of the volume and pressure drop along the network for
 $n=5$
with the change in the respective error parameter (
 $\unicode[STIX]{x1D700}_{p}$
or
 $\unicode[STIX]{x1D700}_{v}$
) in the range
 $\{10^{-1},10^{-1/2},10^{0},10^{1/2},10^{1}\}$
. The errors are defined using the ‘volume at the tip and pressure drop at the root’ regime, equation (4.8). Results are for (a) fixed
 $\unicode[STIX]{x1D700}_{p}$
and (b) fixed
 $\unicode[STIX]{x1D700}_{v}$
. The arrows in each of the bottom plots, (c,d), are the paths of the corresponding parameter values
 $(\unicode[STIX]{x1D6FC},\unicode[STIX]{x1D702})$
in their respective upper plot, i.e. (a,b). The solid lines are the regime boundaries (i.e.
 $\unicode[STIX]{x1D700}_{v}=\unicode[STIX]{x1D700}_{p}=1$
) as explained in § 4.3.

We continue to investigate the case where the volume is localised near the tip, but now assume that the pressure drop also occurs near the tip as well. Since the dominant pressure drop is located at the tip, i.e.
 $\hat{P}_{n-1}\ll \hat{P}_{n}$
, the governing equations (2.16) for the tip channel
 $(i=n-1)$
simplify to
 $$\begin{eqnarray}\hat{Q}_{n-1}=\frac{1}{3}\unicode[STIX]{x1D6FC}^{n-1}H_{n-1},\quad \frac{\hat{Q}_{n-1}}{2}=\unicode[STIX]{x1D6FC}^{n-1}H_{n-1}^{3}\hat{P}_{n},\quad \frac{\hat{P}_{n}}{2}+\frac{1}{36H_{n-1}^{2}}=\unicode[STIX]{x1D702}^{n-1}H_{n-1},\end{eqnarray}$$
which are of the same form as the equations for a single isolated channel
 $(n=1)$
. The solution is
 $$\begin{eqnarray}H_{n-1}=\frac{1}{3^{2/3}}\unicode[STIX]{x1D702}^{-(1/3)(n-1)},\quad \hat{P}_{n}=\frac{3^{1/3}}{2}\unicode[STIX]{x1D702}^{(2/3)(n-1)},\quad \hat{Q}_{n-1}=\frac{1}{3^{5/3}}\left(\frac{\unicode[STIX]{x1D6FC}^{3}}{\unicode[STIX]{x1D702}}\right)^{(1/3)(n-1)},\end{eqnarray}$$
and the corresponding (continuous) pressure profile is
 $$\begin{eqnarray}P_{n-1}(x)=\frac{3^{1/3}}{2}\unicode[STIX]{x1D702}^{(2/3)(n-1)}x(2-x).\end{eqnarray}$$
The flux through the rest of the network is uniform at leading order since we assume that essentially all of the volume is contained in the tip channel and we denote this flux by
 $Q=\hat{Q}_{0}=\cdots =\hat{Q}_{n-1}$
, equation (4.11c
). In order to solve for the remaining channels (
 $i\leqslant n-2$
), we assume that
 $\hat{P}_{i}\ll \hat{P}_{i+1}$
. The governing equations (2.16) then simplify to
 $$\begin{eqnarray}Q=\unicode[STIX]{x1D6FC}^{i}H_{i}^{3}\hat{P}_{i+1},\quad \frac{\hat{P}_{i+1}}{2}=\unicode[STIX]{x1D702}^{i}H_{i},\end{eqnarray}$$
which yield
 $$\begin{eqnarray}H_{i}=\left(\frac{1}{\unicode[STIX]{x1D702}\unicode[STIX]{x1D6FC}}\right)^{i/4}\left(\frac{Q}{2}\right)^{1/4},\quad \hat{P}_{i+1}=\frac{Q}{\unicode[STIX]{x1D6FC}^{i}H_{i}^{3}},\quad P_{i}(x)=\frac{Q}{\unicode[STIX]{x1D6FC}^{i}H_{i}^{3}}x.\end{eqnarray}$$
Requiring that
 $V_{n-2}\ll V_{n-1}$
and
 $\hat{P}_{n-2}\ll \hat{P}_{n-1}$
, we obtain the error estimates
 $\unicode[STIX]{x1D700}_{v}$
and
 $\unicode[STIX]{x1D700}_{p}$
, and the conditions for our assumptions to hold, as
 $$\begin{eqnarray}\unicode[STIX]{x1D700}_{v}=\left(\frac{\unicode[STIX]{x1D702}}{\unicode[STIX]{x1D6FC}^{3}}\right)^{1/4}\ll 1,\quad \unicode[STIX]{x1D700}_{p}=\left(\frac{\unicode[STIX]{x1D6FC}}{\unicode[STIX]{x1D702}^{3}}\right)^{1/4}\ll 1.\end{eqnarray}$$
These expressions are different from those derived above in (4.8), but the common boundary between the two regimes is given by
 $\unicode[STIX]{x1D700}_{p}=1$
, i.e.
 $\unicode[STIX]{x1D6FC}=\unicode[STIX]{x1D702}^{3}$
, in both cases, as is to be expected. The boundary between the two regimes can also be demonstrated by holding
 $\unicode[STIX]{x1D700}_{v}=0.1$
fixed and letting
 $\unicode[STIX]{x1D700}_{p}$
grow beyond unity. This is shown in figure 5(b) starting from the ‘volume at root, pressure drop at tip’ regime. The pressure drop, previously contained at the root, slowly spreads along the network. Once
 $\unicode[STIX]{x1D700}_{p}>1$
, the pressure drop starts concentrating towards the tip end of the network to achieve the current regime. Figure 5 will be discussed further in § 4.3.
4.2 Volume at the root
When essentially all of the volume is contained in the root channel (
 $i=0$
), there is almost no flux from the remainder of the network (i.e.
 $\hat{Q}_{1}\ll \hat{Q}_{0}$
). Hence, the system behaves like an isolated channel, satisfying
 $$\begin{eqnarray}\hat{Q}_{0}=\frac{1}{3}H_{0},\quad \frac{\hat{Q}_{0}}{2}=H_{0}^{3}\hat{P}_{1},\quad \frac{\hat{P}_{1}}{2}+\frac{1}{36H_{0}^{2}}=H_{0},\end{eqnarray}$$
which yields
 $$\begin{eqnarray}H_{0}=\frac{1}{3^{2/3}},\quad \hat{P}_{1}=\frac{3^{1/3}}{2},\quad P_{0}(x)=\frac{3^{1/3}}{2}x(2-x),\quad \hat{Q}_{0}=\frac{1}{3^{5/3}.}\end{eqnarray}$$
To account for the upstream pressures, we can estimate the
 $i$
th pressure drop,
 $\unicode[STIX]{x0394}\hat{P}_{i}$
, using a scaling argument. Since for each generation
 $i$
, the upstream volume is negligible compared with the local volume (i.e.
 $V_{i+1}\ll V_{i}$
), the flux through the
 $i$
th channel scales as the local volume,
 $\unicode[STIX]{x1D6FC}^{i}H_{i}^{3}\unicode[STIX]{x0394}\hat{P}_{i}\sim \unicode[STIX]{x1D6FC}^{i}H_{i}$
, which yields
 $$\begin{eqnarray}\unicode[STIX]{x0394}\hat{P}_{i}\sim H_{i}^{-2}.\end{eqnarray}$$
4.2.1 Volume and pressure drop at the root (‘
$V$
: root,
$\unicode[STIX]{x0394}P$
: root’)


When both the volume and the pressure drop are localised near the outlet (
 $i=0$
), the pressure in the remainder of the network is again assumed to be approximately uniform at
 $P=\hat{P}_{1}=3^{1/3}/2$
(which is thus also the maximum pressure). Hence, the solution is
 $$\begin{eqnarray}\hat{Q}_{i}=\unicode[STIX]{x1D6FC}^{i}\frac{H_{i}}{3},\quad \hat{P}_{i}=P_{i}(x)=P,\quad H_{i}=\frac{P}{\unicode[STIX]{x1D702}^{i}},\quad 1\leqslant i\leqslant n-1.\end{eqnarray}$$
The resulting local volumes
 $V_{i}=(\unicode[STIX]{x1D6FC}/\unicode[STIX]{x1D702})^{i}P$
and the pressure drops
 $\unicode[STIX]{x0394}\hat{P}_{i}\sim \unicode[STIX]{x1D702}^{2i}P^{-2}$
must decay, so we require
 $$\begin{eqnarray}\unicode[STIX]{x1D700}_{v}=\frac{\unicode[STIX]{x1D6FC}}{\unicode[STIX]{x1D702}}\ll 1,\quad \unicode[STIX]{x1D700}_{p}=\unicode[STIX]{x1D702}^{2}\ll 1\end{eqnarray}$$
for our solution to hold.
4.2.2 Volume at the root and pressure drop at the tip (‘
$V$
: root,
$\unicode[STIX]{x0394}P$
: tip’)


When the pressure drops increase upstream, the local pressure drop is also an estimate for the local pressure. Similar to (4.18), we obtain the balance
 $$\begin{eqnarray}\hat{Q}_{i}=\unicode[STIX]{x1D6FC}^{i}\frac{H_{i}}{3},\quad \hat{P}_{i}\sim \unicode[STIX]{x0394}\hat{P}_{i}\sim H_{i}^{-2}\sim \unicode[STIX]{x1D702}^{i}H_{i},\end{eqnarray}$$
which implies
 $$\begin{eqnarray}\hat{Q}_{i}\approx \frac{1}{3}\left(\frac{\unicode[STIX]{x1D6FC}}{\unicode[STIX]{x1D702}^{1/3}}\right)^{i},\quad H_{i}\approx \unicode[STIX]{x1D702}^{-i/3},\quad \hat{P}_{i}\approx \unicode[STIX]{x1D702}^{2i/3}.\end{eqnarray}$$
The conditions for rapidly decaying volume
 $V_{i}=(\unicode[STIX]{x1D6FC}/\unicode[STIX]{x1D702}^{1/3})^{i}$
and increasing pressure
 $\hat{P}_{i}$
, (4.22c
), then yield
 $$\begin{eqnarray}\unicode[STIX]{x1D700}_{v}=\frac{\unicode[STIX]{x1D6FC}}{\unicode[STIX]{x1D702}^{1/3}}\ll 1,\quad \unicode[STIX]{x1D700}_{p}=\unicode[STIX]{x1D702}^{-2/3}\ll 1.\end{eqnarray}$$
Since the volume decays (
 $\hat{Q}_{i+1}\ll \hat{Q}_{i}$
) and pressure grows rapidly (
 $\hat{P}_{i+1}\gg \hat{P}_{i}$
), each individual section behaves like an isolated channel,
 $$\begin{eqnarray}\hat{Q}_{i}=\frac{1}{3}\unicode[STIX]{x1D6FC}^{i}H_{i},\quad \frac{\hat{Q}_{i}}{2}=\unicode[STIX]{x1D6FC}^{i}H_{i}^{3}\hat{P}_{i+1},\quad \frac{\hat{P}_{i+1}}{2}+\frac{1}{36H_{i}^{2}}=\unicode[STIX]{x1D702}^{i}H_{i},\end{eqnarray}$$
which yields
 $$\begin{eqnarray}\displaystyle H_{i}=\frac{\unicode[STIX]{x1D702}^{-i/3}}{3^{2/3}},\quad \hat{P}_{i+1}=\frac{3^{1/3}}{2}\unicode[STIX]{x1D702}^{2i/3},\quad P_{i}(x)=\frac{3^{1/3}}{2}\unicode[STIX]{x1D702}^{2i/3}x(2-x),\quad \hat{Q}_{i}=\frac{1}{3^{5/3}}\left(\frac{\unicode[STIX]{x1D6FC}}{\unicode[STIX]{x1D702}^{1/3}}\right)^{i}. & & \displaystyle \nonumber\\ \displaystyle & & \displaystyle\end{eqnarray}$$
The maximum pressure is
 $$\begin{eqnarray}\hat{P}_{n}=\frac{3^{1/3}}{2}\unicode[STIX]{x1D702}^{(2/3)(n-1)}.\end{eqnarray}$$
4.3 Summary and the regime plot
We have derived the late-time asymptotic solutions for the flux, aperture and pressure distribution along the network for the four cases, i.e. the bulk of the volume and pressure drop is localised near either the root or tip end. In each case the volume and pressure distributions are assumed to be localised at an edge by neglecting all other volumes and pressure drops along the network. For each of the obtained solutions, estimates for the asymptotic error,
 $\unicode[STIX]{x1D700}_{v}$
and
 $\unicode[STIX]{x1D700}_{p}$
, have been calculated. We can see that asymptotic results for
 $n=10$
plotted along with the numerical results in figure 3 show a good agreement to the order of
 $O(\unicode[STIX]{x1D700}_{v},\unicode[STIX]{x1D700}_{p})$
as expected. This gives us confidence in our derivation and we continue in describing the late-time asymptotic results of the model.
We proceed to look at the error estimates derived in the different regimes. In figure 5(a), we see that, for a fixed
 $\unicode[STIX]{x1D700}_{p}=0.1$
, relaxing
 $\unicode[STIX]{x1D700}_{v}$
towards unity results in the spreading of the volume along the network (towards the root). When
 $\unicode[STIX]{x1D700}_{v}$
becomes much larger than unity, the volume begins collecting near the root channel. The system then approaches the distinct limit where both volume and pressure drop are contained in the root. The arrows in figure 5(c,d) indicate the path of values of the chosen parameter sets in figure 5(a,b) respectively. As seen in figure 5(b), for a fixed
 $\unicode[STIX]{x1D700}_{v}=0.1$
, relaxing
 $\unicode[STIX]{x1D700}_{p}$
towards unity results in a spreading of the pressure drop along the network (towards the tip). When
 $\unicode[STIX]{x1D700}_{p}$
is larger than unity, the pressure drop collects near the tip channel. The system then approaches the distinct limit where both volume and pressure are contained in the tip.
An asymptotic regime diagram plotted on a logarithmic scale of
 $(\unicode[STIX]{x1D6FC},\unicode[STIX]{x1D702})$
space. In each region, bounded by the solid lines
 $\unicode[STIX]{x1D700}_{v}=1$
or
 $\unicode[STIX]{x1D700}_{p}=1$
, the volume and the pressure drop are localised near either the root (
 $i=0$
) or the tip (
 $i=n-1$
). In the unshaded regions, bounded by the dashed lines, i.e.
 $\unicode[STIX]{x1D700}_{v}=0.1$
or
 $\unicode[STIX]{x1D700}_{p}=0.1$
, the volume and pressure drop are approximately localised to a single channel near the root or tip. In the shaded region, one or both are spread out over multiple channels. The round markers are the parameter values for the numerical results presented in figure 3, based on
 $\unicode[STIX]{x1D700}_{v}=\unicode[STIX]{x1D700}_{p}=0.1$
. The triangle is the parameter set used in figure 2.

We now present a schematic regime diagram (figure 6) in logarithmic
 $(\unicode[STIX]{x1D6FC},\unicode[STIX]{x1D702})$
space, showing at which end the volume and pressure drop are concentrated for any given set of values. Typically, moving to the right in the diagram (i.e. increasing
 $\unicode[STIX]{x1D6FC}$
) increases the number of branches at the tip end of the network, which causes the volume to shift towards the tip. Moving up in the diagram (i.e. increasing
 $\unicode[STIX]{x1D702}$
) increases the rigidity near the tip end and hence can be expected to reduce the apertures at the tip end and cause the pressure drop there to increase. The solid lines (corresponding to
 $\unicode[STIX]{x1D700}_{v}=1$
or
 $\unicode[STIX]{x1D700}_{p}=1$
for each of the regimes) are the actual regime boundaries, so that crossing them means the transition of the relevant feature (volume or pressure drop) from being mostly contained near the given end (according to the current regime) towards being mostly contained near the opposite end. For example, the parameter set marked with a triangle in figure 6 (presented in figure 2) are in the ‘volume at tip, pressure drop at root’ regime. The further away from the relevant solid line, the smaller the error value. If we move towards the upper solid line (i.e.
 $\unicode[STIX]{x1D700}_{p}=1$
) then
 $\unicode[STIX]{x1D700}_{p}$
grows. Similarly, approaching the solid line located in the bottom left quadrant (i.e.
 $\unicode[STIX]{x1D700}_{v}=1$
) means
 $\unicode[STIX]{x1D700}_{v}$
grows.
The dashed contours in figure 6 show where the asymptotic error of the results derived in this section is 10 %, i.e.
 $\unicode[STIX]{x1D700}_{v}=0.1$
or
 $\unicode[STIX]{x1D700}_{p}=0.1$
. Outside these lines, in the unshaded regions, we consider the volume and pressure drop to each be truly localised to a single generation of channels, such as for the cases shown in figure 3, which correspond to the four intersections of the dashed lines (round markers in figure 6). Inside these lines, in the shaded region, as shown in figure 4 for
 $\unicode[STIX]{x1D700}_{v}=\unicode[STIX]{x1D700}_{p}=1/2$
, the volume and pressure drop remain localised near the root or tip end of the network, but spread out across multiple generations of channels rather than being contained in a single generation. We investigate this region of parameter space in more detail in appendix A, and show that the main physical principles remain the same.
5 Drainage time
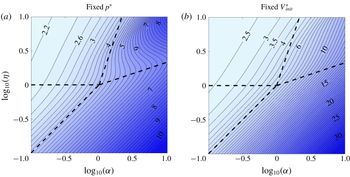
Contour plots of the time
 $t_{90}^{\ast }$
for a network with
 $n=5$
to evict 90 % of its initial volume, for two different non-dimensionalisations. (a) The original non-dimensionalisation (2.5c
), based on initial pressure
 $p^{\ast }$
,
 $\log _{10}(t_{90})$
. (b) A non-dimensionalisation (5.3) based on initial volume
 $V_{init}^{\ast }$
,
 $\log _{10}(\tilde{t}_{90})=\log _{10}(t_{90}V_{init}^{3})$
. The dashed lines are the regime boundaries from figure 6.

In addition to the late-time dynamics and volume and pressure distributions studied in § 4, the early-time dynamics is also of great importance for the hydraulic fracturing industry, in particular with regards to wastewater management and hydrocarbon production planning. The operation of hydraulic fracturing wells necessitates better management and prediction of the backflow quantities, and time scales, of the injected fracturing fluids. It is useful to define a measure for comparison of the behaviour of different network structures, based on the relative amount of volumetric flux they produce in a given time period, i.e. how fast is drainage.
We measure the drainage relative to the initial volume
 $V_{init}^{\ast }$
(non-dimensionalised to
 $V_{init}$
), defined by
 $$\begin{eqnarray}V_{init}^{\ast }=\mathop{\sum }_{i=0}^{n-1}\left(\frac{\unicode[STIX]{x1D6FC}^{\ast }\unicode[STIX]{x1D719}^{\ast }}{\unicode[STIX]{x1D702}^{\ast }}\right)^{i}\frac{p^{\ast }L}{\hat{E}}=\frac{p^{\ast }L}{\hat{E}}V_{init},\quad \text{i.e. }V_{init}=\mathop{\sum }_{i=0}^{n-1}\left(\frac{\unicode[STIX]{x1D6FC}}{\unicode[STIX]{x1D702}}\right)^{i},\end{eqnarray}$$
and compare drainage efficiency using the time
 $$\begin{eqnarray}t_{90}^{\ast }=\frac{12\unicode[STIX]{x1D707}\hat{E}^{2}L^{2}}{p^{\ast 3}}t_{90}\end{eqnarray}$$
that it takes for 90 % of the initial volume to be ejected from the system. (The value 90 % is somewhat arbitrary, but should give a good indication of how drainage efficiency varies with
 $\unicode[STIX]{x1D6FC}$
and
 $\unicode[STIX]{x1D702}$
in general.)
Calculated values of
 $\log _{10}(t_{90})$
are presented for different parameter values in figure 7 for
 $n=5$
. Glancing at the trends presented in figure 7(a), we can immediately see a general decrease in drainage efficiency from the top left quadrant (‘volume at root, pressure drop at tip’) towards the bottom right quadrant (‘volume at tip, pressure drop at root’). This trend is a result of two distinct physical effects. Firstly, an increase in the branching factor
 $\unicode[STIX]{x1D6FC}$
shifts the initial volume towards the tip end of the network and hence delays the drainage. (Although not shown, for certain scaling forms, this trend is further enhanced with an increase in
 $n$
as the bulk volume is moved further away from the outlet (Dana et al.
Reference Dana, Zheng, Peng, Stone, Huppert and Ramon2018).) Secondly, an increase of the elasticity factor
 $\unicode[STIX]{x1D702}$
has the reverse effect, shifting the volume towards the root and enhancing the evacuation rate (since the rigid tip is more effective at expelling the fluids). As a consequence, the network is least efficient when
 $\unicode[STIX]{x1D6FC}\gg 1$
and
 $\unicode[STIX]{x1D702}\ll 1$
, i.e. in the asymptotic regime with volume at the tip and pressure drop at the root.
Looking more closely at the upper right corner of figure 7(a), we find that the curved contours indicate non-monotonicity in
 $\unicode[STIX]{x1D702}$
: for example, for
 $\unicode[STIX]{x1D6FC}=10^{1/2}$
, as
 $\unicode[STIX]{x1D702}$
increases,
 $t_{90}$
initially decreases as expected, but then increases for a while, before decreasing again. This is due to the varying initial volume in the network, as we shall now show.
The non-dimensional initial volume
 $V_{init}$
(5.1) varies with
 $\unicode[STIX]{x1D6FC}$
(by the addition of more branches) and
 $\unicode[STIX]{x1D702}$
(by the change of the initial apertures), so figure 7(a) is comparing the evacuation times of networks with different initial volume (but with the same initial pressure). This can yield misleading results even though
 $t_{90}$
is defined relative to the initial volume. If we consider two physical systems with different
 $\unicode[STIX]{x1D6FC}^{\ast }$
and
 $\unicode[STIX]{x1D702}^{\ast }$
but the same initial volume
 $V_{init}^{\ast }$
, then their different initial pressures
 $p^{\ast }$
result in the drainage times
 $t_{90}^{\ast }$
being non-dimensionalised using different time scales (2.5c
). Hence comparing the values of
 $t_{90}$
can yield the opposite result to comparing the original values
 $t_{90}^{\ast }$
.
Thus, for a direct comparison, we need to replace the non-dimensionalisation (2.5), which is based on the initial pressure
 $p^{\ast }$
, with a non-dimensionalisation based on initial volume
 $V_{init}^{\ast }$
, such as
 $$\begin{eqnarray}\tilde{h}_{i}=h_{i}^{\ast }\left/\left(\frac{V_{init}^{\ast }}{L}\right)\right.,\quad \tilde{p}_{i}=p_{i}^{\ast }\left/\left(\frac{\hat{E}V_{init}^{\ast }}{L}\right)\right.\quad \text{and}\quad \tilde{t}=t^{\ast }\left/\left(\frac{12\unicode[STIX]{x1D707}L^{5}}{\hat{E}V_{init}^{\ast 3}}\right)\right.,\end{eqnarray}$$
where the tildes indicate the new rescaling. (The spatial variable
 $x$
remains the same.) These are related to the original non-dimensional variables (2.5) by
 $$\begin{eqnarray}\frac{\tilde{h}_{i}}{h_{i}}=V_{init},\quad \frac{\tilde{p}_{i}}{p_{i}}=V_{init}\quad \text{and}\quad \frac{\tilde{t}}{t}=V_{init}^{3},\end{eqnarray}$$
where
 $V_{init}$
is the initial volume (5.1) under the original non-dimensionalisation.
The contour plot of drainage time for the new non-dimensionalisation (5.3) is shown in figure 7(b). The result for
 $\tilde{t}$
is now monotonic in both
 $\unicode[STIX]{x1D6FC}$
and
 $\unicode[STIX]{x1D702}$
, which confirms the intuitive explanations presented above. We conclude that the non-monotonicity observed in the upper right corner of figure 7(a) is simply due to the variation of initial volume (5.1) with
 $\unicode[STIX]{x1D6FC}$
(which adds branches) and
 $\unicode[STIX]{x1D702}$
(which affects the initial apertures).
We can also conclude that, in general, when comparing non-dimensional results for
 $t_{90}^{\ast }$
, one must be aware of which parameters were used in the non-dimensionalisation and hence must be considered fixed in order for the comparison to be valid. For example, when comparing the effect of the number of generations
 $n$
on the drainage efficiency, the results can differ depending on which length is held fixed: the length
 $L$
of a single channel or the length
 $L\sum _{i=0}^{n-1}\unicode[STIX]{x1D719}^{\ast i}$
of the entire network. Yet another possibility is that no particular length is fixed, and instead, for example, both the initial volume
 $V_{init}^{\ast }$
and the initial pressure
 $p^{\ast }$
are held fixed.
6 Summary and discussion
In this paper we have considered fluid flow out of a relaxing fracture network characterised by parameters accounting for a branching factor and spatially varying length and elastic modulus. This is an extension of the case considered by Dana et al. (Reference Dana, Zheng, Peng, Stone, Huppert and Ramon2018) that assumed these properties to be uniform. The variations were described by a self-similar model, in which each property (channel length, number of channels in a generation or elastic modulus) is multiplied by an additional single factor
 $\unicode[STIX]{x1D719}^{\ast }$
,
 $\unicode[STIX]{x1D6FC}^{\ast }$
or
 $\unicode[STIX]{x1D702}^{\ast }$
with every further generation upstream. We used numerical results (figure 3) for various parameter values that provide distinct volume and pressure distributions along the network, which led to characterising the entire parameter space using four main regimes based on the localisation of the fluid volume and pressure drop. For example, when the pressure drop is localised near the root, the network can be approximated as a reservoir with a uniform pressure along the network, and when the volume is near the tip, the flux can be considered as uniform along the flow path. Conversely, when the pressure drop is near the tip and the volume near the root, each channel behaves like an isolated channel, not feeling the effects of its upstream neighbours.
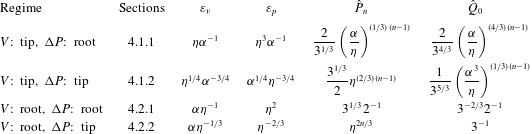
Asymptotic solutions for the time evolution of the apertures, pressure profiles and outlet flux were found for each regime (see summary of results in table 1) in the main cases where the fluid volume and pressure drop are concentrated in a single generation of channels at either end of the network. The predicted values agree well with the numerical results to the order of error suggested for the parameters in each regime, i.e.
 $O(\unicode[STIX]{x1D700}_{v},\unicode[STIX]{x1D700}_{p})$
, when
 $\unicode[STIX]{x1D700}_{v},\unicode[STIX]{x1D700}_{p}\ll 1$
(figure 3). For more moderate values of
 $\unicode[STIX]{x1D700}_{v}$
and
 $\unicode[STIX]{x1D700}_{p}$
, the fluid volume and pressure drop are spread out across multiple generations, but the same physical principles hold, and some asymptotic results have been found (see § A.2 and figure 4). The error parameters describe the distributions of the features along the network well (figure 5) and have given us confidence in our asymptotic results.
In addition to the late-time asymptotic behaviour, we also investigated the early-time behaviour in the form of drainage time (i.e. the time needed to drain 90 % of the initial volume of the network). A larger value of
 $\unicode[STIX]{x1D6FC}$
or smaller value of
 $\unicode[STIX]{x1D702}$
causes the initial volume to shift away from the outlet, and hence delays drainage. This monotonic dependence of the drainage time on
 $\unicode[STIX]{x1D6FC}$
and
 $\unicode[STIX]{x1D702}$
is evident in figure 7(b), which uses a non-dimensionalisation involving the initial volume and hence corresponds to comparing networks with the same initial volume. For other non-dimensionalisations, such as the original one which was based on initial pressure rather than volume, the variation of the drainage time with
 $\unicode[STIX]{x1D6FC}$
and
 $\unicode[STIX]{x1D702}$
is more complicated (figure 7
a).
We have presented a methodological investigation of model network structures and provided insight into how the various pre-strained network structures relax back to their unstrained state while draining. This work was made, in part, as an attempt to create a framework that may inform design of fluid waste management (i.e. amounts of cumulative wastewater over time) from hydraulic fracture networks, could be utilised to enhance production from existing network structures or even, in the future, assist in analysing flow data from wells to gain insight into the fractured formation. Such a framework may also be utilised for various systems where the depressurisation of an elastic material occurs, e.g. in common microfluidic devices. However, further advancements along with validation against observational data are still needed to achieve such goals.
Main asymptotic results of error estimates, tip pressure and outlet flux for the different regimes.

Acknowledgements
A.D. acknowledges support from The Nancy and Stephen Grand Technion Energy Program (GTEP). This research was supported by the Israeli Ministry of Energy and Water under the student scholarship programme for degrees in the field of energy. H.A.S. acknowledges the NSF (CBET-1509347).
Appendix A
A.1 Numerical computation
We evolve the discretised system formulated in § 2.3 forward using an explicit method. At each time step we know the present
 $h_{i}$
and need to calculate
 ${\dot{h}}_{i}$
, which we do by first solving an algebraic system of equations for
 $\hat{p}_{i}$
and
 $\hat{q}_{i}$
. Substituting the force balance (2.12a
) into ODE (2.12b
), we obtain the set of linear algebraic equations
 $$\begin{eqnarray}\displaystyle 6\unicode[STIX]{x1D6FC}^{i}h_{i}^{3}\hat{p}_{i}+\hat{q}_{i}+6\unicode[STIX]{x1D6FC}^{i}h_{i}^{3}\hat{p}_{i+1}-\hat{q}_{i+1} & = & \displaystyle 12\unicode[STIX]{x1D6FC}^{i}\unicode[STIX]{x1D702}^{i}h_{i}^{4},\end{eqnarray}$$
 $$\begin{eqnarray}\displaystyle 2\unicode[STIX]{x1D6FC}^{i}h_{i}^{3}\hat{p}_{i}+\hat{q}_{i}-2\unicode[STIX]{x1D6FC}^{i}h_{i}^{3}\hat{p}_{i+1}+\hat{q}_{i+1} & = & \displaystyle 0,\end{eqnarray}$$
 $\hat{q}_{i+1}$
from (A 1a
),
 $\hat{p}_{i}$
from (A 1b
) and include the boundary conditions (2.13b,c
) to obtain the tridiagonal matrix equation
 $$\begin{eqnarray}\left(\begin{array}{@{}cccccccc@{}}1 & 0 & 0 & 0 & 0 & 0 & \ldots \, & 0\\[3.0pt] 4h_{0}^{3}\unicode[STIX]{x1D6FC}^{0} & 1 & 2h_{0}^{3}\unicode[STIX]{x1D6FC}^{0} & 0 & 0 & 0 & \ldots \, & 0\\[3.0pt] 0 & 1 & -6h_{0}^{3}\unicode[STIX]{x1D6FC}^{0} & 2 & 0 & 0 & \ldots \, & 0\\[3.0pt] 0 & 0 & 4h_{1}^{3}\unicode[STIX]{x1D6FC}^{1} & 1 & 2h_{1}^{3}\unicode[STIX]{x1D6FC}^{1} & 0 & \ldots \, & 0\\[3.0pt] 0 & 0 & 0 & 1 & -6h_{1}^{3}\unicode[STIX]{x1D6FC}^{1} & 2 & \ldots \, & 0\\ \vdots & \vdots & \vdots & \vdots & \vdots & \vdots & \ldots \, & \vdots \\[3.0pt] 0 & 0 & \ldots \, & 0 & 4h_{n-1}^{3}\unicode[STIX]{x1D6FC}^{n-1} & 1 & 2h_{n-1}^{3}\unicode[STIX]{x1D6FC}^{n-1} & 0\\[3.0pt] 0 & 0 & \ldots \, & 0 & 0 & 1 & -6h_{n-1}^{3}\unicode[STIX]{x1D6FC}^{n-1} & 2\\[3.0pt] 0 & 0 & \ldots \, & 0 & 0 & 0 & 0 & 1\end{array}\right)\!\!\left(\begin{array}{@{}c@{}}\hat{p}_{0}\\[3.0pt] \hat{q}_{0}\\[3.0pt] \hat{p}_{1}\\[3.0pt] \hat{q}_{1}\\[3.0pt] \hat{p}_{2}\\ \vdots \\[3.0pt] \hat{q}_{n-1}\\[3.0pt] \hat{p}_{n}\\[3.0pt] \hat{q}_{n}\end{array}\right)=\left(\begin{array}{@{}c@{}}0\\[3.0pt] 6\unicode[STIX]{x1D702}^{0}h_{0}^{4}\\[3.0pt] -6\unicode[STIX]{x1D702}^{0}h_{0}^{4}\\[3.0pt] 6\unicode[STIX]{x1D702}^{1}h_{1}^{4}\\[3.0pt] -6\unicode[STIX]{x1D702}^{1}h_{1}^{4}\\ \vdots \\[3.0pt] 6\unicode[STIX]{x1D702}^{n-1}h_{n-1}^{4}\\[3.0pt] -6\unicode[STIX]{x1D702}^{n-1}h_{n-1}^{4}\\[3.0pt] 0\end{array}\right)\!.\end{eqnarray}$$
We use the tridiagonal matrix algorithm to solve this in each time step and obtain the temporal evolution from (2.12b ).
A.2 Asymptotic results for moderate values of
$\unicode[STIX]{x1D700}_{p}$
and
$\unicode[STIX]{x1D700}_{v}$


Having considered all four regimes in §§ 4.1 and 4.2, where the error estimates
 $\unicode[STIX]{x1D700}_{v}$
and
 $\unicode[STIX]{x1D700}_{p}$
are all assumed to satisfy
 $\unicode[STIX]{x1D700}\ll 1$
, we now consider parameter choices corresponding to more moderate values of
 $\unicode[STIX]{x1D700}_{v},\unicode[STIX]{x1D700}_{p}<1$
, corresponding to the shaded region within the dashed lines in figure 5. As we shall see, our physical insights for each regime apply to these cases as well.
Figure 4 shows results from each of the four regimes with
 $\unicode[STIX]{x1D700}_{v}=\unicode[STIX]{x1D700}_{p}=1/2$
and
 $n=10$
. We find that in each case the dominant volume and pressure drop remain localised to the predicted end of the network, but are spread out across multiple generations of channels rather than being concentrated in a single one (cf. figure 3).
Since we expect the volume to change by a factor
 $\unicode[STIX]{x1D700}_{v}$
in each generation, the volume can be considered as localised near either the root or tip as long as
 $\unicode[STIX]{x1D700}_{v}^{n}\ll 1$
. Similarly, the localisation of the pressure drop requires
 $\unicode[STIX]{x1D700}_{p}^{n}\ll 1$
. Under these conditions, we now investigate the physics in each of the four regimes.
A.2.1 Volume at tip, pressure drop at root
In this section, we present the generalisation of the method in § 4.1.1 (in which the dominant volume and pressure drop are confined to a single channel only) to moderate cases (when they are spread out across multiple channels).
Given the approximately uniform pressure
 $P$
in the region near the tip, the apertures are given by (4.7c
) and hence the outlet flux
 $Q$
(2.19) generated by the channels near the tip is
 $$\begin{eqnarray}Q\approx \frac{1}{3}\mathop{\sum }_{i=0}^{n-1}\unicode[STIX]{x1D6FC}^{i}H_{i}\approx \frac{(\unicode[STIX]{x1D6FC}/\unicode[STIX]{x1D702})^{n}}{\unicode[STIX]{x1D6FC}/\unicode[STIX]{x1D702}-1}P=\frac{\unicode[STIX]{x1D700}_{v}^{1-n}}{1-\unicode[STIX]{x1D700}_{v}}P,\end{eqnarray}$$
where
 $\unicode[STIX]{x1D700}_{v}=\unicode[STIX]{x1D702}/\unicode[STIX]{x1D6FC}<1$
. Here, we have assumed that
 $\unicode[STIX]{x1D700}_{v}^{n}\ll 1$
, so that we can neglect the contributions from channels far away from the tip, such as those near the root where the pressure is not uniform. The result (A 3) reduces to the original result (4.3) in the limit
 $\unicode[STIX]{x1D700}_{v}\ll 1$
.
Given the approximately uniform flux
 $Q\gg 1$
through the region near the root, we rescale
 $\hat{P}_{i}=Q^{1/4}\bar{P}_{i}$
and
 ${\hat{H}}_{i}=Q^{1/4}\bar{H}_{i}$
to simplify (2.16b
) and (2.16c
) to
 $$\begin{eqnarray}1=\unicode[STIX]{x1D6FC}^{i}H_{i}^{3}(\bar{P}_{i+1}-\bar{P}_{i}),\quad \frac{\bar{P}_{i+1}+\bar{P}_{i}}{2}=\unicode[STIX]{x1D702}^{i}\bar{H}_{i}\quad \Rightarrow \quad \bar{P}_{i+1}-\bar{P}_{i}=\unicode[STIX]{x1D700}_{p}^{i}\left(\frac{2}{\bar{P}_{i+1}+\bar{P}_{i}}\right)^{3},\end{eqnarray}$$
where
 $\unicode[STIX]{x1D700}_{p}=\unicode[STIX]{x1D702}^{3}/\unicode[STIX]{x1D6FC}<1$
. Starting from
 $\bar{P}_{0}=0$
, equation (A 4) can be solved numerically to yield
 $\bar{P}_{\infty }=\lim _{i\rightarrow \infty }\bar{P}_{i}$
as a function of
 $\unicode[STIX]{x1D700}_{p}$
(figure 8
a). The result
 $P=Q^{1/4}\bar{P}_{\infty }$
then replaces (4.5b
), and when combined with (A 3) yields
 $P$
and
 $Q$
. The condition
 $\unicode[STIX]{x1D700}_{p}^{n}\ll 1$
is required for the pressure drops to be negligible at the tip end.
We can calculate
 $\bar{P}_{\infty }$
asymptotically as follows. For large
 $i$
, the difference between
 $\bar{P}_{i}$
and
 $\bar{P}_{i+1}$
is small, so we can approximate (A 4) as
 $$\begin{eqnarray}\frac{\bar{P}_{i+1}^{4}-\bar{P}_{i}^{4}}{4}=\unicode[STIX]{x1D700}_{p}^{i}F(\bar{P}_{i+1}/\bar{P}_{i})\approx \unicode[STIX]{x1D700}_{p}^{i}\quad \Rightarrow \quad \frac{\bar{P}_{i}^{4}}{4}=C+\mathop{\sum }_{j=0}^{i-1}\unicode[STIX]{x1D700}_{p}^{j-1}=C+\frac{1-\unicode[STIX]{x1D700}_{p}^{i}}{1-\unicode[STIX]{x1D700}_{p}},\end{eqnarray}$$
where
 $F(x)=2(x^{3}+x^{2}+x+1)/(1+x)^{3}\approx 1$
for
 $x\approx 1$
, and the constant
 $C$
must be determined from the solution at smaller values of
 $i$
where the approximation
 $F\approx 1$
does not hold. For
 $\unicode[STIX]{x1D700}_{p}\ll 1$
, the calculation (4.5) yields
 $C=1$
. For
 $\unicode[STIX]{x1D700}_{p}=1$
, we solve (A 4) numerically and find
 $C\approx 1.008$
(using only the first equality in (A 5b
), which is valid for
 $\unicode[STIX]{x1D700}_{p}=1$
). Noting the coincidental close agreement between the two results
 $C=1$
and
 $C\approx 1.008$
at opposite ends of the range
 $0<\unicode[STIX]{x1D700}_{p}<1$
, we use
 $C=1$
as a universal approximation, i.e.
 $$\begin{eqnarray}\bar{P}_{i}\approx \left[4\left(1+\frac{1-\unicode[STIX]{x1D700}_{p}^{i}}{1-\unicode[STIX]{x1D700}_{p}}\right)\right]^{1/4},\quad \bar{P}_{\infty }\approx \bar{P}_{a}=\left(\frac{4(2-\unicode[STIX]{x1D700}_{p})}{1-\unicode[STIX]{x1D700}_{p}}\right)^{1/4}.\end{eqnarray}$$
This approximate result agrees with the numerical result to within 0.01 % for all values of
 $\unicode[STIX]{x1D700}_{p}<1$
, as seen in figure 8(a,b).
Results for the moderate case of the ‘volume at tip, pressure drop at root’ regime. (a) Comparison between the numerical solution
 $\bar{P}_{\infty }$
of (A 4) and the asymptotic approximation
 $\bar{P}_{a}$
(A 7), as functions of
 $\unicode[STIX]{x1D700}_{p}=\unicode[STIX]{x1D702}^{3}/\unicode[STIX]{x1D6FC}$
. (b) The relative error. (c) The maximal pressure
 $P$
for
 $n=10$
as a function of
 $\unicode[STIX]{x1D700}_{v}$
and
 $\unicode[STIX]{x1D700}_{p}$
, showing both numerical results and the asymptotic approximation (4.9a
).

We conclude that the main physical principles discussed in § 4.1.1 remain valid: the tip pressure
 $P$
determines the volume contained near the tip and hence the outlet flux
 $Q$
, yielding a formula (A 3), analogous to (4.3), for
 $Q$
in terms of
 $P$
. The outlet flux
 $Q$
determines the pressure drop near the root and hence the tip pressure
 $P$
, yielding a formula (A 6), analogous to (4.5b
), for
 $P$
in terms of
 $Q$
. Combining the two formulae yields (4.9). This result is valid for all
 $\unicode[STIX]{x1D700}_{v}=\unicode[STIX]{x1D702}/\unicode[STIX]{x1D6FC}<1$
and
 $\unicode[STIX]{x1D700}_{p}=\unicode[STIX]{x1D702}^{3}/\unicode[STIX]{x1D6FC}<1$
(provided that
 $\unicode[STIX]{x1D700}_{v}^{n},\unicode[STIX]{x1D700}_{p}^{n}\ll 1$
), and reduces to (4.6) in the limit
 $\unicode[STIX]{x1D700}_{v},\unicode[STIX]{x1D700}_{p}\ll 1$
. The predicted tip pressure
 $P$
, and the volume and pressure profiles, i.e. (4.7c
) and (A 6), agree well with the numerical results in figure 4(d). This confirms that our understanding of the physical mechanisms controlling the dynamics of the system is correct. A comparison between the numerical and asymptotic results for
 $P=\hat{P}_{n}$
is shown in figure 8(c). The results agree excellently for small values of
 $\unicode[STIX]{x1D700}_{v}$
and
 $\unicode[STIX]{x1D700}_{p}$
, and as
 $\unicode[STIX]{x1D700}_{v},\unicode[STIX]{x1D700}_{p}\rightarrow 1$
the
 $O(\unicode[STIX]{x1D700}_{v}^{n},\unicode[STIX]{x1D700}_{p}^{n})$
error becomes noticeable as expected.
A.2.2 Volume at root, pressure drop at tip
If the volume is localised near the root and the pressure drop at the tip, then for
 $\unicode[STIX]{x1D700}_{v},~\unicode[STIX]{x1D700}_{p}\ll 1$
(see § 4.2.2) each channel behaves like an isolated channel since it depends on the pressure downstream (which is negligible) and the flux upstream (which is also negligible). For moderate values of
 $\unicode[STIX]{x1D700}_{v},\unicode[STIX]{x1D700}_{p}<1$
, each channel can be influenced by multiple channels upstream and downstream, but in the bulk of the network (far away from the root and tip ends) the channels are not affected by the boundary conditions (2.17) and hence a self-similar structure of the form
 $$\begin{eqnarray}\hat{P}_{i}=\unicode[STIX]{x1D702}^{2i/3}\bar{P},\quad H_{i}=\unicode[STIX]{x1D702}^{-i/3}\bar{H},\quad \hat{Q}_{i}=\left(\frac{\unicode[STIX]{x1D6FC}}{\unicode[STIX]{x1D702}^{1/3}}\right)^{i}\bar{Q}\end{eqnarray}$$
can be found, where substitution into the governing equations (2.16a ) yields the coefficients
 $$\begin{eqnarray}\bar{H}=3(1-\unicode[STIX]{x1D700}_{v})\bar{Q}=\left(\frac{(1+\unicode[STIX]{x1D700}_{v})(1+\unicode[STIX]{x1D700}_{p})}{12(1-\unicode[STIX]{x1D700}_{v})(1-\unicode[STIX]{x1D700}_{p})}+\frac{1}{36}\right)^{1/3},\quad \bar{P}=\frac{(1+\unicode[STIX]{x1D700}_{v})\unicode[STIX]{x1D700}_{p}}{6(1-\unicode[STIX]{x1D700}_{v})(1-\unicode[STIX]{x1D700}_{p})\bar{H}^{2}}.\end{eqnarray}$$
The self-similar result (A 7) is shown in figure 4(a), and is indeed seen to apply in the bulk of the network away from the ends. Near the root and tip end, the solution deviates from (A 7) in order to satisfy the boundary conditions (2.17), but the expressions (A 7) can be used as order-of-magnitude estimates for the maximum pressure
 $\hat{P}_{n}=O(\unicode[STIX]{x1D702}^{2n/3}\bar{P})$
(see figure 9) and the outlet flux
 $Q_{0}=O(\bar{Q})$
.
The maximal pressure
 $\hat{P}_{n}$
(rescaled by
 $\unicode[STIX]{x1D702}^{2n/3}$
) for
 $n=10$
as a function of
 $\unicode[STIX]{x1D700}_{v}$
and
 $\unicode[STIX]{x1D700}_{p}$
, showing both numerical results and the order-of-magnitude estimate
 $\unicode[STIX]{x1D702}^{-2n/3}\hat{P}_{n}=O(\bar{P})$
obtained from the self-similar solution (A 6).

A.2.3 Volume and pressure drop at the same end (root or tip)
If both the volume and pressure drop are localised at the same end of the network (like in §§ 4.1.2 or 4.2.1), then that end (whether a single channel in the original case or multiple channels in the moderate case) controls the backflow dynamics while the rest of the network can be neglected.
We confirm this in figure 4(c) for the root end, by comparing the results for a network of size
 $n=10$
and a network of size
 $n=5$
, which corresponds to the root-end half of the larger network. Since
 $\unicode[STIX]{x1D700}_{v}^{5},\unicode[STIX]{x1D700}_{p}^{5}\ll 1$
, the region
 $5\leqslant i\leqslant 9$
in the larger network has a negligible effect. In general, the structure near the root is independent of
 $n$
when
 $\unicode[STIX]{x1D700}_{v}^{n},\unicode[STIX]{x1D700}_{p}^{n}\ll 1$
. The maximal pressure
 $P$
and outlet flux
 $Q$
then depend only on
 $\unicode[STIX]{x1D6FC}$
and
 $\unicode[STIX]{x1D702}$
, and can be calculated numerically.
For the tip end, figure 4(b) shows a comparison between results for a network of size
 $n=10$
and a network of size
 $n=5$
that has been shifted and rescaled so that it corresponds to the tip-end half
 $5\leqslant i\leqslant 9$
of the larger network. (Specifically,
 $P$
is multiplied by
 $(\unicode[STIX]{x1D702}^{2/3})^{5}$
and
 $V_{i}$
by
 $(\unicode[STIX]{x1D6FC}/\unicode[STIX]{x1D702}^{1/3})^{5}$
.) Again, there is good agreement between the two results, indicating that the root half of the network is negligible, and that
 $P/\unicode[STIX]{x1D702}^{2/3}$
and
 $Q/(\unicode[STIX]{x1D6FC}/\unicode[STIX]{x1D702}^{1/3})^{n}$
are independent of
 $n$
.