
1. Introduction
Due to climate change, severe droughts are gradually becoming more frequent across the globe. Trees are particularly vulnerable to water stresses, as their sap conduction occurs mainly at negative pressure, close to the cavitation threshold. When air penetrates the vessels of a tree, it forms an embolism which can dramatically impair hydraulic circulation and lead to the tree's death (Tyree & Zimmermann Reference Tyree and Zimmermann2013; Venturas, Sperry & Hacke Reference Venturas, Sperry and Hacke2017), which is one the major threats for the survival of forests for the next decades (Choat et al. Reference Choat, Jansen, Brodribb, Cochard, Delzon, Bhaskar, Bucci, Feild, Gleason and Hacke2012, Reference Choat, Brodribb, Brodersen, Duursma, López and Medlyn2018; Brodribb et al. Reference Brodribb, Powers, Cochard and Choat2020).
Direct observations of embolism in trees have recently been enabled by the development of high-resolution imaging like X-ray tomography (Cochard, Delzon & Badel Reference Cochard, Delzon and Badel2015) and magnetic resonance imaging (Choat et al. Reference Choat, Drayton, Brodersen, Matthews, Shackel, Wada and McElrone2010; Fukuda et al. Reference Fukuda, Kawaguchi, Aihara, Ogasa, Miki, Haishi and Umebayashi2015). However, the time resolution of those methods is generally insufficient to observe fast embolism propagation. It is more practical to observe dynamics of embolism growth directly in herbaceous plants (Skelton, Brodribb & Choat Reference Skelton, Brodribb and Choat2017) or in leaves (Brodribb et al. Reference Brodribb, Skelton, McAdam, Bienaimé, Lucani and Marmottant2016b), due to their slender geometry and/or their relative transparency. Leaves are particularly exposed to air and more prone to exhibit air embolisation during droughts. A systematic study across various species revealed recently via optical imaging that the drying in real leaves is characterised by an intermittent jerky dynamics (Brodribb, Bienaimé & Marmottant Reference Brodribb, Bienaimé and Marmottant2016a). These sudden propagations contrast with the smooth flows of sap reported in the absence of air embolisms (Katifori, Szöllősi & Magnasco Reference Katifori, Szöllősi and Magnasco2010). Despite a comprehensive description of the embolism formation dynamics in leaves of many species, an in-depth physical understanding is still missing.
We have carried out biomimetic studies in order to replicate this phenomenon in microfluidic chips. Biomimetic microfluidics in so-called trees-on-a-chip has already enabled the reproduction of key phenomena of plant hydrodynamics, like vein circulation at negative pressure (Wheeler & Stroock Reference Wheeler and Stroock2008), leaf transpiration (Noblin et al. Reference Noblin, Mahadevan, Coomaraswamy, Weitz, Holbrook and Zwieniecki2008), cavitation in inclusions (Duan et al. Reference Duan, Karnik, Lu and Majumdar2012; Vincent et al. Reference Vincent, Marmottant, Quinto-Su and Ohl2012; Vincent & Marmottant Reference Vincent and Marmottant2017; Bruning et al. Reference Bruning, Costalonga, Snoeijer and Marín2019), osmotic flows (Jensen et al. Reference Jensen, Rio, Hansen, Clanet and Bohr2009) and phloem loading (Comtet et al. Reference Comtet, Jensen, Turgeon, Stroock and Hosoi2017). Inspired by the design proposed by Noblin et al. (Reference Noblin, Mahadevan, Coomaraswamy, Weitz, Holbrook and Zwieniecki2008), and based on pervaporation across PDMS as a tool to mimic evapotranspiration of leaves, we explored the dynamics of propagation of air embolism in dead-end microchannels (Dollet et al. Reference Dollet, Louf, Alonzo, Jensen and Marmottant2019). However, drying dynamics was found to be smooth, contrary to the phenomenology reported in real leaves. In our previous studies, channel width was taken constant (Dollet et al. Reference Dollet, Louf, Alonzo, Jensen and Marmottant2019, Reference Dollet, Chagua Encarnación, Gautier and Marmottant2021) or slowly varying (Chagua Encarnación, Marmottant & Dollet Reference Chagua Encarnación, Marmottant and Dollet2021). In reality, there are pits between sap-conducting cells in trees that are considered to be at the origin of the resistance to embolisation in wood vessels (Cochard, Cruiziat & Tyree Reference Cochard, Cruiziat and Tyree1992). Those submicron porous membranes separate neighbouring vessels and act as passive valves preventing air bubbles penetrating further in the network due to capillarity. However, under severe drought, the pressure within the hydraulic network can be so strongly negative that air embolisms manage to pass through the pits and invade the network very suddenly. The compliance of the hydraulic network of trees – i.e. the change of volume of their channels and neighbouring cells in response to a pressure change – is considered an important feature during air embolism formation (Hölttä et al. Reference Hölttä, Cochard, Nikinmaa and Mencuccini2009), but live observations are still missing.
In microfluidics, numerous studies have investigated the deformation of compliant microchannels due to hydrodynamic forces (Holden et al. Reference Holden, Kumar, Beskok and Cremer2003; Gervais et al. Reference Gervais, El-Ali, Günther and Jensen2006; Hardy et al. Reference Hardy, Uechi, Zhen and Kavehpour2009; Christov et al. Reference Christov, Cognet, Shidhore and Stone2018) in pure one-phase flows. Furthermore, when two phases are transported in a compliant microchannel, the capillary forces exerted at the fluid–fluid interface can deform the walls substantially, a phenomenon referred to as elasto-capillarity (Roman & Bico Reference Roman and Bico2010). It can lead to complex couplings between two-phase flows and compliant walls (Heil & Hazel Reference Heil and Hazel2016; Juel, Pihler-Puzović & Heil Reference Juel, Pihler-Puzović and Heil2018), as for viscous fingering instabilities (Pihler-Puzović et al. Reference Pihler-Puzović, Illien, Heil and Juel2012, Reference Pihler-Puzović, Périllat, Russell, Juel and Heil2013) or for the propagation of air fingers in rectangular compliant channels where highly non-linear dynamics were reported (Ducloué et al. Reference Ducloué, Hazel, Pihler-Puzović and Juel2017a,Reference Ducloué, Hazel, Thompson and Juelb; Fontana et al. Reference Fontana, Juel, Bergemann, Heil and Hazel2021). Those latter considerations are of primary importance for numerous biological flows (Heil & Hazel Reference Heil and Hazel2011), in particular in collapsed lungs (Grotberg Reference Grotberg1994; Grotberg & Jensen Reference Grotberg and Jensen2004; Heil, Hazel & Smith Reference Heil, Hazel and Smith2008). The coupling between deformability and capillarity also has a strong effect on adhesion (Butler et al. Reference Butler, Box, Robert and Vella2019) and on droplet self-transport (Bradley et al. Reference Bradley, Box, Hewitt and Vella2019).
In this paper, we consider the physical effects of a single constriction inside a compliant channel of otherwise constant width, in order to mimic the role of pits in plants. The water, initially present in the vessel, gradually pervaporates through the surrounding medium, a phenomenon replicating the effect of evapotranspiration in real leaves. As the air bubble (or air embolism) grows within the channel and penetrates the constriction, we unravel a stop-and-go dynamics, which may be the building block of the intermittent drying dynamics in leaves. We show that this highly nonlinear dynamics is generated by the elasto-capillary coupling between the compliance of the channel and the interface curvature, forced to sustain large changes due to the constriction, thereby inducing substantial changes of the capillary pressure within the liquid-filled part of the channel.
First, we describe the experimental materials and methods used in this study (§ 2). We then describe extensively the dynamics of propagation of the air embolism induced by pervaporation, recalling the smooth dynamics in the absence of constriction (§ 3.1), contrasting with the stop-and-go induced by the constriction (§ 3.2). We associate this dynamics with observations of the deformation of the channels via confocal imaging (§ 3.3), and show that the deformation results from an elasto-capillary coupling between the meniscus in the constriction and the deformable channel (§ 3.4), in agreement with experiments realised by replacing water by ethanol (§ 3.5) and with a volume conservation check comparing macroscopic experiments and confocal imaging (§ 3.6). We then reinforce the validity of this physical mechanism by depicting the influence of the channel geometry on two key variables of this stop-and-go dynamics: the length of the jump (§§ 4.1, 4.2 and 4.3) and the time of residence of the interface inside the constriction (§ 4.4). We also describe the dynamics of the sudden propagation of the air embolism past the constriction, and compare it with theoretical predictions (§ 5). Finally, we summarise our findings and propose connections with other fields as well as perspectives for future studies (§ 6).
2. Materials and methods
2.1. Channel fabrication and design
The channels are made by photolithography. An SU8 resin (provided by Gersteltec) is spin coated on a silicon wafer, at thickness  $h$. By photolithography, the negative pattern of the channels is cured by UV light through a mask (provided by Selba company). The uncured resin is then washed out using propylene glycol methyl ether acetate. After a final bake of the silicon wafer at
 $200\,^\circ {\rm C}$ for two hours, our textured surface is ready to use as a mould.
In order to make our biomimetic transpirating leaves, we use polydimethylsiloxane (PDMS; Sylgard $^{\rm {TM}}$ 184, from Dow company), a silicone-based elastomer. We mix a mass fraction of
 $10\,\%$ of curing agent and 90 % of base. After an energic stirring, the mixture is degassed under vacuum. After about
 $60$ min of degassing, we spin coat
 $2.5$ ml of the mixture on the textured silicon surface (
 $10$ s at
 $500$ rounds per minute (r.p.m.), and
 $40$ s at a speed varying between
 $700$ and
 $2000$ r.p.m. depending on the desired thickness). The spin-coated liquid film is then left to rest for
 $1$ h in order to have a homogeneous thickness by capillary levelling. Finally, the samples are put in an oven. In our first experiments (data presented in figures 7, 9, 10 and 11), the samples were left in the oven for 1 h. The measured value of the Young's modulus of PDMS after baking was 1 MPa, with an increase of 20 % over one week. Later in the course of our study (data presented in figures 2–6, 12, 14 and 15), the samples were left in the oven for 24 h. The measured value of the Young's modulus was 2 MPa without significant drift over time. Data presented in figures 8 and 13 were obtained with both protocols. After curing of the PDMS, the samples are detached from the textured silicon wafer, and deposited gently by hand on a plasma-treated glass slide.
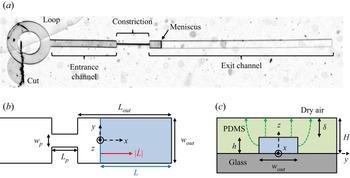
As represented in figure 1, our biomimetic vessel is composed of two channels: an entrance channel of length  $L_{{in}}=2$ mm, and an exit channel of length
 $L_{{out}}$ (varying between
 $900\ {\mathrm {\mu }}\mathrm {m}$ and
 $18$ cm), of respective widths
 $w_{in}=200\ {\mathrm {\mu }}\mathrm {m}$ and
 $w_{{out}}$ (varying between
 $100$ and
 $450\ {\mathrm {\mu }}\mathrm {m}$). The two channels have height
 $h$ (varying between
 $11$ and
 $100\ {\mathrm {\mu }}\mathrm {m}$), and are connected by a constriction of length
 $l_p = 1$ mm, width
 $w_{{p}}$ (varying between
 $5$ and
 $50\ {\mathrm {\mu }}\mathrm {m}$), and height
 $h$. The entrance channel is connected to a small circular loop, whose use is described below. The total thickness of the PDMS medium is
 $H$, which typically varies between
 $56$ and
 $154\ \mathrm {\mu }{\rm m}$ across experiments. The thickness of the PDMS membrane separating the top of the channels and the external air is denoted
 $\delta = H-h$ and varies between
 $10$ and
 $79\ \mathrm {\mu }{\rm m}$ across experiments. The ratio of length scales in the constriction
 $w_p/h$ thus varies between
 $0.15$ and
 $0.86$, while in the exit channel the ratio
 $h/w_{{out}}$ varies between
 $0.06$ and
 $0.45$.
(a) Snapshot of the channel, with its different elements. Sketch of the channel (not to scale): (b) top view (excluding the loop); (c) side view across the channel. The top view shows the constriction of length  $L_{{p}}$ and width
 $w_{{p}}$ inside the channel of width
 $w_{{out}}$. The exit channel, i.e. the channel portion after the constriction, has length
 $L_{{out}}$. A meniscus, depicted as a blue line across the channel, separates the water-filled part of the channel (right of the meniscus, blue shading in b) of length
 $L$ from the air-filled part (left of the meniscus). The velocity of the meniscus
 $|\dot {L}|$ is indicated with a red arrow in (b); the meniscus motion is due to the loss of water induced by a pervaporation flux across the PDMS, sketched by the green dashed arrows in (c).

The channels are initially full of air, and we fill them by water using the following procedure. With a scalpel, we create a wide cut inside the loop, enabling a direct connection between the channel entrance and the outside. The samples are then plunged in a tank of deionised water (resistance about  $18$ M
 $\Omega$) and put in a vacuum chamber for 2 h, such that water gradually replaces the air inside the microchannels. As soon as the channels are fully filled with water, they are placed either under a dry air flow at relative humidity
 ${RH} = 0$ supplied by a bottle of compressed air (Air Liquide), or in contact with the ambient atmosphere at which relative humidity is measured. A meniscus between water and air, initially present at the aforementioned cut, then invades the channel progressively due to water pervaporation through the PDMS.
2.2. Experiments and measurement methods
In order to record the global displacement of the embolism, we mounted a camera (Pike, from Allied Vision Technologies) on a microscope (magnification varying between  ${\times }3$ and
 ${\times }5$), and we recorded the position of the meniscus with an acquisition speed varying between 0.1 and 2.5 frames per second (fps). The position of the meniscus is then obtained by tracking the location of its apex
 $L(t)$, along the centreline of the channel, using the ‘reslice’ function of the free software ImageJ/Fiji.
In order to record the temporal evolution of the interface at the moment of the sudden jump, we mounted a high-speed camera (Phantom Miro M $310$) on a microscope (magnification varying between
 ${\times }6.4$ and
 ${\times }8$) with an acquisition speed varying between
 $400$ and
 $1000$ fps.
In preparation for confocal imaging of the channel cross-section, a mass of  $1$ mg of sulphorhodamine B (a fluorescent dye) was dissolved in 500 ml of deionised water. The solution was then used to fill our channels, following the protocol detailed in § 2.1. Fluorescent-water-filled microchannels were put under a laser-induced fluorescence confocal microscope (TCS SP8 from Leica Microsystems), and illuminated at wavelength
 $\lambda =561$ nm. We used a
 ${\times }40$ lens with immersion oil, connected to a photomultiplier in the wavelength range
 $[575,660]$ nm. The pixel size in our experiments was set at about
 $200$ nm. We performed
 $z$-scans of our samples of typical vertical steps
 $1\ \mathrm {\mu }{\rm m}$, thereby obtaining images of the channel cross-section (see figure 4b) every 22 s. These images (see figure 4b) were then analysed by standard image analysis techniques. As a word of caution, notice that sulphorhodamine accumulates at the channel boundary and defines a thick bright line, which limits the precision of the measurement of the cross-section and the channel thickness. In particular, we will see later (in § 3.3) that both these parameters are slightly overestimated, without consequences on their relative variations along time and space, which will be the quantities of interest.
3. Experimental description of the air-finger propagation
We start by considering a reference experiment, whose dynamics is representative of that of all other experiments presented in this paper. Its geometrical parameters are  ${L_{{out}} = 5.5}$ mm,
 $w_{{out}} = 390\ \mathrm {\mu }{\rm m}$,
 $w_{{p}} = 30\ \mathrm {\mu }{\rm m}$,
 $h = 65\ \mathrm {\mu }{\rm m}$ and
 $H = 95\ \mathrm {\mu }{\rm m}$. The time evolution of the water length
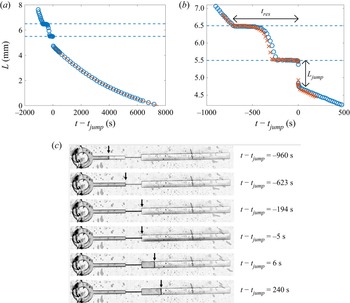
 $L$ is plotted in figure 2(a) in the full channel, and in figure 2(b) in the vicinity of the constriction. The data show sharp variations: the meniscus first advances at almost constant speed in the entrance channel, before reaching the constriction entrance, where it stops for about
 $200$ s. It then accelerates inside the constriction, before a second stop at the constriction exit, for about
 $250$ s. It then suddenly jumps forwards over a length
 $L_{{jump}}$ of about 1 mm inside the exit channel, at a time denoted
 $t_{{jump}}$, before recovering a smooth dynamics in the exit channel characterised by a progressive deceleration. We supply as supplementary material a movie showing the whole process, available at https://doi.org/10.1017/jfm.2022.733. We study this smooth dynamics in more detail in § 3.1, then focus on the constriction-induced sharp variations in § 3.2, and propose physical interpretations in §§ 3.3, 3.4, 3.5 and 3.6.
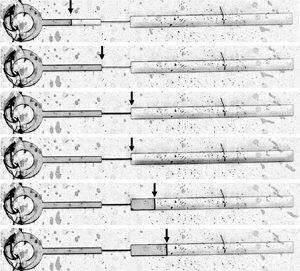
(a) Plot of the water length  $L$ as a function of time
 $t - t_{{jump}}$ in a channel of geometrical parameters
 $L_{{out}} = 5.5$ mm,
 $L_{{p}} = 1$ mm,
 $w_{{out}} = 390\ \mathrm {\mu }{\rm m}$,
 $w_{{p}} = 30\ \mathrm {\mu }{\rm m}$,
 $h = 65\ \mathrm {\mu }{\rm m}$ and
 $H = 95\ \mathrm {\mu }{\rm m}$, for relative humidity
 ${RH} = 0.25$. The time
 $t_{{jump}}$ is the instant where the meniscus abruptly jumps inside the exit channel. The curve is a fit after the jump by the truncated exponential law (3.1), with
 $\tau = 5.65 \times 10^3$ s and
 $L_g = 1.71$ mm as fitting parameters. (b) Zoom into the constriction of the experiment presented in (a) (
 $\circ$), and of a second realisation of the experiment (
 $\times$), recorded with a larger magnification. In (a,b), the two horizontal dashed lines highlight the location of the constriction. The total residence time of the meniscus in the constriction,
 $t_{res}$, and the jump length at the constriction exit,
 $L_{jump}$, are marked with arrows. (c) Snapshots of the full channel at various times. Arrows highlight the position of the meniscus separating the water-filled part of the channel (right of the meniscus) from its air-filled part (left of the meniscus).

3.1. A smooth dynamics in the absence of constriction
The smooth deceleration of the meniscus occurring after the jump in the exit channel echoes the pervaporation-induced drying dynamics in single channels of constant width studied by Dollet et al. (Reference Dollet, Louf, Alonzo, Jensen and Marmottant2019). Recall that this dynamics is driven by the loss of water within the channel due to pervaporation through the water-permeable PDMS walls. There are two contributions to the pervaporation flux  $Q$: a diffusion flux, denoted
 $Q_\ell$, from the water–PDMS interface, and an evaporative flux
 $Q_g$ at the meniscus. Since the length of the exit channel is much larger than its width, it is reasonable to neglect end effects on the diffusion flux and to assume that it is simply proportional to the water-filled length:
 $Q_\ell = q_\ell L$, with
 $q_\ell$ the diffusion flux per unit length of water-filled channel. Hence water conservation leads to
 $hw_{{out}} \dot {L} = -q_\ell L - Q_g$, from which the following truncated exponential dynamics is predicted:
 \begin{equation} L = (L_{{out}} -
L_{{jump}} + L_g) \exp[{-(t - t_{{jump}})/\tau}] - L_g ,
\end{equation}
using the initial condition  $L = L_{{out}} - L_{{jump}}$ at
 $t = t_{{jump}}$ just after the jump, and defining
 $\tau = hw_{{out}}/q_\ell$ and
 $L_g = Q_g/q_\ell$. Figure 2(a) confirms that such a truncated exponential fits remarkably well the meniscus dynamics in the exit channel. A similar dynamics is very probably at play also at the entrance channel, but the spatiotemporal range of this part of the dynamics is too narrow to allow significant fitting.
The two aforementioned fluxes  $q_\ell$ and
 $Q_g$ have been predicted in Dollet et al. (Reference Dollet, Louf, Alonzo, Jensen and Marmottant2019). First, we have
 \begin{equation} q_\ell = D_P \bar{c}_P^{{sat}} (1 - {RH})\,\tilde{q}_\ell(w_{{out}}) , \end{equation}
with  $D_P$ the diffusivity of water in PDMS,
 $\bar {c}_P^{{sat}} = 7.2 \times 10^{-4}$ the mass fraction of water in PDMS at saturation (see Chagua Encarnación et al. (Reference Chagua Encarnación, Marmottant and Dollet2021) for the numerical estimation of this parameter),
 $RH$ the relative humidity of the outer air, and
 $\tilde {q}_\ell$ the following dimensionless shape factor:
 \begin{equation} \tilde{q}_\ell(w) = \frac{w}{\delta} + \frac{2}{\rm \pi} \left\{ \ln \left[ \frac{(H + \delta)h}{\delta^2} \right] + \frac{H}{\delta} \ln \left( \frac{H + \delta}{h} \right) \right\} . \end{equation}
We also use the prediction
 \begin{equation} Q_g = \sqrt{\alpha D_a D_P hw_{{p}}\, \tilde{q}_\ell(w_{{out}})} , \end{equation}
with  $\alpha = 0.03$ the Henry constant quantifying the water affinity in PDMS (Harley, Glascoe & Maxwell Reference Harley, Glascoe and Maxwell2012), and
 $D_a = 2\times 10^{-5}\ {\rm m}^2\ {\rm s}^{-1}$ the diffusivity of water vapour in air.
3.2. A stop-and-go dynamics induced by the constriction
Figure 2(b) shows that the presence of the constriction modifies dramatically the drying dynamics as compared to the smooth dynamics encountered in channels of constant width (Dollet et al. Reference Dollet, Louf, Alonzo, Jensen and Marmottant2019). Moreover, the dynamics is also different to that studied in Chagua Encarnación et al. (Reference Chagua Encarnación, Marmottant and Dollet2021) for channels of slowly varying width, where the width variations were shown to induce variations of meniscus speed, but not the stick-slip-like motion (arrest followed by jump) evidenced in figure 2(b).
We must mention that some elements of this dynamics are not fully reproducible when the same experiment is run several times. Notably, the arrest times at the constriction entrance and exit, as well as the dynamics within the constriction, vary, as evidenced by the comparison of two different realisations of the experiment in figure 2(b). However, the occurrence of the jump at the constriction exit was always observed, and the jump length and arrest time both showed a good reproducibility (of the order of 10 %). The jump length is simply measured by eye on graphs like the one shown in figure 2(b), between the constriction exit and the recovery of a smooth dynamics. Although this method seems rough, the ‘bounds’ of the jump are well-defined enough that the absolute precision of the jump length remains at most 0.1 mm.
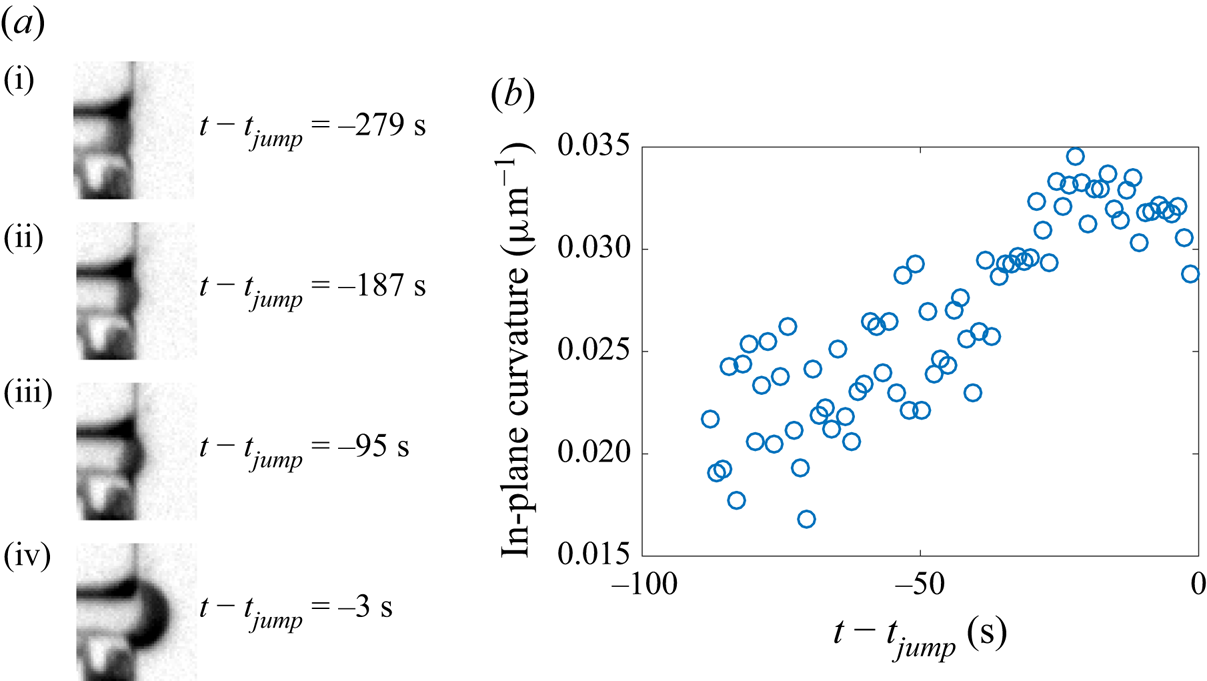
Figure 2 shows clearly that the meniscus arrests occur exactly at the entrance and at the exit of the constriction. This comes from the fact that the constriction corners are sharp enough to act as pinning sites. Moreover, the magnified snapshots of the meniscus in figure 3(a) show that the meniscus bulges out progressively during the arrest phase at the constriction exit. To quantify this observation, we fitted the meniscus by an arc of circle, and we plot in figure 3(b) the corresponding in-plane curvature as a function of time during the last 90 s before the jump (at earlier times, the meniscus is not curved enough for its curvature to be accurately measurable): although the measurement is somewhat noisy, this figure shows that the curvature increases and reaches a maximum just before the jump, of order  $0.035\ \mathrm {\mu }{\rm m}^{-1}$, which is very close to
 $1/w_{{p}} = 0.033\ \mathrm {\mu }{\rm m}^{-1}$. It is likely that such an increase of the meniscus curvature also happens during the arrest phase at the constriction entrance, but spatial resolution is too poor there to definitely confirm this fact.
(a) Snapshots of the meniscus at various times within the phase of arrest of the meniscus at the constriction exit; in particular, (i) is the first snapshot where the meniscus is pinned. (b) Plot of the in-plane curvature of the meniscus as a function of time at the end of the arrest phase.

While the meniscus gets arrested, drying is still proceeding, hence the volume of water in the channel is still decreasing. This suggests that the channel cross-section, in its water-filled part, must decrease during the arrest phases.
3.3. Confocal imaging of the deformation of the channel during the arrest phases
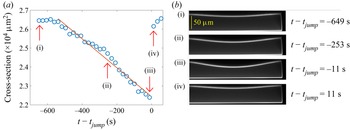
In order to test the hypothesis of a decrease of the cross-section during the arrest phases, we repeated the reference experiment using confocal microscopy to measure the time evolution of the cross-section. To avoid the end effects in the vicinity of the sharp width variation at the constriction exit, we measured the cross-section at a distance 3 mm ahead of the constriction exit. The corresponding data, displayed in figure 4(a), show that the cross-section is first roughly constant, then decreases, then increases very rapidly (within the 22 s separating two measurements of the cross-section) to recover the first plateau value. Comparing time scales in figures 2(b) and 4(a) suggests that the interface gets arrested at the constriction entrance about the same time that the cross-section starts decreasing. This variation is compatible with the aforementioned dynamics of the meniscus, and with a scenario of drying of the channel at fixed meniscus position (either at the constriction entrance, or at its exit), but decreasing cross-section, until a critical instant where the meniscus unpins at the constriction exit. A fast relaxation ensues, during which the channel quickly recovers its equilibrium cross-section, and where the meniscus jumps forwards at almost constant water volume (neglecting the duration of the jump with respect to the typical pervaporation time).
(a) Plot of the cross-section of the channel  $S$ as a function of time in a channel of geometrical parameters
 $L_{{out}} = 5.5$ mm,
 $L_{{p}} = 1$ mm,
 $w_{{out}} = 390\ \mathrm {\mu }{\rm m}$,
 $w_{{p}} = 30\ \mathrm {\mu }{\rm m}$,
 $h = 65\ \mathrm {\mu }{\rm m}$ and
 $H = 95\ \mathrm {\mu }{\rm m}$. The time here is defined with respect to the instant of the jump
 $t_{{jump}}$, assumed to be halfway between the times of the two images immediately before and after the jump. The straight line is a linear fit over the time interval where the cross-section decreases. Arrows with labels refer to the photographs displayed in (b) taken with the confocal microscope. (b) The boundary of the channel cross-section appears in light shade; notice that a tiny part of the cross-section is cut at the left of the photographs, owing to limitations of the horizontal field of view of the confocal microscope.

The confocal snapshots of figures 4(b,i,iv) show that the upper wall remains slightly bent inwards before the meniscus enters the constriction, and after the jump. This is a signature of a remanent Laplace pressure  $p_{{rem}}$ when the meniscus is in the entrance channel and in the exit channel: owing to the wetting conditions of water on PDMS and glass, the meniscus is curved towards the liquid phase (see figure 7b). Hence the water has a lower pressure than air, whence the remaining curvature of the upper wall. We will henceforth denote by
 $S_{{rem}}$ the corresponding cross-section, which is thus slightly smaller (of order 5 %) than the equilibrium cross-section
 $S_0 = hw_{{out}}$.
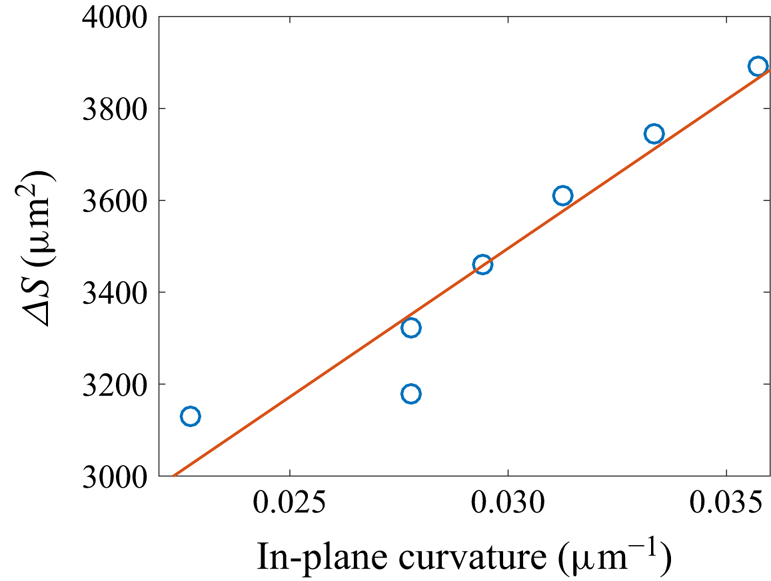
The data of figures 3(b) and 4(a) suggest that the curvature of the pinned meniscus varies in order for the Laplace pressure to accommodate the decrease in water pressure accompanying the cross-section reduction. To prove this correlation, we performed another experiment based on confocal microscopy, close enough to the constriction exit to track simultaneously the meniscus shape and the cross-section. Owing to the finite time resolution of the confocal scans, we cannot reconstruct reliably the three-dimensional structure of the meniscus, because it advances significantly between the bottom scan and the top scan. Hence we cannot measure reliably the out-of-plane (vertical) curvature of the meniscus, which is expected to be of the same order of magnitude as the in-plane (horizontal) curvature. Therefore, we content ourselves with a measurement of the in-plane curvature of the meniscus in the horizontal plane located midway between the bottom glass plate and the top PDMS channel wall. We plot in figure 5 the cross-section difference with respect to the undeformed case, defined as  $\Delta S = hw_{{out}} - S$, as a function of the in-plane curvature in the last moments of the arrest phase. This figure shows that except for an outlier, the two quantities are well correlated by an affine relation, thereby confirming our interpretation.
Plot of the cross-section difference of the channel  $\Delta S = hw - S$ as a function of the in-plane curvature
 $\kappa$ of the meniscus in a channel of geometrical parameters
 $L_{{out}} = 5.5$ mm,
 $L_{{p}} = 1$ mm,
 $w_{{out}} = 390\ \mathrm {\mu }{\rm m}$,
 $w_{{p}} = 30\ \mathrm {\mu }{\rm m}$,
 $h = 50\ \mathrm {\mu }{\rm m}$ and
 $H = 59\ \mathrm {\mu }{\rm m}$, for the last moments of the arrest phase. The line is an affine fit of the data
 $\Delta S = c_1 \kappa + c_2$, with fitting parameters
 $c_1 = 6.5 \times 10^4\ \mathrm {\mu }{\rm m}^3$ and
 $c_2 = 1.6 \times 10^3\ \mathrm {\mu }{\rm m}^2$.

Once the meniscus reaches its maximal possible curvature compatible with the geometrical constraints and the contact angles of water on PDMS and glass, the situation becomes unstable, because the Laplace pressure can no longer equilibrate the elastic deformation of the channel, and the meniscus advances rapidly until the channel is fully relaxed. The onset of the jump is therefore an occurrence of a capillary threshold, as encountered in the drainage of Newtonian fluids in porous media (Wilkinson & Willemsen Reference Wilkinson and Willemsen1983; Lenormand & Zarcone Reference Lenormand and Zarcone1985; Måløy, Feder & Jøssang Reference Måløy, Feder and Jøssang1985; Méheust et al. Reference Méheust, Løvoll, Måløy and Schmittbuhl2002), in the flow of foams in porous media (Géraud et al. Reference Géraud, Jones, Cantat, Dollet and Méheust2016), or in the pervaporation dynamics in an array of micropillars (Panizza et al. Reference Panizza, Algaba, Postic, Raffy, Courbin and Artzner2018). Hence the maximal deformation of the channel is correlated, through Laplace pressure, to the maximal curvature of the meniscus. Because of the finite roundness of the corners at the constriction exit, the meniscus shape is a complicated surface, which prevents us from predicting the maximal curvature. However, its order of magnitude is  $1/w_{{p}}$ (figure 3b), as would be expected for a two-dimensional meniscus pinned on sharp corners, whose maximal possible curvature equals
 $2/w_{{p}}$ when it has the shape of a half-circle.
3.4. An elasto-capillary interaction between the meniscus and the channel structure
We will now analyse the full shape of the channel upper wall as seen in figure 4(b). In that experiment, the upper wall has thickness  $\delta = 30\ \mathrm {\mu }{\rm m}$ and width
 $w_{{out}} = 390\ \mathrm {\mu }{\rm m}$. Hence it is quite slender, and we may compare its deflection to that of a thin beam. The conditions at the boundaries of the upper wall are complex because it is attached to a thicker part of the same material; for the sake of simplicity, we simply assume clamped end conditions, as in other works (Christov et al. Reference Christov, Cognet, Shidhore and Stone2018; Martínez-Calvo et al. Reference Martínez-Calvo, Sevilla, Peng and Stone2020). The deflection of the upper wall is then predicted to be (Landau & Lifshitz Reference Landau and Lifshitz1986)
 \begin{equation} \zeta = \frac{\Delta P}{24B} \left( y^2 - \frac{1}{4}\,w_{{out}}^2 \right)^2 , \end{equation}
with  $\Delta P$ the pressure difference between the water in the channel and the atmosphere; here,
 $\Delta P < 0$, hence
 $\zeta < 0$, corresponding to an inwards deflection of the upper wall. The parameter
 $B = E\delta ^3/[12(1 - \nu ^2)]$ is the bending stiffness of the upper wall, with
 $\nu$ the Poisson ratio of PDMS, for which take the value
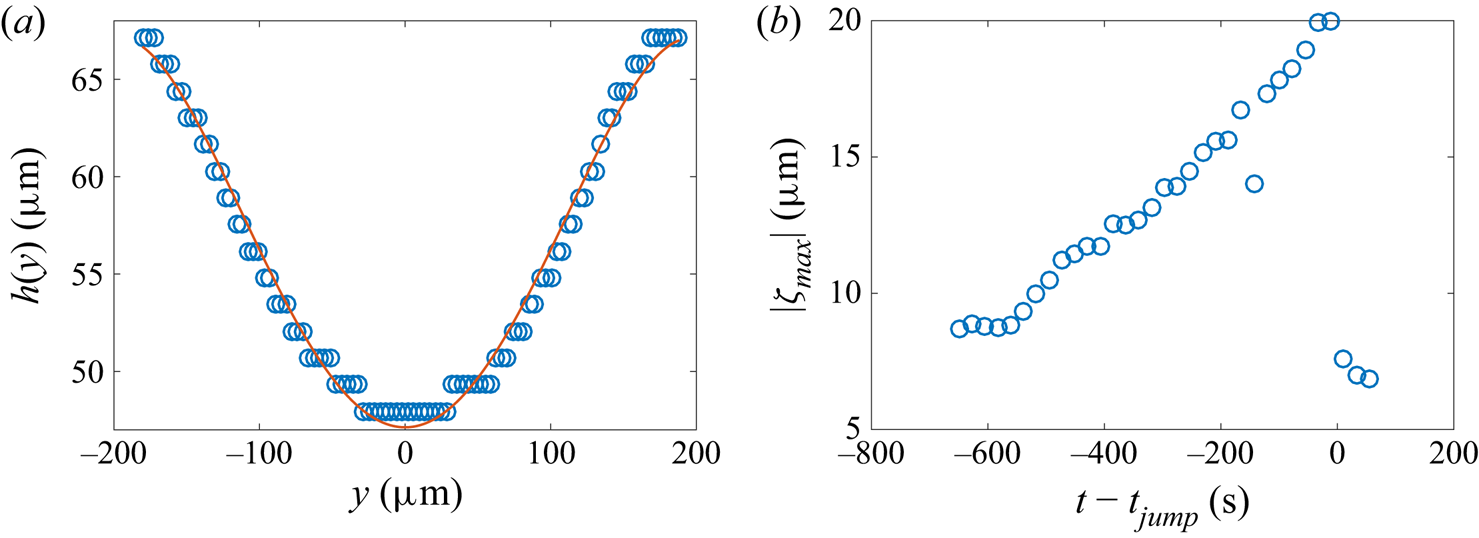
 $\nu = 0.5$ with a good precision (Johnston et al. Reference Johnston, McCluskey, Tan and Tracey2014). To test this prediction, we fit the deflection measured on the last confocal photograph before the jump (figure 4b,iii). Figure 6(a) shows good agreement between the data point and the predicted deflection. We checked that the agreement remains good on the other confocal photographs, and we plot the maximal deflection
 $|\zeta _{max}| = |\Delta P|{w_{{out}}^4}/(384B)$, reached at the middle of the upper wall, as a function of time in figure 6(b). It increases linearly with time, before a sudden relaxation after the jump. Moreover, from the maximal deflection obtained just before the jump, we get the numerical value:
 $(1 - \nu ^2)\,\Delta P/E = 1.0 \times 10^{-3}$. Taking
 $E = 2$ MPa as the Young's modulus of the PDMS (see § 2.1), this estimate means that
 $|\Delta P|$ reaches 2 kPa just before the jump. This estimate agrees with the order of magnitude of the capillary threshold: from figure 3(b), the maximal in-plane curvature of the meniscus is about
 $1/w_{{p}}$, whence a maximal Laplace pressure of order
 $\gamma /w_{{p}} = 2$ kPa, where
 $\gamma = 7\times 10^{-2}\ {\rm kg}\ {\rm s}^{-2}$ is the surface tension of water.
(a) Plot of the local thickness  $h(y)$ of the channel from photograph (iii) in figure 4(b) as a function of the spanwise coordinate
 $y$; the staircase-like rendering of the data points is due to the limited spatial resolution of the confocal microscope. The curve is a fit by the formula
 $h(y) = h{_0} - |\zeta _{max}|\,(1 - 4y^2/w_{{out}}^2){^2}$, with
 $|\zeta _{max}|$ a free fitting parameter, here equal to
 $20.0\ \mathrm {\mu }{\rm m}$. (b) Plot of
 $|\zeta _{max}|$ as a function of time.

3.5. Influence of surface tension
The experiments were also carried out using ethanol as the liquid. Similar jumps were observed, characterised by length  $L_{{jump}\ ({ethanol})}$. When comparing
 $L_{{jump}\ ({ethanol})}$ with the jump length
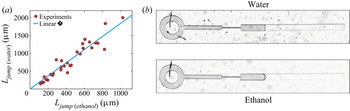
 $L_{{jump} ({water})}$ obtained with water in the same geometry, we observe that the jump is systematically shorter with ethanol than with water, as represented in figure 7(a). Experimental data are well adjusted by the linear relationship
 $L_{{jump}\ ({water})}=1.84\:L_{{jump}\ ({ethanol})}$.
(a) Plot of the length of the jump obtained with water  $L_{{jump}\ ({water})}$ as a function of the length of the jump obtained with ethanol
 $L_{{jump}\ ({ethanol})}$ in channels with various geometrical parameters. The straight line corresponds to the best linear fit
 $L_{{jump}\ ({water})} = 1.84\:L_{{jump}\ ({ethanol})}$. (b) Two photographs of the air embolism present in the exit channel (
 $w_{{out}}=330\ \mathrm {\mu }{\rm m}$,
 $h=53\ \mathrm {\mu }{\rm m}$,
 $H=90\ \mathrm {\mu }{\rm m}$), for both water (top) and ethanol (bottom). The interface curvature between air (at the left) and liquid (at the right) is markedly larger for ethanol than for water, due to a better wettability.

This good linear correlation agrees with our scenario involving a capillary threshold, itself proportional to surface tension. However, the prefactor 1.84 is about twice smaller than the surface tension ratio between water and ethanol, which equals 3.3 (taking  $22\ {\rm mN}\ {\rm m}^{-1}$ for the surface tension of ethanol). Two main reasons may explain this discrepancy. First, the maximal curvature of the meniscus is larger for ethanol than for water due to better wetting conditions, as shown on the two comparative pictures of figure 7(b); hence the ratio of maximal Laplace pressure at the capillary threshold is smaller than the ratio of surface tension. More precisely, since ethanol seems to be in perfect wetting conditions in the snapshot of figure 7(b), the maximal in-plane curvature of the meniscus may reach
 $2/w_{{p}}$ in the constriction (although spatial resolution is too limited to measure it accurately), which is twice that measured with water (figure 3b). Second, in our experiments, the surface tension of water might be smaller than that of pure water, due to pollution of the interface by the extraction of the uncrosslinked PDMS chains. Indeed, Hourlier-Fargette et al. (Reference Hourlier-Fargette, Antkowiak, Chateauminois and Neukirch2017) showed that the surface tension of water droplets could drop to
 $52\ {\rm mN}\ {\rm m}^{-1}$ in the presence of such pollution.
3.6. Volume conservation during the jump
The characteristic time scale of the jump, varying between 0.1 and 2 s depending on the experiments, is systematically much smaller than the characteristic time scale of pervaporation  $\tau _{{perv}} = w_{{out}}/|\dot {L}|$ (with
 $|\dot {L}|$ the interface speed just after the jump), which is itself of order
 $10^3$–
 $10^4$ s. We can thus consider that the volume of liquid is conserved during the jump, which implies that
 $S_{min} L_{{out}} = S_{{rem}} (L_{{out}} - L_{{jump}})$, with
 $S_{min}$ the cross-sectional area just before the jump. Hence
 \begin{equation} \frac{L_{{jump}}}{L_{{out}}} = \frac{\Delta S}{S_{{rem}}} , \end{equation}
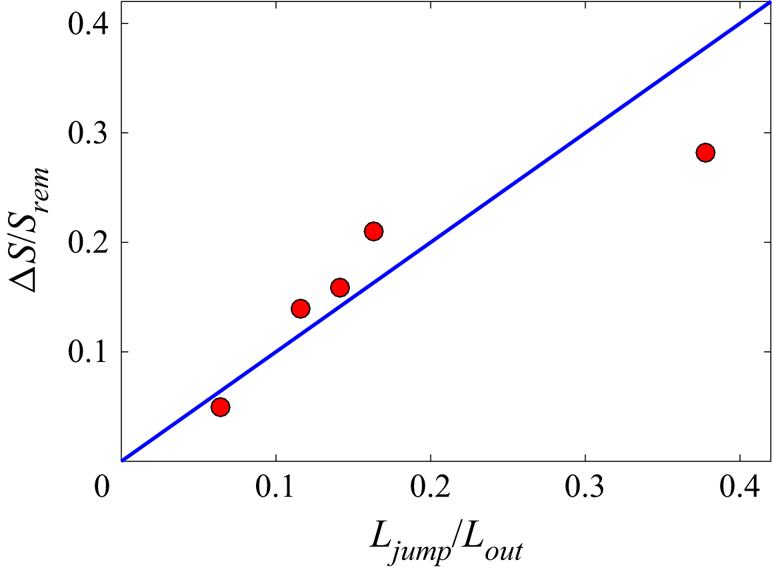
where  $\Delta S = S_{{rem}}-S_{min}$. For a few experiments, we compared the confocal measurements of relative deformation of the channel before and after the jump,
 $\Delta S/S_{{rem}}$, with the relative amplitude of the jump
 $L_{{jump}}/L_{{out}}$ measured from macroscopic observations realised with the same channels a few days after the confocal imaging experiments. Figure 8 shows that the data are compatible with this scenario of volume conservation during the jump, within a certain margin of error due to the confocal imaging resolution and the relative reproducibility of
 $L_{{jump}}$ discussed earlier.
Plot of the relative deformation  $\Delta S/S_{{rem}}$ observed by confocal imaging, compared to the relative amplitude of the jump
 $L_{{jump}}/L_{{out}}$ measured in a second round of experiments with macroscopic observations (red circles). The blue line represents the conservation of water volume during the jump (see (3.6)).

4. Effect of geometrical parameters on jump length and arrest time
The results shown in § 3 point with good confidence towards the following scenario. The meniscus gets pinned at the constriction corners for a certain time. During this arrest phase, the ongoing drying induces a decrease of the channel cross-section, hence a decrease of the water pressure, and bending of the upper wall. Due to Laplace pressure, this increases the in-plane curvature of the meniscus until a capillary threshold, where a sudden relaxation occurs; the cross-section recovers quickly its equilibrium value, and the meniscus jumps forwards quickly. In this section, we reinforce the validity of the depicted mechanism by evidencing the influence of the geometrical parameters of the channel (length  $L_{{out}}$, width
 $w_{{out}}$, membrane thickness
 $\delta$, and constriction width) on the length of the jump
 $L_{{jump}}$ (§§ 4.1, 4.2 and 4.3) and the time of residence in the constriction
 $t_{{res}}$ (§ 4.4).
4.1. The jump length  $L_{{jump}}$ is proportional to the channel length $L_{{out}}$


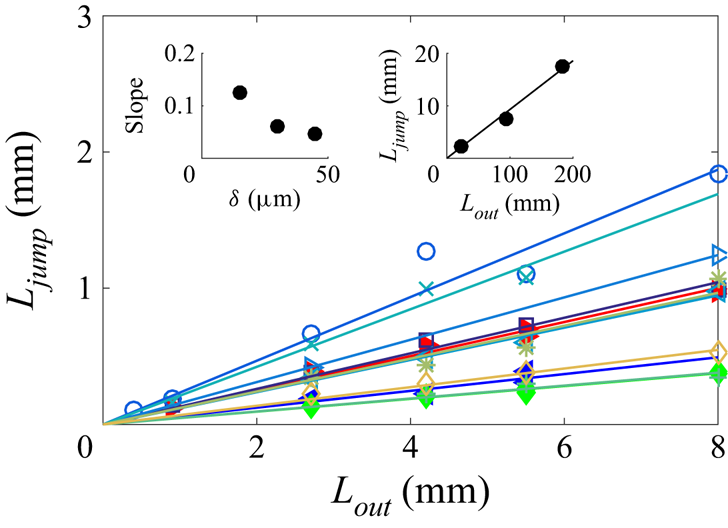
We first report measurements of the jump length as a function of the length of the exit channel, for various experiments, in figure 9. It confirms the argument of water volume conservation during the jump (§ 3.6), namely that the jump length is simply proportional to the length of the exit channel with an excellent correlation. Moreover, the left-hand inset of figure 9 shows that at given exit channel width and channel height, the coefficient of proportionality decreases at increasing upper wall thickness. This proportionality also holds in much longer exit channels (right-hand inset of figure 9).
Plot of the jump length  $L_{{jump}}$ as a function of the length of the exit channel
 $L_{{out}}$. Filled symbols are for fixed values of both the exit channel width
 $w_{{out}} = 300\ \mathrm {\mu }{\rm m}$ and channel height
 $h = 65\ \mathrm {\mu }{\rm m}$, and for three values of the upper wall thickness:
 $\delta = 15\ \mathrm {\mu }{\rm m}$ (
 $\blacktriangleright$),
 $30\ \mathrm {\mu }{\rm m}$ (
 $\blacktriangleleft$) and
 $45\ \mathrm {\mu }{\rm m}$ (
 $\blacklozenge$). Other symbols are for fixed channel width
 $w_{{out}} = 300\ \mathrm {\mu }{\rm m}$, and for pairs of values of
 $h,{\delta }$ in
 $\mathrm {\mu }{\rm m}$: 53, 37 (
 $\square$); 44, 34 (
 $\circ$); 53, 26 (
 $\triangleright$); 65, 34 (
 $\triangleleft$); 44, 20 (
 $\times$); 100, 54 (
 $+$); 53, 323 (
 $*$); 53, 52 (
 $\lozenge$). Straight lines are the best linear fits of the each series of data. The left-hand inset shows the best fitting slope as a function of
 $\delta$ for fixed values of both the exit channel width
 $w_{{out}} = 300\ \mathrm {\mu }{\rm m}$ and channel height
 $h = 65\ \mathrm {\mu }{\rm m}$. The right-hand inset is a plot of the jump length
 $L_{{jump}}$ as a function of the length of the exit channel
 $L_{{out}}$ in long channels of width
 $w_{{out}} = 350\ \mathrm {\mu }{\rm m}$, for
 $h = 67\ \mathrm {\mu }{\rm m}$ and
 $H = 111\ \mathrm {\mu }{\rm m}$.

The proportionality between the jump length and the length of the exit channel has been interpreted in § 3.6. To make the discussion more complete, it is worth noticing that the quantity  $\Delta S$ appearing in (3.6) depends on the channel compliance and the capillary threshold. Neither of these two quantities depends on
 $L_{{out}}$; the compliance depends on
 $w_{{out}}$,
 $h$ and
 ${\delta }$, while the capillary threshold depends on
 $h$ and
 $w_{{p}}$. This further explains the proportionality between the jump length and the length of the exit channel.
4.2. Effect of the channel compliance on the jump length
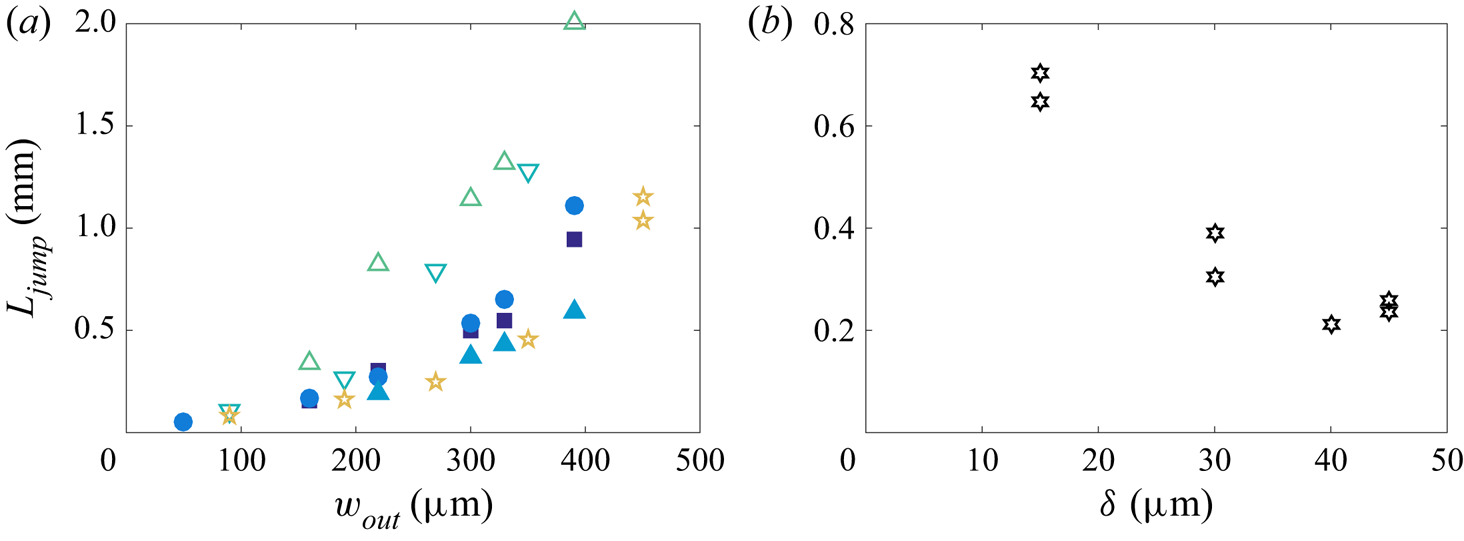
In order to quantify the effect of the channel compliance, we measured the jump length as a function of the width and height of the channel, and of the upper wall thickness, for various experiments where the length of the exit channel is fixed. We show the influence of the channel width  $w_{{out}}$ in figure 10(a), and that of the upper wall thickness in figure 10(b). Figure 10(a) shows that for each pair
 $(h,{\delta })$, the jump length increases at increasing channel width, with a convex trend. Figure 10(b) shows that at given channel width and height, the jump length decreases at increasing upper wall thickness.
(a) Plot of the jump length  $L_{{jump}}$ as a function of the width of the exit channel
 $w_{{out}}$ in channels of length
 $L_{{out}} = 5.5$ mm, for fixed channel height
 $h = 53\ \mathrm {\mu }{\rm m}$ and upper wall thickness
 ${\delta = 32\ \mathrm {\mu }{\rm m}}$ (
 $\blacksquare$),
 ${37}\ \mathrm {\mu }{\rm m}$ (
 $\bullet$) and
 ${52}\ \mathrm {\mu }{\rm m}$ (
 $\blacktriangle$), and fixed upper wall thickness
 $\delta = 34.5 1\ \mathrm {\mu }{\rm m}$ and channel height
 $h = 35\ \mathrm {\mu }{\rm m}$ (
 $\triangledown$),
 $44\ \mathrm {\mu }{\rm m}$ (
 $\triangle$),
 $53\ \mathrm {\mu }{\rm m}$ (
 $\bullet$) and
 $60\ \mathrm {\mu }{\rm m}$ (
 $\star$). (b) Plot of the jump length
 $L_{{jump}}$ as a function of the upper wall thickness
 $\delta$, at fixed values of the length of the exit channel
 $L_{{out}} = 5.5$ mm, width of the exit channel
 $w_{{out}} = 300\ \mathrm {\mu }{\rm m}$, and channel height
 $h = 65\ \mathrm {\mu }{\rm m}$.

The dependence of the jump length on the channel width and upper wall thickness may be rationalised in terms of the hydraulic capacitance of the channel, a concept used frequently in hydraulics of plants (Brodribb et al. Reference Brodribb, Holbrook, Zwieniecki and Palma2005) and in microfluidics (Bruus Reference Bruus2008). In a compliant channel, the hydraulic capacitance  $C_h$ links the incoming flux of fluid
 $Q_f$ to the temporal variation of pressure, through the relation
 $Q_f = C_h \,\mathrm {d}\Delta P/\mathrm {d}t$. Writing
 $Q_f = \mathrm {d}V_{{channel}}/\mathrm {d}t$, with
 $V_{{channel}}$ the volume of the channel, we get
 \begin{equation} C_h = \frac{\mathrm{d}V_{{channel}}}{\mathrm{d}\Delta P} = L_{{out}}\,\frac{\Delta S}{\Delta P} , \end{equation}
where  $\Delta S$ is computed readily from the thin beam approach that was used in § 3 to describe the deflection of the upper wall. From (3.5) and (3.6), we get
 \begin{equation} \Delta S = \int_{{-}w_{{out}}/2}^{w_{{out}}/2} \zeta \, \mathrm{d} y = \frac{w_{{out}}^5\,\Delta P}{720B} , \end{equation}
whence  $C_h = L_{{out}} w_{{out}}^5/(720B) = L_{{out}} w_{{out}}^5 (1 - \nu ^2)/(60\delta ^3 E)$. Therefore, using (3.6), we get the prediction
 \begin{equation} \frac{L_{{jump}}}{L_{{out}}} \simeq \frac{1}{hw_{{out}}}\,C_h\,\Delta P \simeq \frac{w_{{out}}^4}{60\delta^3 h}\,\frac{(1 - \nu^2)\,\Delta P}{E} , \end{equation}
neglecting the difference between  $S_0$ and
 $S_{{rem}}$ (see the mention of remanent pressure in § 3.3). Hence the jump length is predicted to be an increasing function of the channel width and a decreasing function of the upper wall thickness, in qualitative agreement with figure 10. The relation (4.3) also shows that the ratio
 $L_{{jump}}/L_{{out}}$ should be proportional to the product of the geometrical dimensionless parameter
 $w_{{out}}^4/(60E\delta ^3 h)$, which quantifies the ability of the channel to deform under a given load, and of
 $(1 - \nu ^2)\,\Delta P/E$. The latter quantity was shown to equal
 $10^{-3}$ in § 3.4 for
 $E = 2$ MPa. However, the data considered here have a lower modulus,
 $E = 1$ MPa (see § 2.1), hence
 $(1 - \nu ^2)\,\Delta P/E = 2 \times 10^{-3}$. Since the constriction width
 $w_{{p}}$ remains fixed for this data set, we expect the capillary threshold setting the pressure difference
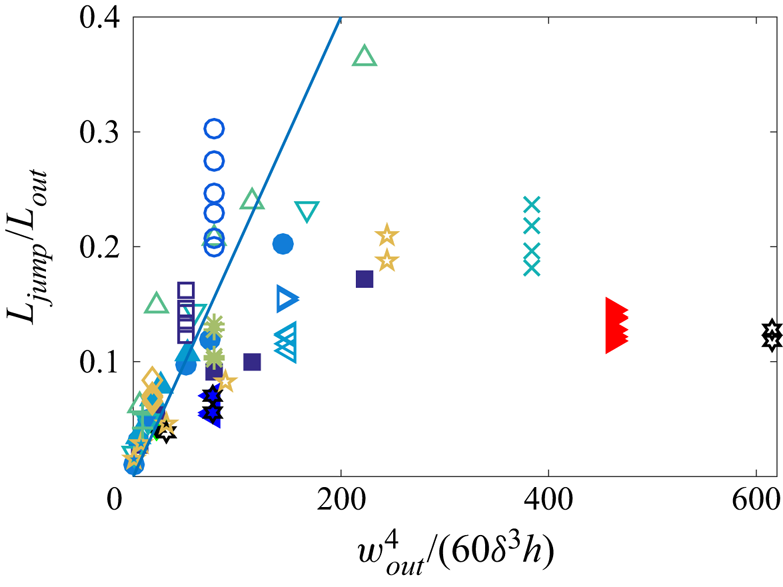
 $\Delta P$ not to vary much between all those experiments. Hence we plot in figure 11 the ratio
 $L_{{jump}}/L_{{out}}$ as a function of
 $w_{{out}}^4/(60E\delta ^3 h)$, with the straight line of slope
 $10^{-3}$, gathering all data from figures 9 and 10. It shows that (4.3) gives a good trend and a good order of magnitude for the jump length as a function of parameters setting the channel compliance, but with a large dispersion. We can evoke several reasons for the limited rescaling of the data. (i) The ratio
 $\delta /w_{{out}}$ is not much smaller than 1, hence the thin beam theory is only approximate in our experimental conditions. (ii) The clamped end conditions are also approximate, because the bulk of PDMS to which the upper wall is attached is of course not infinitely rigid and may deform. (iii) The capillary threshold may also vary, because it is sensitive to the details of geometry of the constriction exit. Indeed, because of the limited precision of the microfabrication process, the exit corners are not sharp but blunt, with a radius of curvature that may differ between channels. (iv) Some uncontrolled pre-stress may be present in the PDMS thin sheets after their manual deposition on the glass slides. Actually, a close look at the snapshots of figure 2(c) reveals that the channels are very slightly curved, suggesting that the PDMS has a small residual pre-stretch. (v) The levelling of the PDMS liquid film over the textures of the silicon wafer after spin coating may be incomplete. This could lead to a significant uncertainty on the estimation of the PDMS thickness
 $H$ in the vicinity of the channel, hence on the upper wall thickness
 $\delta$. In particular, the data points lying farthest below the line in figure 11 are those for which the measured values of
 $\delta$ are smallest, suggesting that our measurements underestimate the lowest values of
 $\delta$.


4.3. Influence of the constriction width
Using channels of various constriction widths  $w_{{p}}$, we now discuss the influence of the minimal radius of curvature of the interface past the constriction. The mechanism described earlier accounts for a deformation of the channel induced by the Laplace depression in the liquid, itself generated by the strong curvature of the interface in the constriction. It is thereby expected that the jump would be larger for stronger curvature, i.e. for smaller
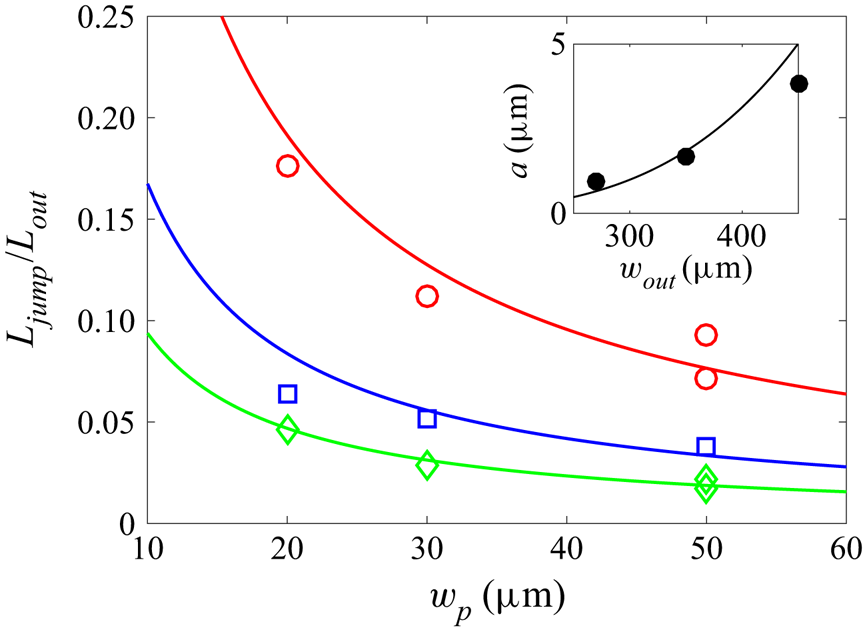
 $w_{{p}}$. Figure 12 shows three different set of measurements, for three different channel widths
 $w_{{out}}$. It shows that the length of the jump
 $L_{{jump}}$ decreases systematically as the width of the constriction increases, in agreement with the physical mechanism proposed in the previous subsection. Although the minimal radius of curvature of the interface is not exactly
 $w_{{p}}/2$ due to the finite angle of the constriction exit (figure 3), data are compatible with inverse power laws (solid lines in figure 12) deriving from (4.3) with
 $\Delta P \approx -\gamma /w_{{p}}$.
Plot of the ratio  $L_{{jump}}/L_{{out}}$ as a function of the constriction width
 $w_{{p}}$ for three different channel widths:
 $w_{{out}} = 270\ \mathrm {\mu }{\rm m}$ (
 $\lozenge$),
 $350\ \mathrm {\mu }{\rm m}$ (
 $\square$) and
 $450\ \mathrm {\mu }{\rm m}$ (
 $\circ$), with
 $h=67\ \mathrm {\mu }{\rm m}$,
 $H=95\ \mathrm {\mu }{\rm m}$ and
 $L_{{out}}=11$ or
 $22$ mm. The straight lines correspond to the best inverse fits:
 $L_{{jump}}/L_{{out}} = a/w_{{p}}$, with
 $a$ a fit parameter. Inset: plot of
 $a$ as a function of
 $w_{{out}}$. The curve is the best fit by the formula
 $a = cw_{{out}}^4$, with
 $c = 1.2 \times 10^{-10}\ \mathrm {\mu }{\rm m}^{-3}$ as best fitting parameter.

To be more quantitative, inserting the order of magnitude  $\Delta P = \gamma /w_p$ in (4.3) yields
 $L_{{jump}}/L_{{out}} = a/w_{{p}}$, with
 $a = cw_{{out}}^4$, where
 \begin{equation} c = \frac{1 - \nu^2}{E}\,\frac{\gamma}{60\delta^3 h} , \end{equation}
which equals  $c = 3.0 \times 10^{-10}\ \mathrm {\mu }{\rm m}^{-3}$ with the experimental values of the various parameters. To test this prediction, we plot
 $a$ as a function of
 $w_{{out}}$ in the inset of figure 12, and we fit by the law
 $a = cw_{{out}}^4$. Although the agreement is not perfect, the trend is correct, and we obtain
 $c = 1.2 \times 10^{-10}\ \mathrm {\mu }{\rm m}^{-3}$ as best fitting parameter, which is the correct order of magnitude compared to the theoretical estimation. Hence although the comparison is limited by the small range of parameters
 $w_p$ and
 $w_{{out}}$, and by the experimental biases mentioned in § 4.2, it tends to confirm the elasto-capillary nature of the jump.
4.4. Residence time within the constriction $t_{{res}}$

Another experimental quantity of interest is the total residence time of the meniscus inside the constriction,  $t_{{res}}$ (shown in figure 2b), which echoes the time of retention of an air embolism in a tree before propagation in the neighbouring vessel. During this time, the volume of water that leaves the channel by pervaporation is the sum of the volume
 $hw_{{p}} L_{{p}}$ of the constriction and the volume
 $L_{{out}}\,\Delta S = L_{{jump}} S_{{rem}}$. The latter contribution comes from our interpretation of the jump length in terms of water conservation leading to the relation (3.6). Hence the residence time inside the constriction should be
 $t^* = (L_{{jump}} S_{{rem}} + hw_{{p}} L_{{p}})/Q$, with
 $Q$ the water flux leaving the channel. For simplicity, we neglect the flux from the water-filled part of the constriction. Therefore, according to the predictions of Dollet et al. (Reference Dollet, Louf, Alonzo, Jensen and Marmottant2019) recalled in § 3.1, the water flux equals
 $Q = q_\ell L_{{out}} + Q_g$, with
 $q_\ell$ the diffusion flux per unit length along the exit channel, and
 $Q_g$ the evaporation flux at the meniscus. We thus get the prediction
 \begin{equation} t^* = \frac{L_{{jump}} S_{{rem}} + hw_{{p}} L_{{p}}}{q_\ell L_{{out}} + Q_g} , \end{equation}
with  $q_\ell$ given by (3.2), and where, from (3.4),
 $Q_g = \sqrt {\alpha D_a D_P hw_{{p}}\,\tilde {q}_\ell (w_{{p}})}$. The latter flux
 $Q_g$ depends on the dimensions of the channel upstream of the meniscus, whence the dependence on the constriction width
 $w_{{p}}$, and not on the exit channel, in the factor
 $\tilde {q}_\ell$.
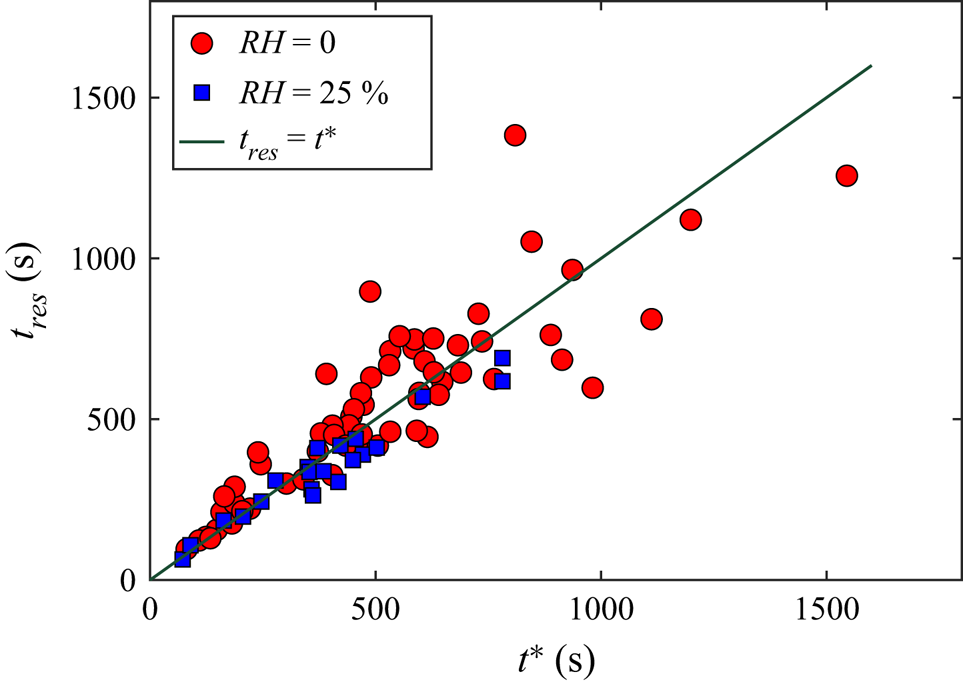
In figure 13, we plot the residence time inside the constriction as a function of  $t^*$ calculated using (4.5), where
 $D_P$ is adjusted so that the condition
 $t_{{res}} = t^*$ is best fulfilled. We thus find
 $D_P = 5.5 \times 10^{-10}\ {\rm m}^2\ {\rm s}^{-1}$. With this fitting value, figure 13 shows indeed a good correspondence between the two times
 $t_{{res}}$ and
 $t^*$. Furthermore, the order of magnitude of the aforementioned value of
 $D_P$ agrees with the value
 $10^{-9}\ {\rm m}^2\ {\rm s}^{-1}$ reported in the literature (Watson & Baron Reference Watson and Baron1996). Notice that none of the physicochemical parameters
 $D_P$,
 $\bar {c}_P^{{sat}}$ and
 $\alpha$ encountered in the expressions (3.3) and (3.4) for the fluxes is known with great precision. Hence the fact that
 $t_{{res}}$ and
 $t^*$ are found to be equal with reasonable values of these physicochemical parameters tends to confirm our interpretation of the residence time as the time required to pervaporate the water until the capillary threshold is reached.
Plot of the residence time of the meniscus inside the constriction  $t_{{res}}$ as a function of the time
 $t^*$ evaluated from (4.5) (taking
 $S_{{rem}} = hw_{{out}}$); the value
 $D_P = 5.5 \times 10^{-10}\ {\rm m}^2\ {\rm s}^{-1}$ has been taken for the diffusivity of PDMS in water appearing in (3.2) and (3.4). Data correspond to different relative humidities:
 ${RH}=0\,\%$ (red circles) and
 ${RH}=25\,\%$ (blue squares). The straight line corresponds to the equality
 $t_{{res}} = t^*$.

5. Relaxation dynamics following the jump
5.1. Description of the dynamics
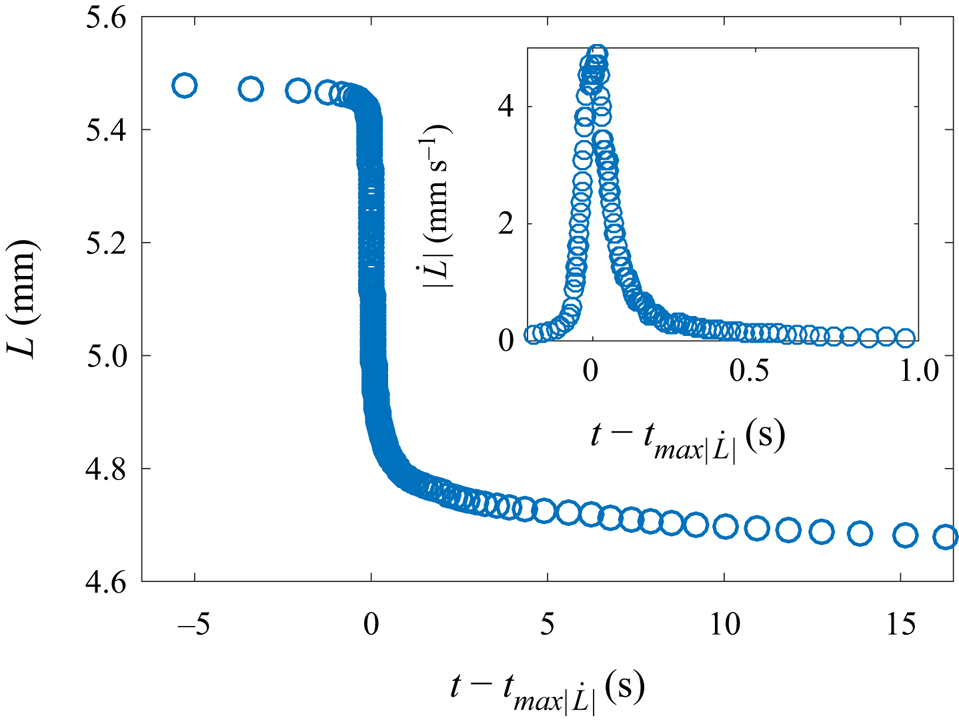
We also studied the dynamics of the meniscus during the jump, by repeating the reference experiment studied in detail in § 3, using a high-speed camera. We supply as supplementary material a movie showing the jump and the subsequent relaxation. The water length is plotted as a function of time in figure 14, where an estimation of the instantaneous velocity of the meniscus  $|\dot {L}|$ during the fastest phase is plotted as an inset. This figure shows that the acceleration at the beginning of the jump phase is larger than the deceleration at the end of this phase. The maximal velocity is
 $5\ {\rm mm}\ {\rm s}^{-1}$, which is three orders of magnitude larger than the typical speeds of the meniscus in the entrance channel and in the exit channel after the jump (figure 2a). This experiment also confirms the good repeatability of the jump length.
Plot of the water length  $L$ as a function of time
 $t - t_{max|\dot {L}|}$ in a channel of geometrical parameters
 $L_{{out}} = 5.5$ mm,
 $L_{{p}} = 1$ mm,
 $w_{{out}} = 390\ \mathrm {\mu }{\rm m}$,
 $w_{{p}} = 30\ \mathrm {\mu }{\rm m}$,
 $h = 65\ \mathrm {\mu }{\rm m}$ and
 $H = 95\ \mathrm {\mu }{\rm m}$. Inset: plot of the corresponding meniscus velocity
 $|\dot {L}|$ as a function of time in the fastest phase. The time
 $t_{max|\dot {L}|}$ is the instant where the velocity reaches its maximal value.

5.2. Physical discussion
First, it is important to note that the dynamics of the jump (characteristic time scale smaller than  $1$ s) is much faster than the pervaporation dynamics (characteristic time scale about
 $1000$ s). This confirms that we can neglect the mass loss by pervaporation in the analysis, and consider a constant water volume in the channel throughout the process of the jump.
It is interesting to compare the relaxation dynamics observed in figure 14 to the recent theoretical work by Martínez-Calvo et al. (Reference Martínez-Calvo, Sevilla, Peng and Stone2020), who studied start-up flows in shallow deformable channels by imposing an initial jump in pressure or in flow rate, and predicted the subsequent dynamics. The corresponding transient flow followed unsteady lubrication theory, with negligible liquid inertia, and the upper wall was modelled by a thin plate under pure bending with clamped end conditions. Our experimental conditions are suited for the comparison. First, we proved that the channel upper wall behaves reasonably well as a thin plate bent by the pressure difference between the liquid and the outer atmosphere (figure 6). Second, our channel geometry reasonably fulfils the conditions  $h \ll w_{{out}} \ll L_{{out}}$ assumed by Martínez-Calvo et al. (Reference Martínez-Calvo, Sevilla, Peng and Stone2020). Third, liquid inertia is indeed negligible, as can be checked by evaluating the dimensionless parameter
 $\varepsilon \,{Re} = \rho h^4 p_c/(12\eta ^2 L_{{out}}^2)$, where
 $p_c$ is the initial pressure jump. We have shown in § 3 that
 $p_c \approx \gamma /w_{{p}} = 2$ kPa, which leads to the numerical estimate
 $\varepsilon \,{Re} = 10^{-1}$, showing that inertia remains a secondary correction and that lubrication theory holds in good approximation. Fourth, the inertia of the top wall can be neglected safely; Martínez-Calvo et al. (Reference Martínez-Calvo, Sevilla, Peng and Stone2020) showed that the corresponding condition is that the dimensionless parameter defined by
 $\tilde {\gamma } = 3600\rho _s \delta h^6 B/(\eta ^2 L_{{out}}^2 w_{{out}}^4)$, where
 $\rho _s = 1.0 \times 10^3\ {\rm kg}\ {\rm m}^{-3}$ is the density of the solid, must be much smaller than 1. Numerical estimation with our parameters leads to
 $\tilde {\gamma } = 7 \times 10^{-8}$.
Within such hypotheses, in the model of Martínez-Calvo et al. (Reference Martínez-Calvo, Sevilla, Peng and Stone2020), the pressure in the channel relaxes following a nonlinear diffusion dynamics, the nonlinearity coming from the dependence of the hydrodynamic resistance on the channel cross-section. In our study, by virtue of the kinematic boundary condition and the lubrication equations, the meniscus velocity is proportional to the pressure gradient of the liquid in contact with the meniscus. Hence the temporal dynamics of the meniscus velocity can be compared to that of the pressure in the model of Martínez-Calvo et al. (Reference Martínez-Calvo, Sevilla, Peng and Stone2020). In this comparison, the key quantity to estimate is the relaxation time of the diffusion dynamics. After a self-similar short-time regime, the long-time regime is an exponential relaxation with characteristic time
 \begin{equation} t_r = \frac{\eta w_{{out}}^4 L_{{out}}^2}{60h^3 B}; \end{equation}
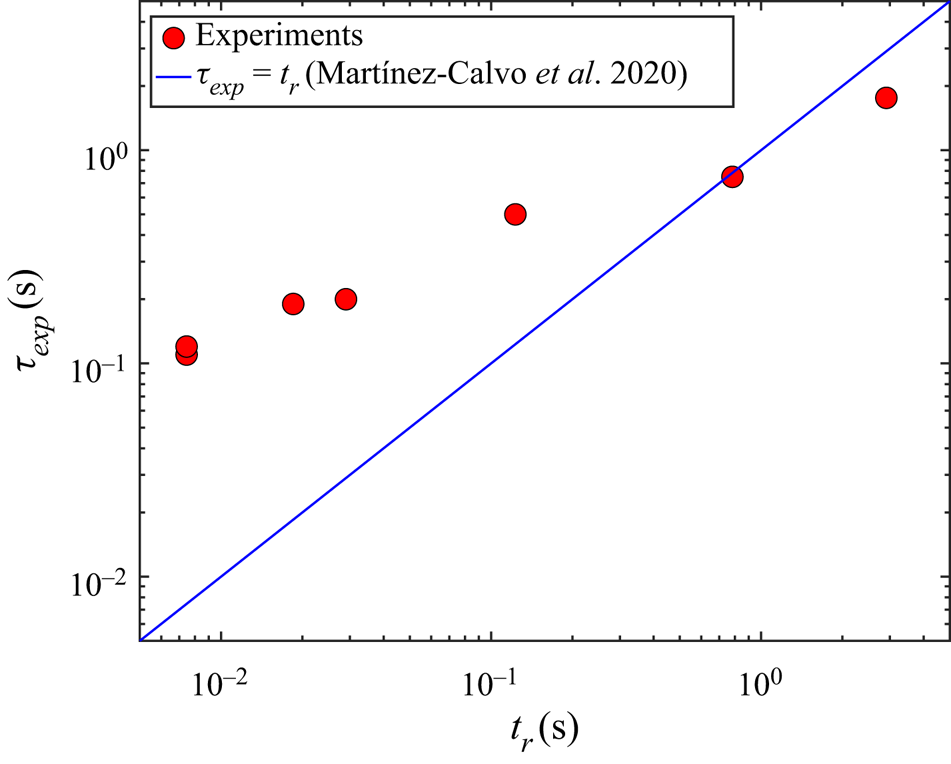
see (4.5d) in Martínez-Calvo et al. (Reference Martínez-Calvo, Sevilla, Peng and Stone2020). The numerical evaluation of this characteristic time is  $t_r = 7$ ms, which is way too short to capture the relaxation dynamics shown in our experiments, which is of the order of
 $\tau _{{exp}}\simeq 0.2$ s (figure 14). However, experiments carried out in extremely long channels (
 $L_{{out}}>10$ cm), and leading to remarkably long jumps (
 $L_{{jump}}>1$ cm), exhibit characteristic times
 $\tau _{{exp}}$ comparable to
 $t_r$ (see figure 15). Note that these experimental characteristic times
 $\tau _{{exp}}$ were obtaining after fitting the jump portion of the
 $L(t)$ curve by a common exponential function
 $L(t) = L_{{out}} - b_1 \{1 - \exp [{-(t-t_{{jump}})/\tau _{{exp}}}]\} - b_2 t$. Here,
 $t_{{jump}}$ is the time of the jump, and
 $b_1$ and
 $b_2$ are fitting parameters representing the amplitude of the jump and the pervaporation speed just after the jump, respectively.
Plot of the characteristic jump time  $\tau _{{exp}}$ measured experimentally as a function of the elasto-viscous characteristic time
 $t_r$ derived by Martínez-Calvo et al. (Reference Martínez-Calvo, Sevilla, Peng and Stone2020) (see (5.1)). Here,
 $\tau _{{exp}}$ is obtained by an exponential fit of the
 $L(t)$ plots. Experiments were realised with the following combinations of geometric parameters [
 $h$;
 $H$;
 $w_{{out}}$;
 $L_{{out}}$;
 $w_{{p}}$] (in
 ${\mathrm {\mu }}\mathrm {m}$) ordered by increasing value of the measured
 $\tau _{{exp}}$:
 $[11; 56; 100; 8000; 5]$,
 $[60; 96; 450; 5500; 30]$,
 $[67; 111; 450; 11\,000; 20]$,
 $[67; 111; 450; 22\,600; 30]$,
 $[67; 111; 350; 94\,400; 30]$ and
 $[67; 111; 350; 182\,000; 30]$.

This puzzling discrepancy between  $\tau _{{exp}}$ and
 $t_r$ for the fastest jumps suggests that other physical ingredients are at play in our experiments. Contact line friction is one possible such ingredient, but we have checked (see Appendix A) that it is only a correction to the model of Martínez-Calvo et al. (Reference Martínez-Calvo, Sevilla, Peng and Stone2020) and unable to explain our experimental dynamics.
Other sources of friction in our system originate from the air flow through the constriction and internal friction within the PDMS.
The friction of air in the narrow constriction is described using the concept of hydraulic resistance  $R_h$, linking the difference in pressure to the flow rate of air with
 $\Delta P=R_h Q_f$. Since the constriction has a rectangular tall cross-section, we have
 $R_h\simeq {12\eta _{air} L_{p}}/{[h w_{p}^3(1-0.630 w_{p}/h)]}$ when
 $w_{{p}}< h$, using the viscosity of air
 $\eta _{air} = 1.6 \times 10^{-5}\ {\rm m}^2\ \mathrm {s}^{-1}$ (Bruus Reference Bruus2008). From the hydraulic capacitance
 $C_h$ defined earlier, in § 4.2, we predict the relaxation time of the flexible cavity, when friction is dominated by air, to be
 $\tau =R_h C_h$. A numerical application provides a value of 2 ms, also way too short.
Concerning internal friction inside the PDMS wall, we can elaborate using results from Placet & Delobelle (Reference Placet and Delobelle2015) showing that the complex elastic modulus for harmonic vibrations,  $E^*=E'+{\rm i}E''$, presents a loss modulus
 $E''$ that is much smaller than the elastic modulus
 $E'$, with a ratio
 $E''/E'<0.2$ for frequencies smaller than 100 Hz, as is the case here. According to Landau & Lifshitz (Reference Landau and Lifshitz1986), a clamped beam of length
 $w_{out}$ and thickness
 $\delta$ should oscillate at a complex frequency
 $\omega ^*=\omega '+{\rm i}\omega ''={22.4}/{w_{out}^2}\sqrt {{E^*\delta ^2}/{12\rho _{PDMS}}}$, where
 $\rho _{PDMS}$ is the density of the solid. A small loss modulus thus means a natural frequency
 $\omega '$ much smaller than attenuation
 $\omega ''$: the relaxation of the beam should produce noticeable underdamped oscillations. Here, we clearly observe an overdamped relaxation. As a conclusion, internal solid friction does not seem high enough to account for the relaxation time.
6. Summary and outlook
In this study, we have proposed a novel design for biomimetic plant leaves containing constrictions and have shown that they were replicating the role of biological pits in that they enable us to recover a strongly intermittent propagation of air embolism. A combination of macroscopic experiments and confocal imaging enabled us to prove that the intermittency is due to a coupling between the compliance of the channel and the capillary pressure at the interface, itself strongly dependent on the constriction geometry.
For future studies, we seek to use this combination of a compliant microchannel and a constriction as a building block for a more complex architecture of biomimetic leaves enabling us to reproduce more closely the universal dynamics reported by Brodribb et al. (Reference Brodribb, Bienaimé and Marmottant2016a,Reference Brodribb, Skelton, McAdam, Bienaimé, Lucani and Marmottantb) across various species of plants.
A step further towards more realistic biomimetic chips would also consist in replacing the PDMS by more hygrophilic materials such as hydrogels or cellulose-based porous materials. Recent studies showed for both wood (Penvern et al. Reference Penvern, Zhou, Maillet, Courtier-Murias, Scheel, Perrin, Weitkamp, Bardet, Caré and Coussot2020) and cellulose-based fabrics (Ma et al. Reference Ma, Maillet, Brochard, Pitois, Sidi-Boulenouar and Coussot2022) that the higher water solubility of these materials leads to dynamics characterised by a most significant role played by bound water.
We anticipate that our results will have significance for a broader audience, in particular in pumpless microfluidic chips (Choi et al. Reference Choi, Kang, Han, Kim and Rogers2017) as well as in chemical engineering where pervaporation is largely employed (Bacchin, Leng & Salmon Reference Bacchin, Leng and Salmon2022). The coupling between the compliance of the channel and the strongly variable pressure induced by the constrictions offers a unique way to passively generate controlled nonlinear dynamics.
Supplementary movies
Supplementary movies are available at https://doi.org/10.1017/jfm.2022.733.
Funding
D. Centanni is gratefully acknowledged for her assistance in microfabrication, D. Débarre, I. Wang and S. Costrel for their assistance in confocal imaging, F. Marquet for his help in the mechanical modelling, and Y. Méheust for fruitful discussions. This work benefited from regular discussions with our partners in the PHYSAP project: X. Noblin, C. Cohen from Université Côte d'Azur, and É. Badel, J. Torres-Ruiz and H. Cochard from INRAE Clermont-Ferrand for insightful discussions. This work was supported by the Agence Nationale de la Recherche (grant no. ANR619-CE30-0010-02).
Declaration of interests
The authors report no conflict of interest.
Appendix A. Effect of contact line friction on the relaxation following the jump
In this Appendix, we refine the analysis of Martínez-Calvo et al. (Reference Martínez-Calvo, Sevilla, Peng and Stone2020) by accounting for the presence of contact line friction at the meniscus. Indeed, such an ingredient is present as soon as contact lines are moving (Snoeijer & Andreotti Reference Snoeijer and Andreotti2013), and it significantly affects dynamical processes such as wetting or dewetting dynamics, drop sliding (Winkels et al. Reference Winkels, Peters, Evangelista, Riepen, Daerr, Limat and Snoeijer2011) and the damping of sloshing (Dollet, Lorenceau & Gallaire Reference Dollet, Lorenceau and Gallaire2020), to cite but a few examples.
Within the assumptions discussed in § 5.2, Martínez-Calvo et al. (Reference Martínez-Calvo, Sevilla, Peng and Stone2020) showed that the pressure field in the start-up flow in a shallow deformable channel obeys a nonlinear diffusion equation. The nonlinearity originates from the cross-section-dependent hydrodynamic resistance. For the sake of simplicity, and since our experiments exhibit only moderate cross-section variations (see the snapshots of figure 4b), we neglect this nonlinear effect and the associated channel deformation in this appendix. The pressure field then obeys the equation
 \begin{equation} \frac{\partial p}{\partial t} = D\,\frac{\partial^2 p}{\partial x^2} , \end{equation}
with an effective diffusion coefficient given by
 \begin{equation} D = \frac{60h^3 B}{\eta w_{{out}}^4} , \end{equation}
and an initial condition
 \begin{equation} p ={-}p_c , \end{equation}
where  $p_c$ is the capillary threshold, i.e. the maximal Laplace pressure reached at the air/liquid interface. The boundary condition at the closed end of the channel
 $x = L_{{out}}$ is
 \begin{equation} \frac{\partial p}{\partial x} = 0 . \end{equation}
Martínez-Calvo et al. (Reference Martínez-Calvo, Sevilla, Peng and Stone2020) considered a sudden release of the pressure from time  $t = 0$, and at
 $x = 0$. This does not apply in our experiments, for the following reasons. First, the meniscus constitutes a moving boundary, hence the boundary condition should be applied at the time-varying location of the meniscus; we neglect this effect, since the jump length remains generally one order of magnitude shorter than the exit channel length. Second, the pressure release is not instantaneous, and it takes some time for the meniscus to equilibrate once the capillary threshold is passed. Contact line friction is one possible reason for such a delay, which we now consider.
During the post-jump relaxation, the contact angle at the meniscus is a receding contact angle  $\theta _r$, which obeys the Cox–Voinov law (see e.g. Snoeijer & Andreotti Reference Snoeijer and Andreotti2013)
 \begin{equation} \theta_r^3 = \theta_{0r}^3 - \frac{9A\eta\,|\dot{L}|}{\gamma} , \end{equation}
where  $\theta _{0r}$ is the equilibrium contact angle, and
 $A$ is the logarithm of the ratio of a macroscopic cut-off length and a microscopic one, which can be taken with reasonable precision as
 $A \approx 10$ (the precise value of
 $A$ will not matter in the subsequent discussion). This velocity-dependent contact angle induces a modulation of Laplace pressure. In principle, we should account for two contact angles at the glass and PDMS interfaces. We neglect this difficulty, as well as the influence of the side walls
 $y = w_{{out}}/2$, and we use the boundary condition
 \begin{equation} p ={-}\frac{\gamma}{h} \cos\theta_r ={-}p_{{rem}} - \frac{\gamma}{h}\, (\cos\theta_r - \cos\theta_{r0}) , \end{equation}
where the remanent Laplace pressure  $p_{{rem}}$ discussed at the end of § 3.3 has been introduced, and where
 $\theta _r$ may be considered as an effective contact angle. In our range of velocities,
 $|\theta _r - \theta _{r0}| \ll 1$, hence we can linearise the boundary condition to obtain
 \begin{equation} p \simeq{-}p_{{rem}} - \frac{3A\eta\sin\theta_{r0}}{h\theta_{r0}^3}\, |\dot{L}| . \end{equation}
Finally, using Poiseuille's law  $|\dot {L}| = -(h^2/12\eta )\,\partial p/\partial x$, we can write the boundary condition as a mixed boundary condition:
 \begin{equation} p + p_{{rem}} = \frac{Ah\sin\theta_{r0}}{4\theta_{r0}^3}\, \frac{\partial p}{\partial x} . \end{equation}
The solution of the diffusion equation (A1) with initial condition (A3) and boundary conditions (A4) and (A8) can be found e.g. in § 4.3.6 of Crank (Reference Crank1975). It is
 \begin{equation} \frac{p + p_c}{p_c - p_{{rem}}} = 1 - \sum_{n=1}^\infty \frac{2\lambda\cos[\beta_n (1 - x/L_{{out}})] \exp(-\beta_n^2 Dt/L_{{out}}^2)}{(\beta_n^2 + \lambda^2 + \lambda)\cos\beta_n} , \end{equation}
where the coefficients  $\beta _n$ are the positive roots of
 $\beta \tan \beta = \lambda$, with
 $\lambda = 4\theta _{r0}^3 L_{{out}}/ (Ah\sin \theta _{r0})$. In the current context, this dimensionless parameter compares bulk viscous dissipation to contact line friction. To estimate its numerical value, we take as an effective contact angle
 $\theta _{r0} = 60^\circ$, a rough estimate from the snapshots of the meniscus; we then get
 $\lambda = 45$, which suggests that contact line friction remains secondary in the relaxation process. To confirm this fact, we may compute the relaxation time
 $\tau _r$ given by the slowest decaying exponential in (A9):
 $\tau _r = L_{{out}}^2/\beta _1^2 D = t_r/\beta _1^2$, where
 $t_r$ is given by (5.1). Numerical resolution yields
 $\beta _1 = 1.54$, whence the estimate
 $\tau _r = 3$ ms, way shorter than the experimental relaxation time.