1 Introduction
The interaction between flow and wall-mounted, flexible structures is ubiquitous in nature and engineering. Flexible canopies strongly modulate the mixing in natural streams, and elastic motions of structures offer ways to harvest energy. Uncovering the underlying processes modulating such interaction is not trivial; the problem poses significant fundamental challenges associated with distinctive, multiscale coupling between structures and flow. Substantial effort has been placed on characterizing the mean deformation and drag of single, flexible structures facing uniform flow. Alben, Shelley & Zhang (Reference Alben, Shelley and Zhang2002, Reference Alben, Shelley and Zhang2004) showed changes of the
 $U^{2}$
-scaling for drag on plates to
 $U^{4/3}$
-scaling for sufficiently large flow velocity
 $U$
, where the structures exhibited quasi-parabolic deformation. Gosselin, De Langre & Machado-Almeida (Reference Gosselin, De Langre and Machado-Almeida2010) investigated two different flexible plates under airflow, and found that the drag collapsed when they used a scaled
 $Ca$
. Luhar & Nepf (Reference Luhar and Nepf2011) proposed a model able to predict the deformation and drag of rectangular plates under uniform flow for a range of stiffness, aspect ratio and
 $Ca$
. Leclercq, Peake & de Langre (Reference Leclercq, Peake and de Langre2018) found that the flapping motion of flexible plates has a minor effect on the drag reduction due to the deformation.
Structure flexibility may significantly modulate the oscillations induced by the incoming flow and wake. Mullarney & Henderson (Reference Mullarney and Henderson2010) developed a model for wave-forced motions with small deflections of a single-stem vegetation using the Euler–Bernoulli problem for a cantilever beam. A revised version of this model was proposed by Luhar & Nepf (Reference Luhar and Nepf2016), which included large-amplitude oscillations, buoyancy and added mass. A very recent study by Leclercq & de Langre (Reference Leclercq and de Langre2018) showed that under oscillatory flow, flexibility of neutrally buoyant slender structures reduces the internal stresses as long as drag dominates the fluid inertial forces. The dynamics of structures in the proximity of others may undergo coupling, which may lead to distinctive oscillation patterns and flow fluctuations. Early work by Thom (Reference Thom1971) showed that the drag force on an artificial canopy is much smaller than that adding individual drag contributions. Similar observations were reported later by Brunet, Finnigan & Raupach (Reference Brunet, Finnigan and Raupach1994) and Novak et al. (Reference Novak, Warland, Orchansky, Ketler and Green2000), which indicated the important role of the cluster density. Recent experiments by Barsu et al. (Reference Barsu, Doppler, Jerome, Rivière and Lance2016) showed that below a critical distance, the drag coefficient of aligned plates is sensitive to their separation.
In addition to the flow features and drag force, upstream structures may significantly modulate the oscillation of downstream counterparts. Various experimental (e.g., Huera-Huarte & Bearman Reference Huera-Huarte and Bearman2011; Huera-Huarte & Gharib Reference Huera-Huarte and Gharib2011) and numerical (e.g., Borazjani & Sotiropoulos Reference Borazjani and Sotiropoulos2009; Wang et al. Reference Wang, Xiao, Zhu and Incecik2017) works have inspected the vortex/wake induced vibrations of circular cylinders in tandem. Wang et al. (Reference Wang, Xiao, Zhu and Incecik2017) found that the structures may behave as a single body with small separation; whereas sufficiently large gaps may lead to von Kármán vortex shedding impinging the downstream structure. Ristroph & Zhang (Reference Ristroph and Zhang2008) and Kim, Huang & Sung (Reference Kim, Huang and Sung2010) inspected flags in tandem and noted a counterintuitive drag increase in the downstream flag. Huang, Wei & Lu (Reference Huang, Wei and Lu2018) reported that for inverted flexible flags arranged in-line, the flapping amplitude of the downstream flag may undergo a significant increase, whereas that of the upstream structure may remain unchanged.
Despite these significant insights, the unsteady dynamics of wall-mounted, flexible plates in tandem remains far from being well understood. This study explores such a problem and provides qualitative and quantitative elements as well as a predictive framework to characterize the motion of the structures. An experimental investigation was conducted for various flows and geometrical configurations. The manuscript is organized as follows. The experimental set-up is described in § 2, the results are discussed in § 3, and main conclusions are provided in § 4.
2 Experimental set-up
Two rectangular, flexible plates were mounted vertically at the bottom wall of a 2.5 m long,
 $112.5~\text{mm}\times 112.5~\text{mm}$
cross-section refractive-index-matching (RIM) flume. The structures were placed facing the flow in tandem configuration at the centreline and near the entrance of the flume. There, the incoming flow was nearly uniform with negligible turbulence. A NaI aqueous solution with density
 $\unicode[STIX]{x1D70C}_{f}=1800~\text{kg}~\text{m}^{-3}$
and kinematic viscosity
 $\unicode[STIX]{x1D708}=1.1\times 10^{-6}~\text{m}^{2}~\text{s}^{-1}$
was used as the working fluid. This allowed index matching between the flume walls, structures and solution fine-tuned via temperature control, which resulted in measurements very close to the surface of plates. More details about RIM technique can be found in Bai & Katz (Reference Bai and Katz2014). The plates were made from acrylic and had the same height
 $h=40$
mm, width
 $b=h/4$
, thickness
 $c=0.125$
mm, Young’s modulus
 $E=2.7$
GPa and density
 $\unicode[STIX]{x1D70C}_{m}=1200~\text{kg}~\text{m}^{-3}$
.
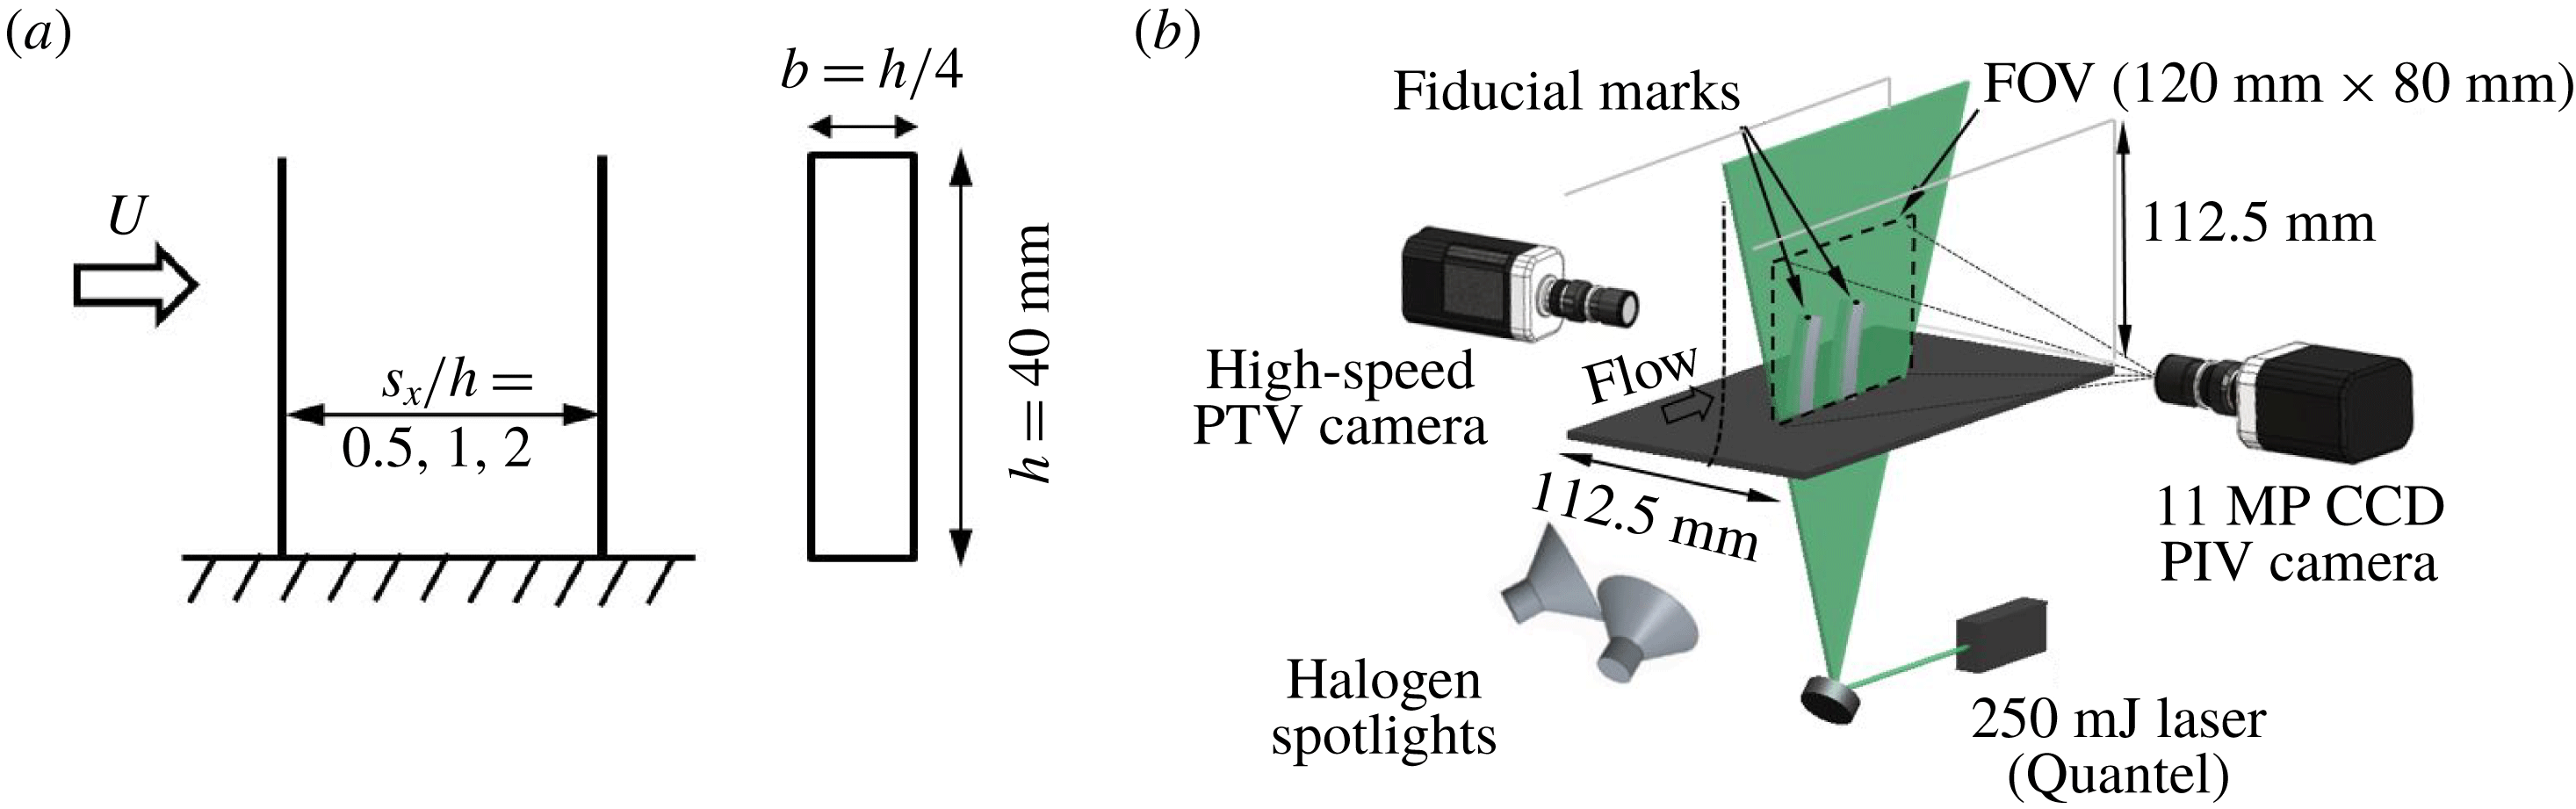
The coupled dynamics of the structures and flow was studied for three spacings
 $s_{x}=\unicode[STIX]{x0394}x/h=0.5$
, 1 and 2 (henceforth small, intermediate and large separations, see figure 1
a) at various incoming velocities
 $U_{0}\in [0.24,0.54]~\text{m}~\text{s}^{-1}$
every
 $\unicode[STIX]{x0394}U_{0}=0.05~\text{m}~\text{s}^{-1}$
, which corresponded to Reynolds numbers
 $Re=U_{0}b/\unicode[STIX]{x1D708}\in [2.2,5]\times 10^{3}$
or Cauchy numbers
 $Ca=\unicode[STIX]{x1D70C}_{f}bU_{0}^{2}h^{3}/(EI)\in [15,77]$
(Luhar & Nepf Reference Luhar and Nepf2016); here,
 $I=bc^{3}/12$
. The value of
 $Ca$
accounts for the relative magnitude of the hydrodynamic drag and the restoring force due to stiffness. Within the range of
 $Re$
and
 $Ca$
studied, the plates underwent distinctive deformation. For each set-up, the motion of the plates was tracked synchronously at a frequency of 300 Hz for sampling periods over 30 s (i.e., over 9000 instants) with a particle tracking velocimetry (PTV) system. It used a Mikrotron EoSens 4CXP MC4082 camera at 2 MP resolution, a Nikon AF Micro-Nikkor 28 mm lens that maximized the focus of an interrogation area of 120 mm by 60 mm and illumination provided by two Stanley lithium ion halogen spotlights. A fiducial point was carefully marked at the centre of each plate tip to track the motions. The PTV calibration was carried out with a pixel to distance ratio of
 $0.06~\text{mm}~\text{pixel}^{-1}$
, and data were processed with the open source software, OpenPTV. More details of the PTV system can be found in Kim et al. (Reference Kim, Kim, Liberzon and Chamorro2016). Figure 1(b) illustrates the basic set-up of the two-plate system.
(a) Layout and geometry of the flexible plates; (b) basic schematic of the experimental set-up.

The flow in the vicinity of the two plates was characterized with a high-resolution planar PIV from TSI within a wall-normal plane coinciding with the centre of both plates. A field of view (FOV) of
 $120~\text{mm}\times 80~\text{mm}$
was illuminated with a 1 mm thick laser sheet using a
 $250~\text{mJ}~\text{pulse}^{-1}$
double-pulsed laser from Quantel. For each case, two thousand image pairs were collected at a frequency of 1 Hz with a 11 MP CCD camera. A recursive cross-correlation method was applied to interrogate the image pairs via Insight 4G software from TSI. The final interrogation window had a size of
 $24~\text{pixels}\times 24~\text{pixels}$
with 50 % overlap, resulting in a vector grid spacing of
 $\unicode[STIX]{x0394}x=\unicode[STIX]{x0394}y=420~\unicode[STIX]{x03BC}\text{m}$
.
3 Results
In this section, we characterize and analyse the distinctive dynamics of the plates and induced flow as a function of
 $Ca$
and
 $s_{x}$
. For all the cases studied, the plates exhibited oscillations in the streamwise direction due to the relatively low aspect ratio of the structures and the much lower stiffness in the direction of the mean flow; here, torsional motions and oscillations normal to the interrogated plane were absent. For clarity, the description is split in terms of
 $s_{x}$
due to its role on the distinctive coupling of the plates.
3.1 Interaction of the plates with small separation,
 $s_{x}=0.5$

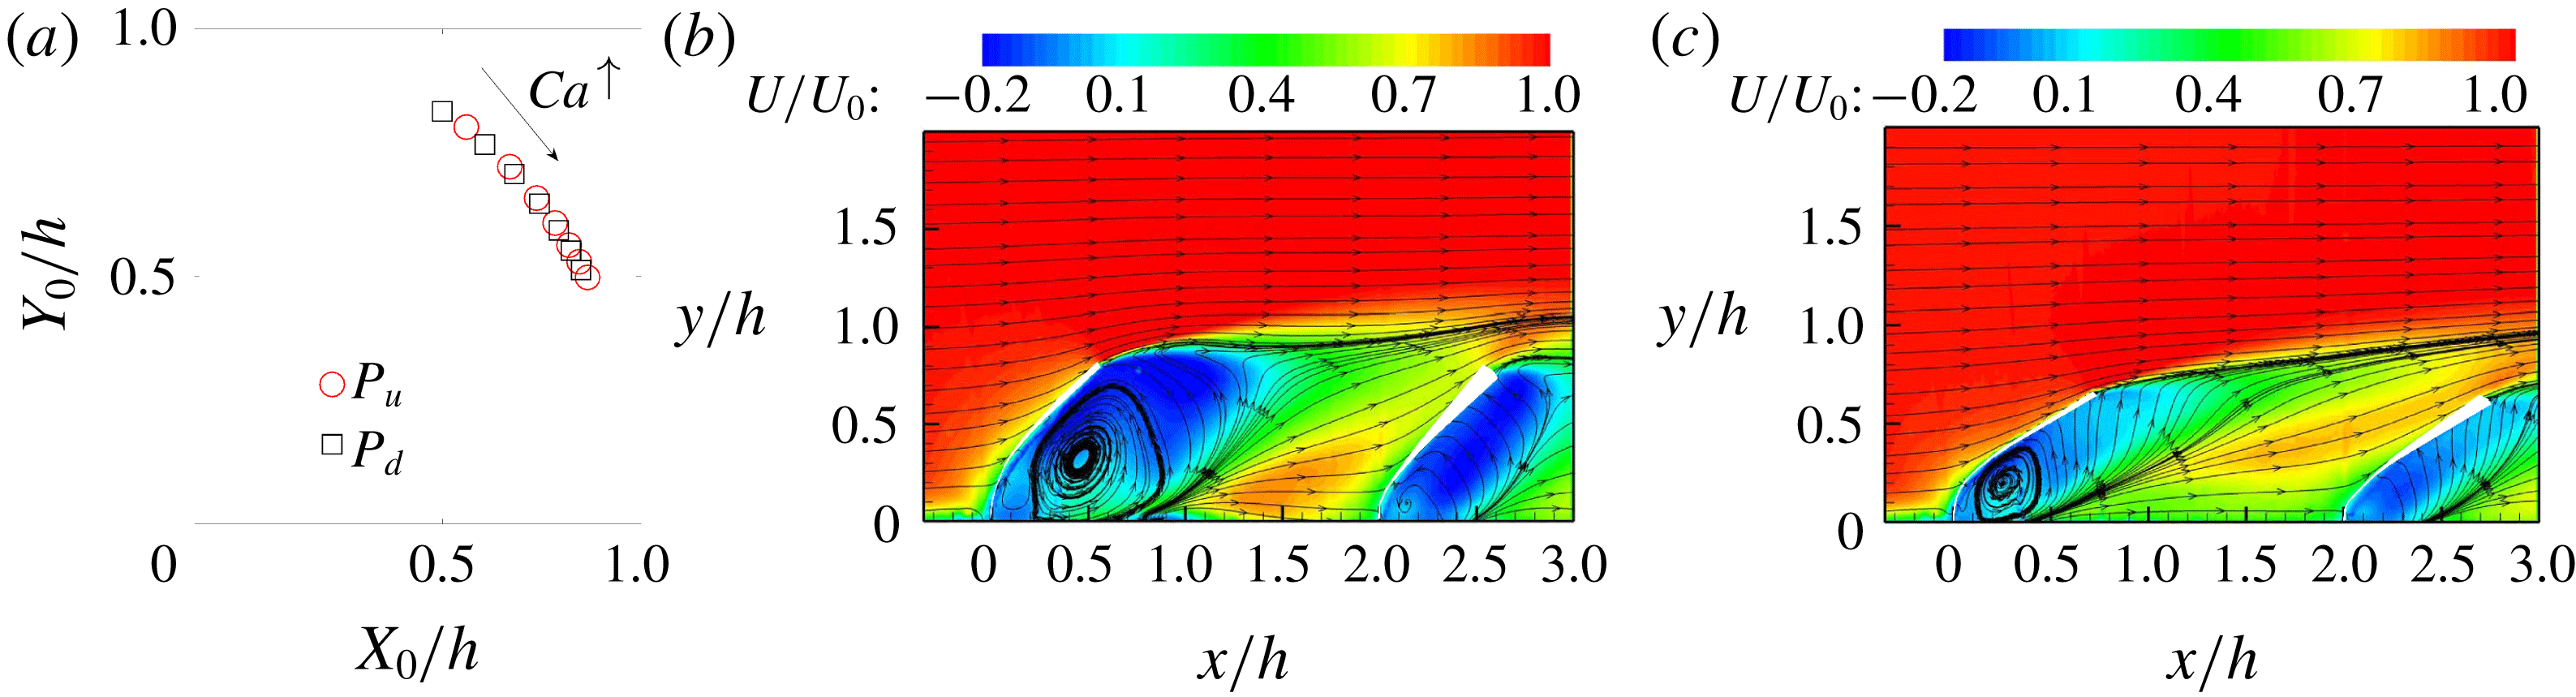
A first-order assessment of the plate motion as a function of
 $Ca$
is given with the time-averaged position of the tips
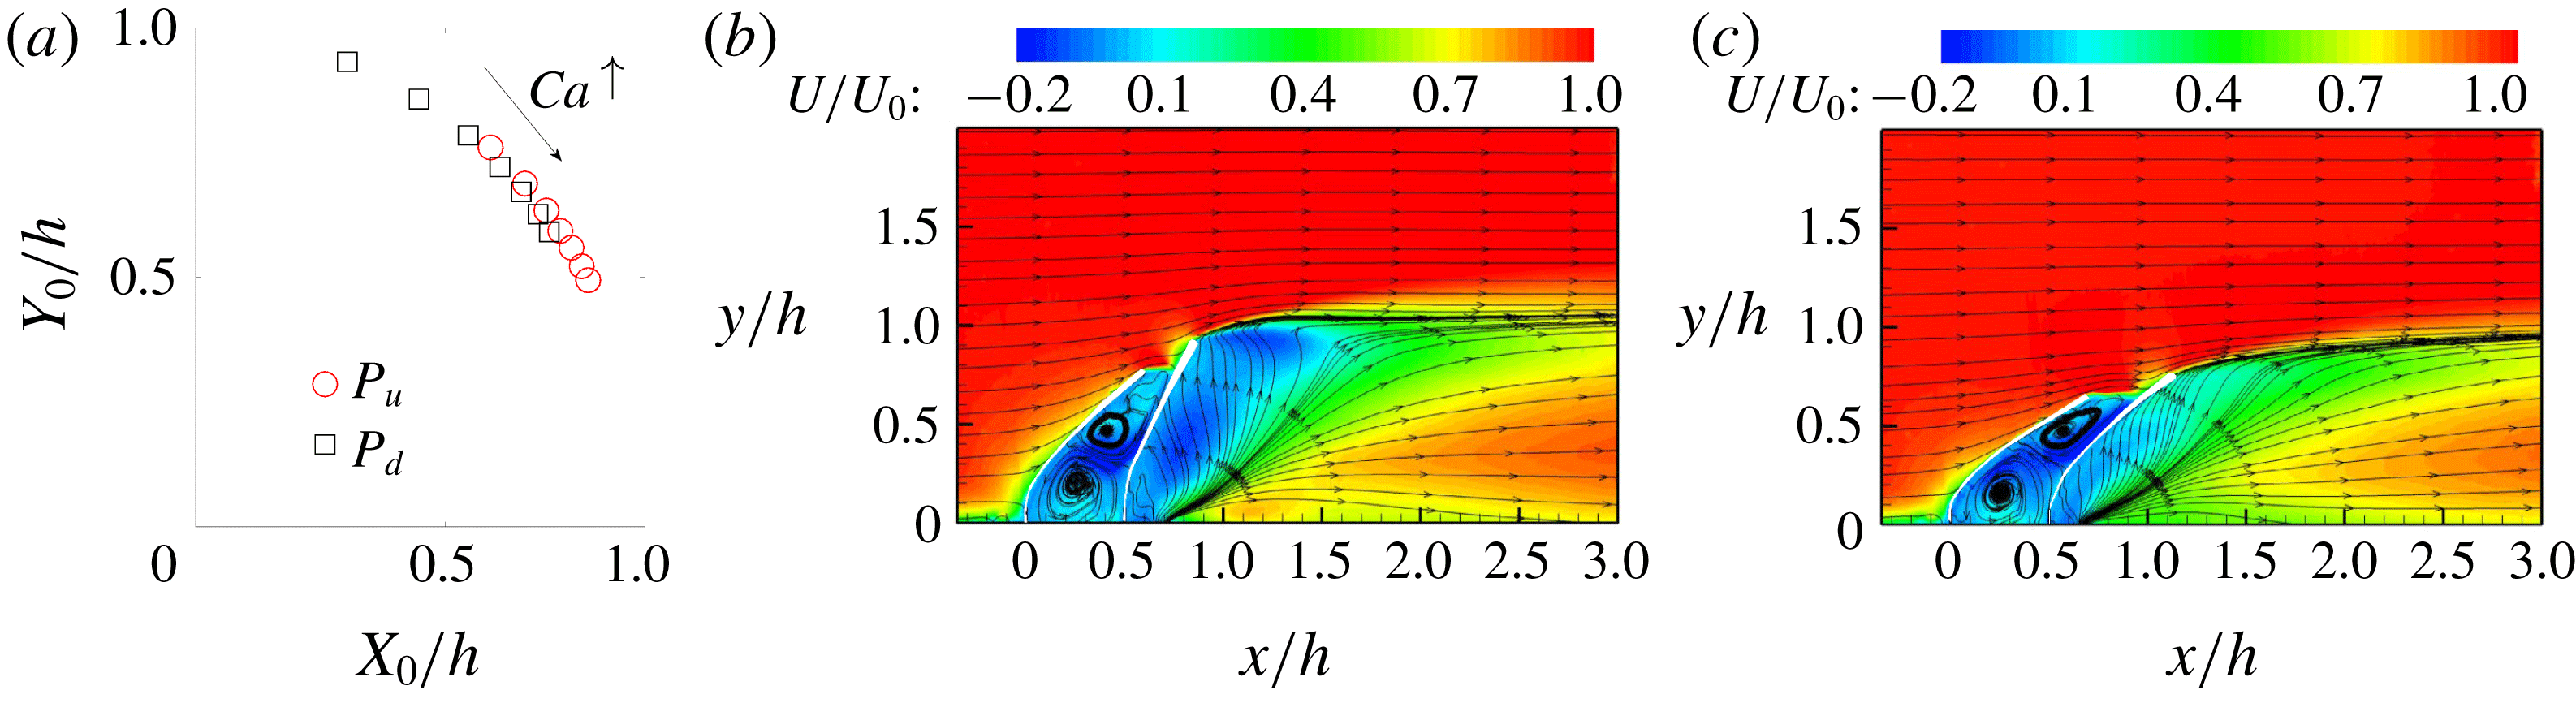
 $\boldsymbol{X}_{0}=(X_{0},Y_{0})=\langle x,y\rangle _{tip}$
in figure 2(a). The downstream plate (hereon
 $P_{d}$
) underwent lower mean deformations due to the locally reduced incoming flow. This is illustrated with the streamwise velocity distribution
 $U/U_{0}$
in figure 2(b,c) for two values of
 $C_{a}$
; there, streamlines are included to better visualize the mean flow features. Most of the
 $P_{d}$
was located within the back-flow region, i.e.,
 $U(x,y)\leqslant 0$
, induced by the upstream plate (hereon
 $P_{u}$
). Only the vicinity of the tip was exposed to the nearly undisturbed flow. The relatively short gap between the plates also promoted the formation of two recirculation regions, which was not present with larger
 $s_{x}$
(shown later).
(a) Time-averaged tip position (
 $X_{0},Y_{0}$
) of the upstream (
 $P_{u}$
) and downstream (
 $P_{d}$
) plates for
 $Ca\in [15,77]$
; (b) streamwise velocity distribution
 $U/U_{0}$
at
 $Ca=15$
; (c)
 $U/U_{0}$
at
 $Ca=30$
. Cases with
 $s_{x}=0.5$
.

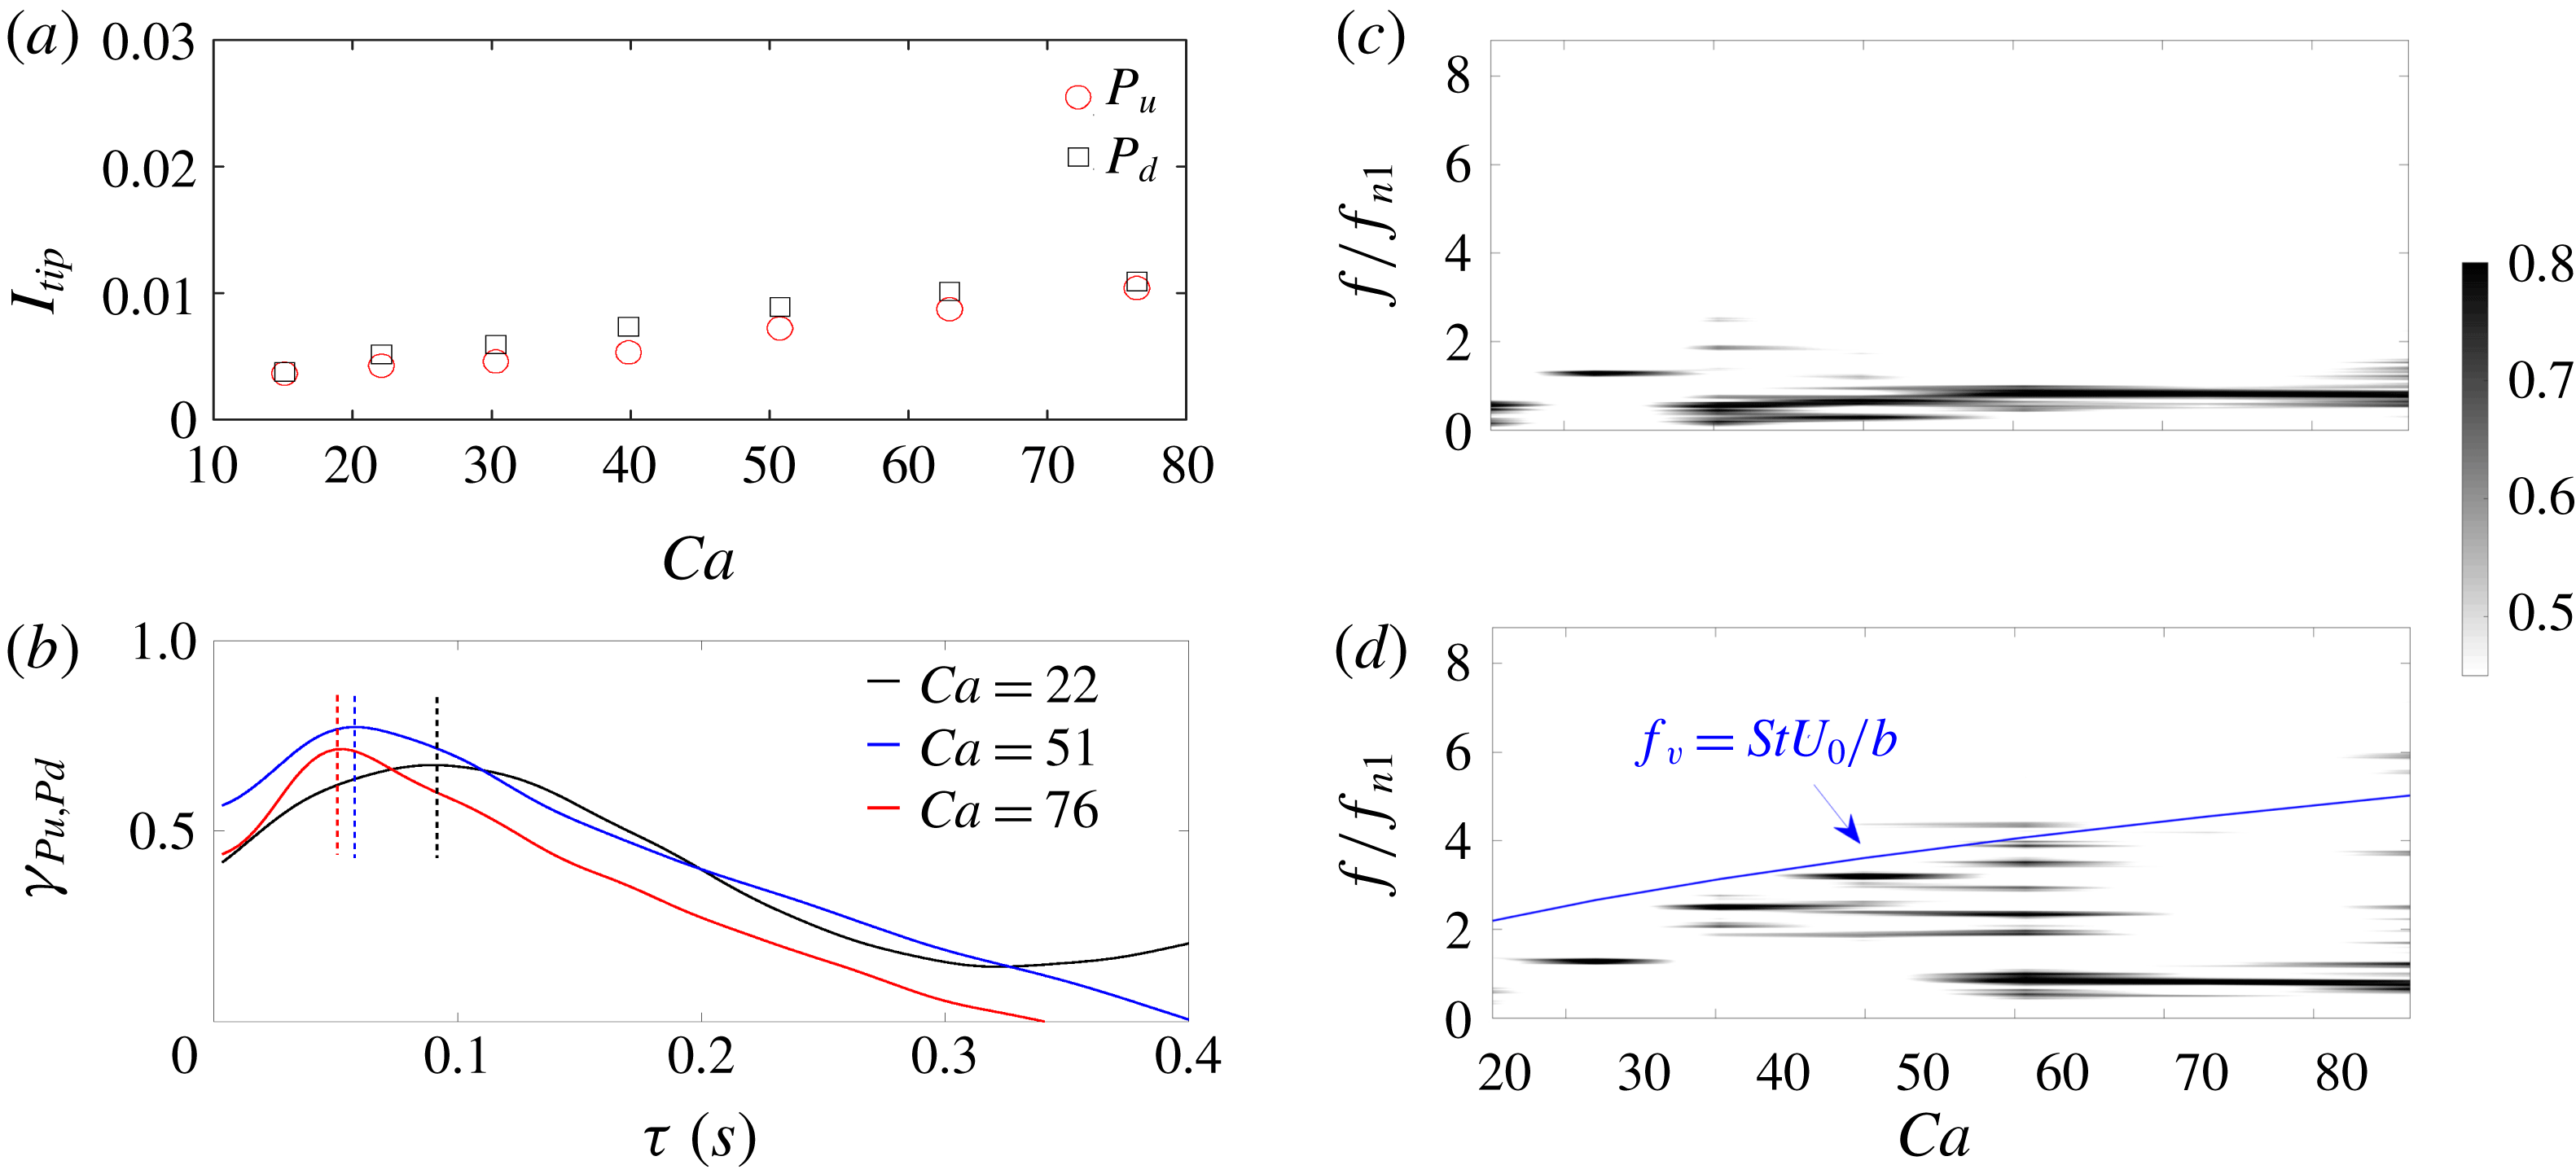
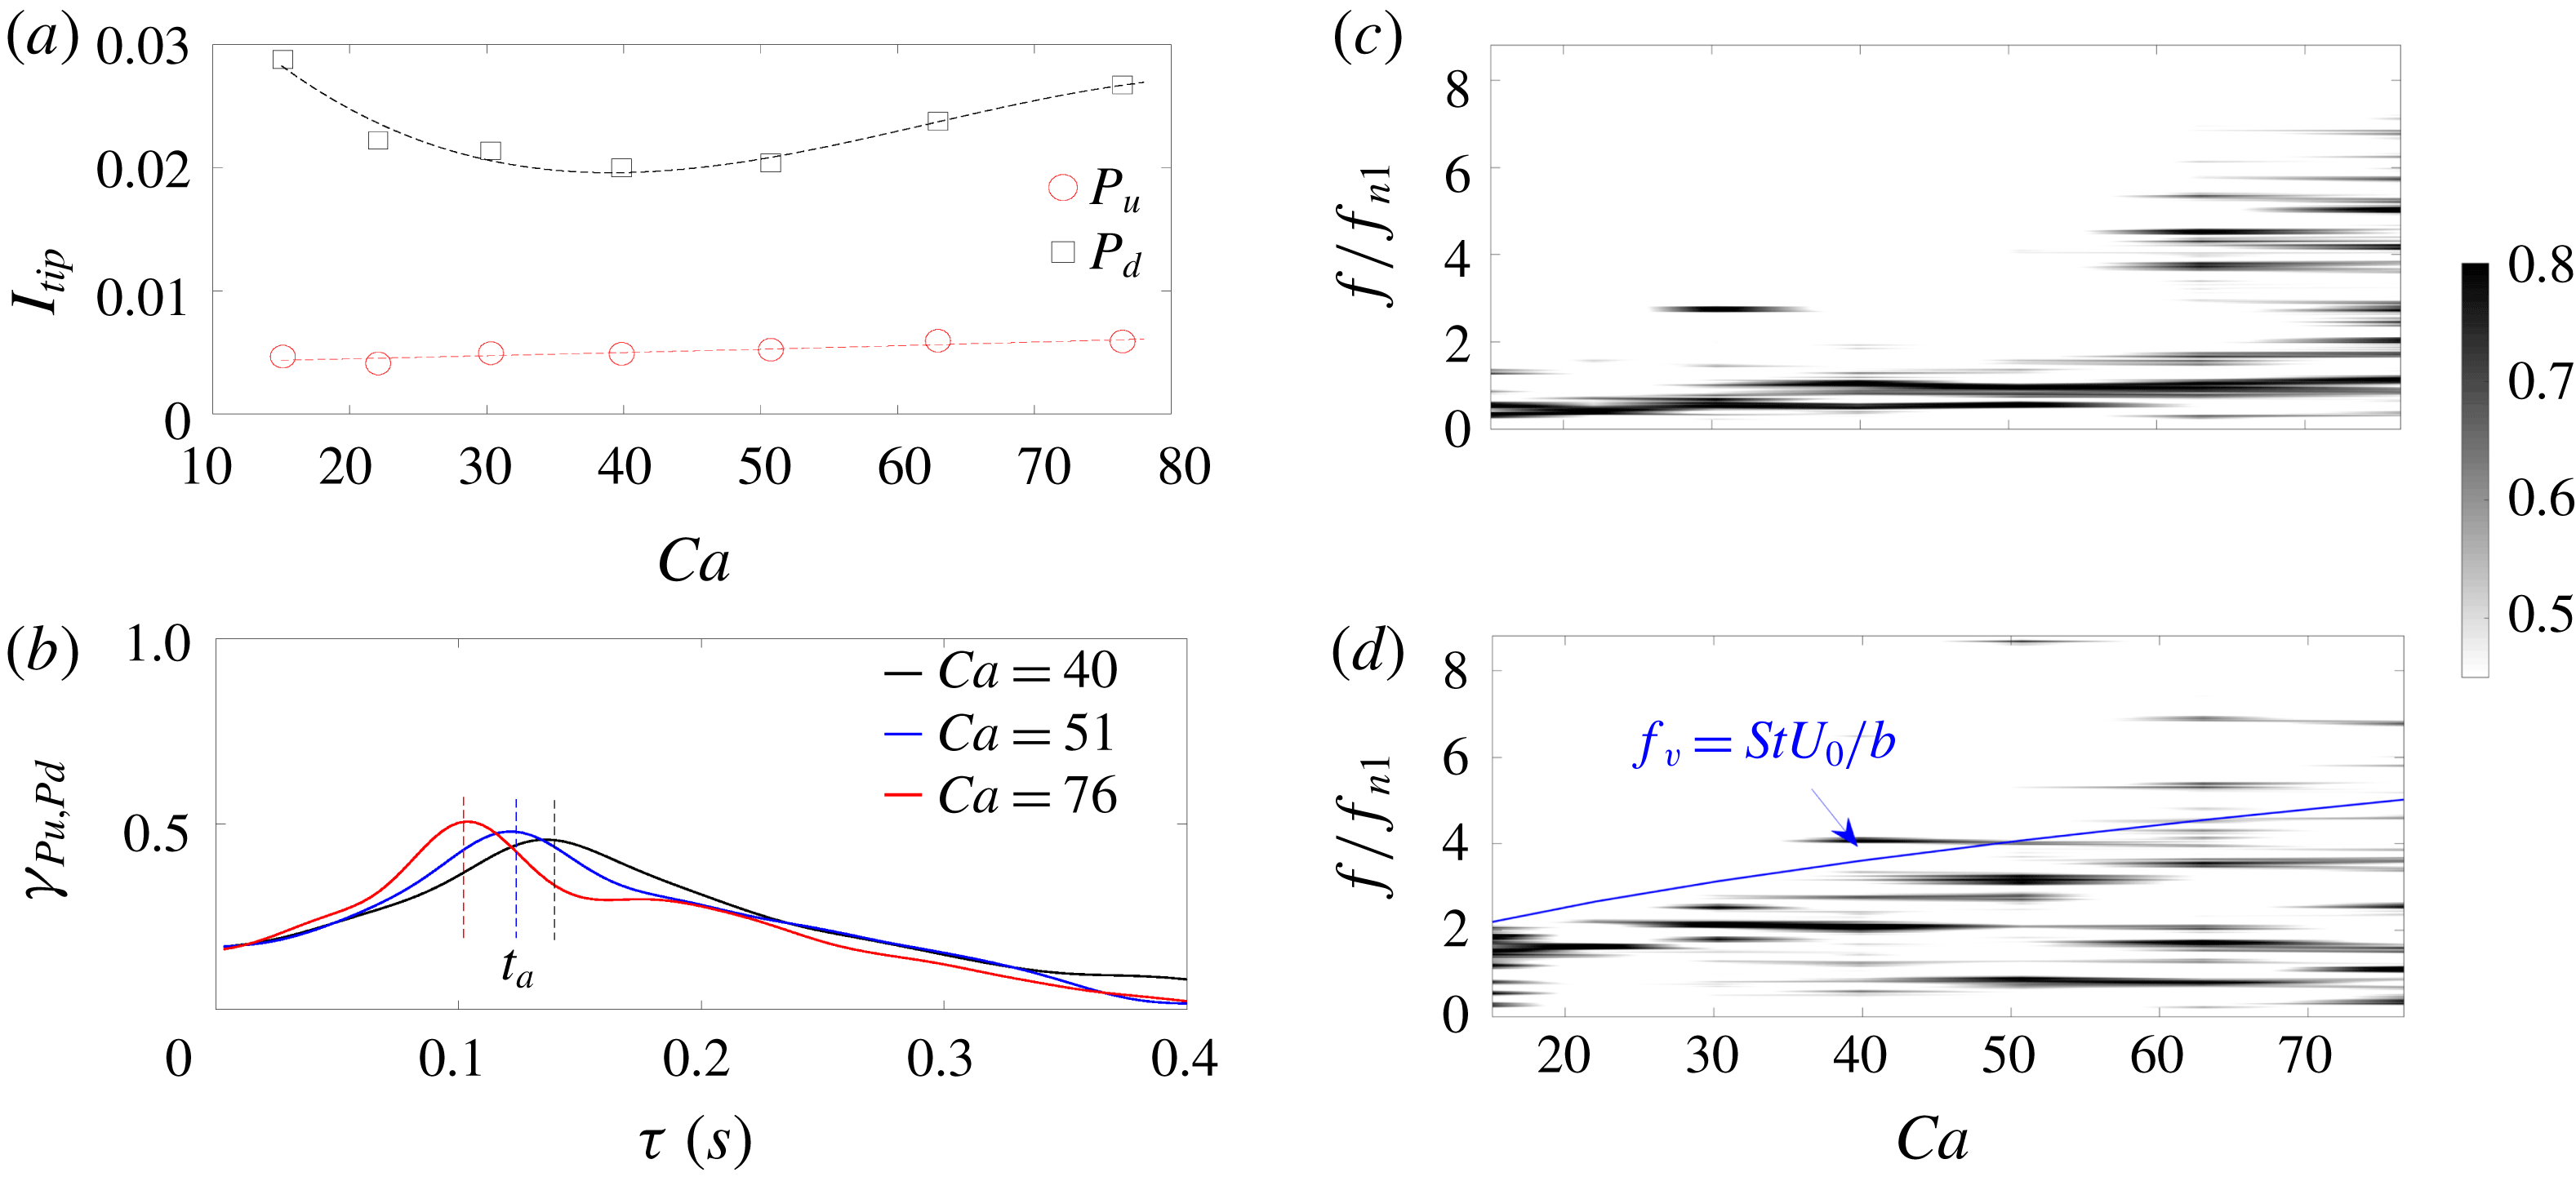
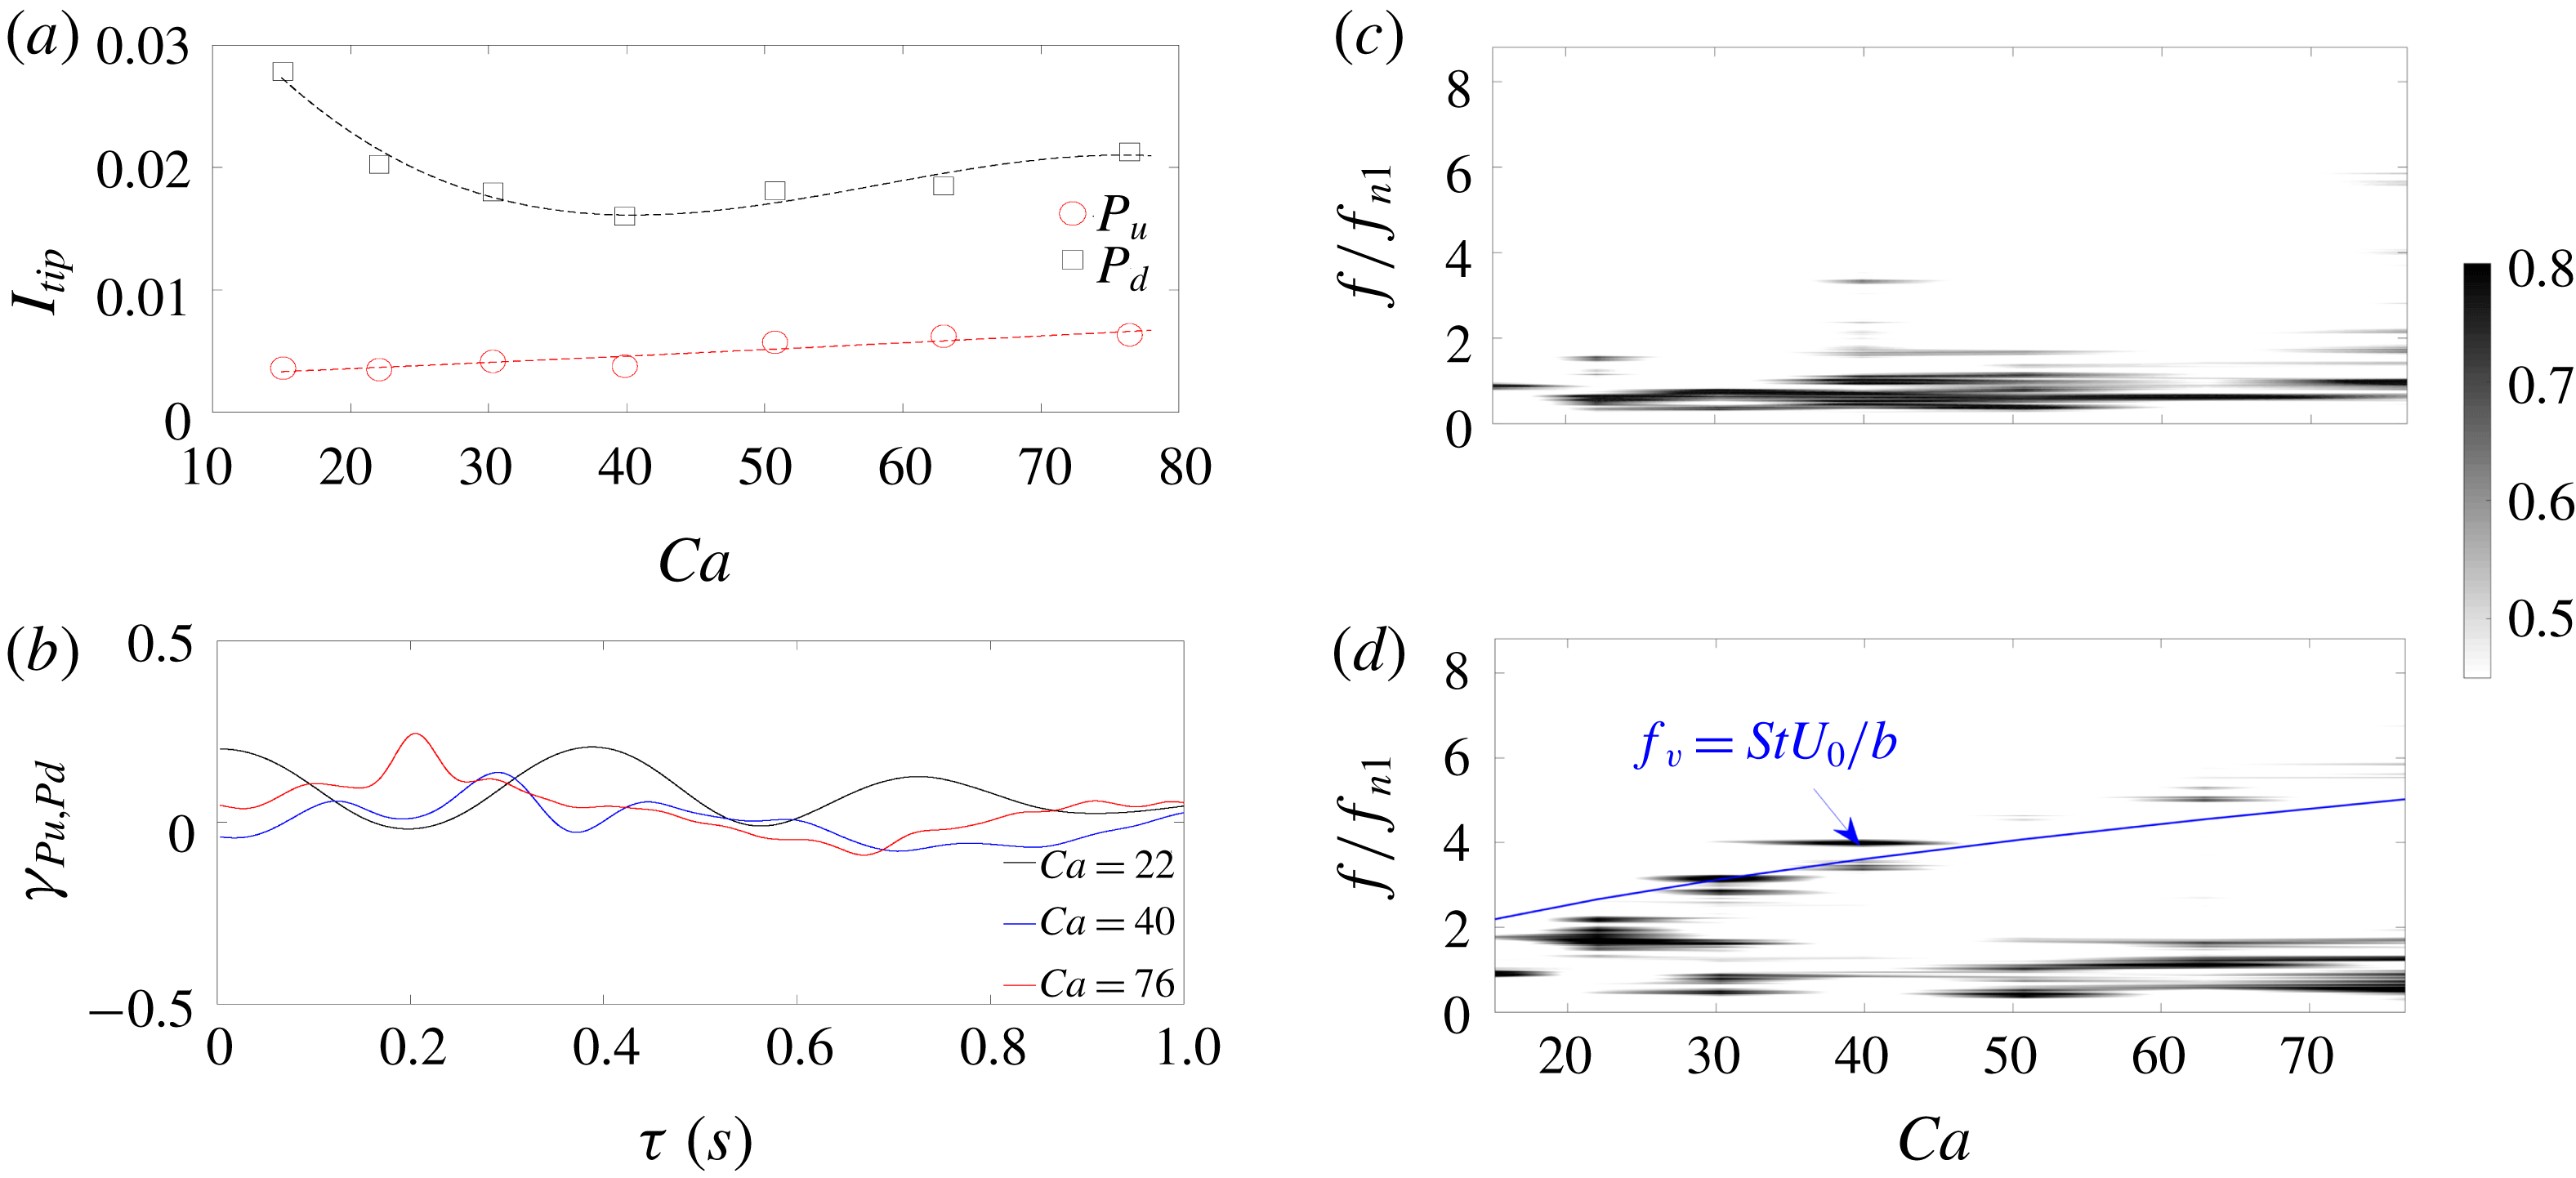
(a) Intensity of the tip motions
 $I_{tip}$
across
 $Ca$
for the two plates; (b) cross-correlation function
 $\unicode[STIX]{x1D6FE}_{p_{u},p_{d}}(\unicode[STIX]{x1D70F})$
for selected
 $Ca$
; (c) 2D compensated spectra of the tip displacements of the
 $P_{u}$
plate; (d) same as (c) for the
 $P_{d}$
plate. Cases with
 $s_{x}=0.5$
.

Bulk characterization of the dynamics of the plates was obtained via the intensity of the tip displacements
 $I_{tip}=\Vert \boldsymbol{x}(t)-\boldsymbol{X}_{0}\Vert /h$
, where
 $\Vert \cdot \Vert$
denotes the
 $L^{2}$
-norm and
 $\boldsymbol{x}$
is the instantaneous location of the tips. Notably, both plates exhibited very similar
 $I_{tip}$
, which increased monotonically with
 $Ca$
(see figure 3
a). The plates also showed a high degree of coupling, as evidenced by the cross-correlation of the tips
 $\unicode[STIX]{x1D6FE}_{p_{u},p_{d}}(\unicode[STIX]{x1D70F})=\langle x_{p_{u}}(t)x_{p_{d}}(t+\unicode[STIX]{x1D70F})\rangle$
in figure 3(b) for three
 $Ca$
. Indeed, peak values resulted in
 $\unicode[STIX]{x1D6FE}_{p_{u},p_{d}}(\unicode[STIX]{x1D70F}=t_{a})>0.65$
. The characteristic time shift
 $t_{a}$
is associated with the mean advection velocity of the flow between
 $P_{u}$
and
 $P_{d}$
and, consequently, decreased with increasing
 $Ca$
.
The dominant modes of oscillation of the plates across
 $Ca$
are shown in figure 3(c,d) with the compensated spectra
 $f\unicode[STIX]{x1D6F7}/\text{max}\{\,f\unicode[STIX]{x1D6F7}\}$
, where
 $\unicode[STIX]{x1D6F7}$
is the spectrum of the streamwise component of the tip motions. In general, the upstream plate presented roughly similar features across
 $Ca$
with the dominating modes close to its first-order natural frequency
 $f_{n1}$
; however, energetic modes at higher frequencies occurred in the downstream structure. The fundamental frequency
 $f_{n1}$
is modulated by the surrounding medium acting as added mass and damping; it is given by:
 $$\begin{eqnarray}f_{n1}/f_{n1o}=\sqrt{1-\unicode[STIX]{x1D709}^{2}},\quad \text{where}~f_{n1o}=\frac{0.56}{h^{2}}\sqrt{\frac{EI}{\unicode[STIX]{x1D70C}_{m}bc+\unicode[STIX]{x1D70C}_{f}C_{m}\unicode[STIX]{x03C0}b^{2}/4}}.\end{eqnarray}$$
Here,
 $C_{m}=1$
(Luhar & Nepf Reference Luhar and Nepf2016),
 $\unicode[STIX]{x1D709}$
is the damping ratio determined by the dominant oscillation frequency of a single plate under uniform flow at
 $Ca=15$
. Our experiments indicate that
 $\unicode[STIX]{x1D709}=0.43$
is a good estimation. Evidence indicates that for structures in tandem with sufficiently small separation, von Kármán vortex shedding can be induced only in the wake of the downstream structure (Lin & Glendening Reference Lin and Glendening2002; Lin, Yang & Rockwell Reference Lin, Yang and Rockwell2002; Borazjani & Sotiropoulos Reference Borazjani and Sotiropoulos2009; Younis, Alam & Zhou Reference Younis, Alam and Zhou2016). There, the gap may be dominated by small-scale Kelvin–Helmholtz (
 $K{-}H$
) instability (Khabbouchi et al.
Reference Khabbouchi, Fellouah, Ferchichi and Guellouz2014; Liu, Hamed & Chamorro Reference Liu, Hamed and Chamorro2018). A similar phenomenon occurred with the plates for the
 $s_{x}=0.5$
cases, where the dynamics of
 $P_{u}$
was governed by
 $f_{n1}$
(Jin, Ji & Chamorro Reference Jin, Ji and Chamorro2016; Jin & Chamorro Reference Jin and Chamorro2017). Distinctive vortex shedding was induced in the very near wake of the downstream structure, whose footprint is observed in figure 3(d). The vortex shedding frequency (
 $f_{v}$
) did not strictly follow the Strouhal relation
 $St=f_{v}U_{0}/b=0.15$
(blue curve in figure 3
d) suggested by Knisely (Reference Knisely1990) and Norberg (Reference Norberg1993) for rigid plates. The differences in
 $St$
were likely due to the changes of the gap between the two plates across
 $Ca$
. Finally, it is worth pointing out that for sufficiently low
 $Ca$
(
 ${\lesssim}30$
), the
 $P_{d}$
was able to induce some backward modulation on
 $P_{u}$
, as suggested in figure 3(c). This may be attributed to the comparatively smaller tip distance between the plates, shown in figure 2(a). The increase of
 $s_{x}$
is expected to severely condition the strong coupling of the structures and the turbulence-induced forcing on
 $P_{d}$
; this is explored as follows.
3.2 Interaction of the plates with intermediate separation,
$s_{x}=1$

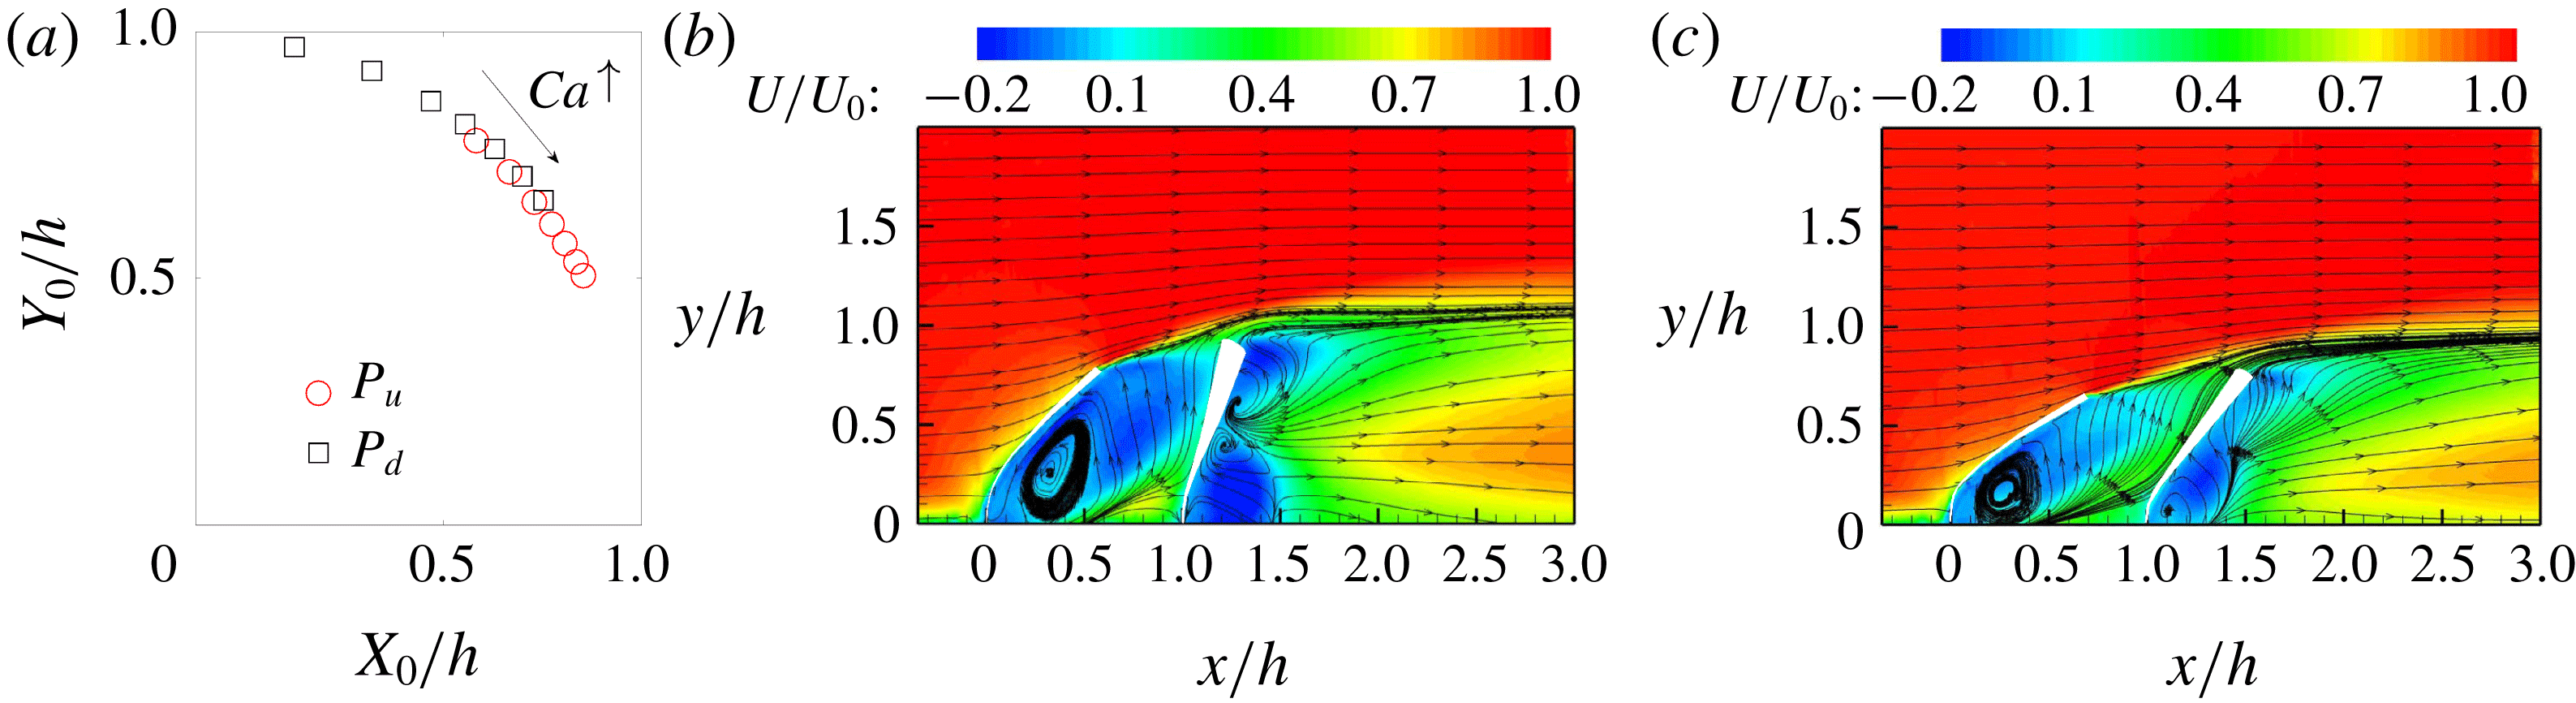
Time-averaged tip position (
 $X_{0},Y_{0}$
) of the upstream (
 $P_{u}$
) and downstream (
 $P_{d}$
) plates for
 $Ca\in [15,77]$
; (b) streamwise velocity distribution
 $U/U_{0}$
at
 $Ca=15$
; (c)
 $U/U_{0}$
at
 $Ca=30$
. Cases with
 $s_{x}=1$
.

The increase of the plate separation to
 $s_{x}=1$
or, equivalently, 4 times the plate’s width, led to very distinctive motions. Despite that
 $P_{u}$
exhibited similar levels of deformation across
 $Ca$
as those of the
 $s_{x}=0.5$
cases (figure 4
a),
 $P_{d}$
underwent smaller bending. This interesting phenomenon is explained by inspecting the streamwise velocity distribution shown in figure 4(b,c). Despite that the larger separation allowed a recovery of the bulk flow impinging
 $P_{d}$
, the flow in the vicinity of the
 $P_{d}$
tip was significantly lower (less than half of the freestream velocity) due to the vertical diffusion of the wake. This stresses the dominant role of the flow near the tip region. Note also that, compared to the
 $s_{x}=0.5$
cases, the velocity deficit distributed more uniformly at the location of
 $P_{d}$
. Similar to cylinders in tandem (Lin & Glendening Reference Lin and Glendening2002; Younis et al.
Reference Younis, Alam and Zhou2016), larger
 $s_{x}$
facilitates the production of vortices within the gap between the two plates; consequently, the
 $P_{d}$
structure is more susceptible to vortex-induced motions. This resulted in a large impact on
 $I_{tip}$
,
 $\unicode[STIX]{x1D6FE}_{p_{u},p_{d}}(\unicode[STIX]{x1D70F})$
and the dominant modes of oscillations. Indeed, the
 $I_{tip}$
of
 $P_{d}$
exhibited a distinctive trend compared to the
 $s_{x}=0.5$
cases, characterized by a concave distribution with a local minimum at intermediate
 $Ca$
(see figure 5
a); analysis of this phenomenon will be elaborated below. Also, loss of coupling between
 $P_{u}$
and
 $P_{d}$
is evident from a reduction in the peak of
 $\unicode[STIX]{x1D6FE}_{p_{u},p_{d}}(\unicode[STIX]{x1D70F})$
(see figure 5
b). The direct impingement of the vortex shedding from
 $P_{u}$
induced a strong footprint on the dynamics of
 $P_{d}$
approximately following
 $St=0.15$
(figure 5
d); there, the influence of tip vortex and bending of
 $P_{u}$
may lead to some other frequency components. Comparatively, the oscillations of
 $P_{u}$
presented a clear signature near
 $f_{n1}$
across
 $Ca$
(figure 5
c). As noted by Gopalkrishnan (Reference Gopalkrishnan1993) and Zhao (Reference Zhao2015), the effect of the von Kármán vortex shedding is usually more distinctive in the transverse direction (i.e., perpendicular to the mean flow) but comparatively reduced in the streamwise direction. A recent study by Jin, Kim & Chamorro (Reference Jin, Kim and Chamorro2018) shows that for flexible structure oscillations under uniform flow and restricted in streamwise direction, von Kármán vortex shedding dominates the wake of structures governed by natural-frequency motion; broadband flow fluctuations near wake play a distinctive role in driving the streamwise dynamics of the structure. Note, however, that larger amplitudes of oscillation of
 $P_{d}$
may eventually alter the dynamics of
 $P_{u}$
, as noted in the compensated spectrum of the tip motion in figure 5(c) for high
 $Ca$
.
(a) Intensity of the tip motions
 $I_{tip}$
across
 $Ca$
for the two plates; (b) cross-correlation function
 $\unicode[STIX]{x1D6FE}_{p_{u},p_{d}}(\unicode[STIX]{x1D70F})$
for selected
 $Ca$
; (c) 2D compensated spectra of the tip displacements of the
 $P_{u}$
plate; (d) same as (c) for the
 $P_{d}$
plate. Cases with
 $s_{x}=1$
.

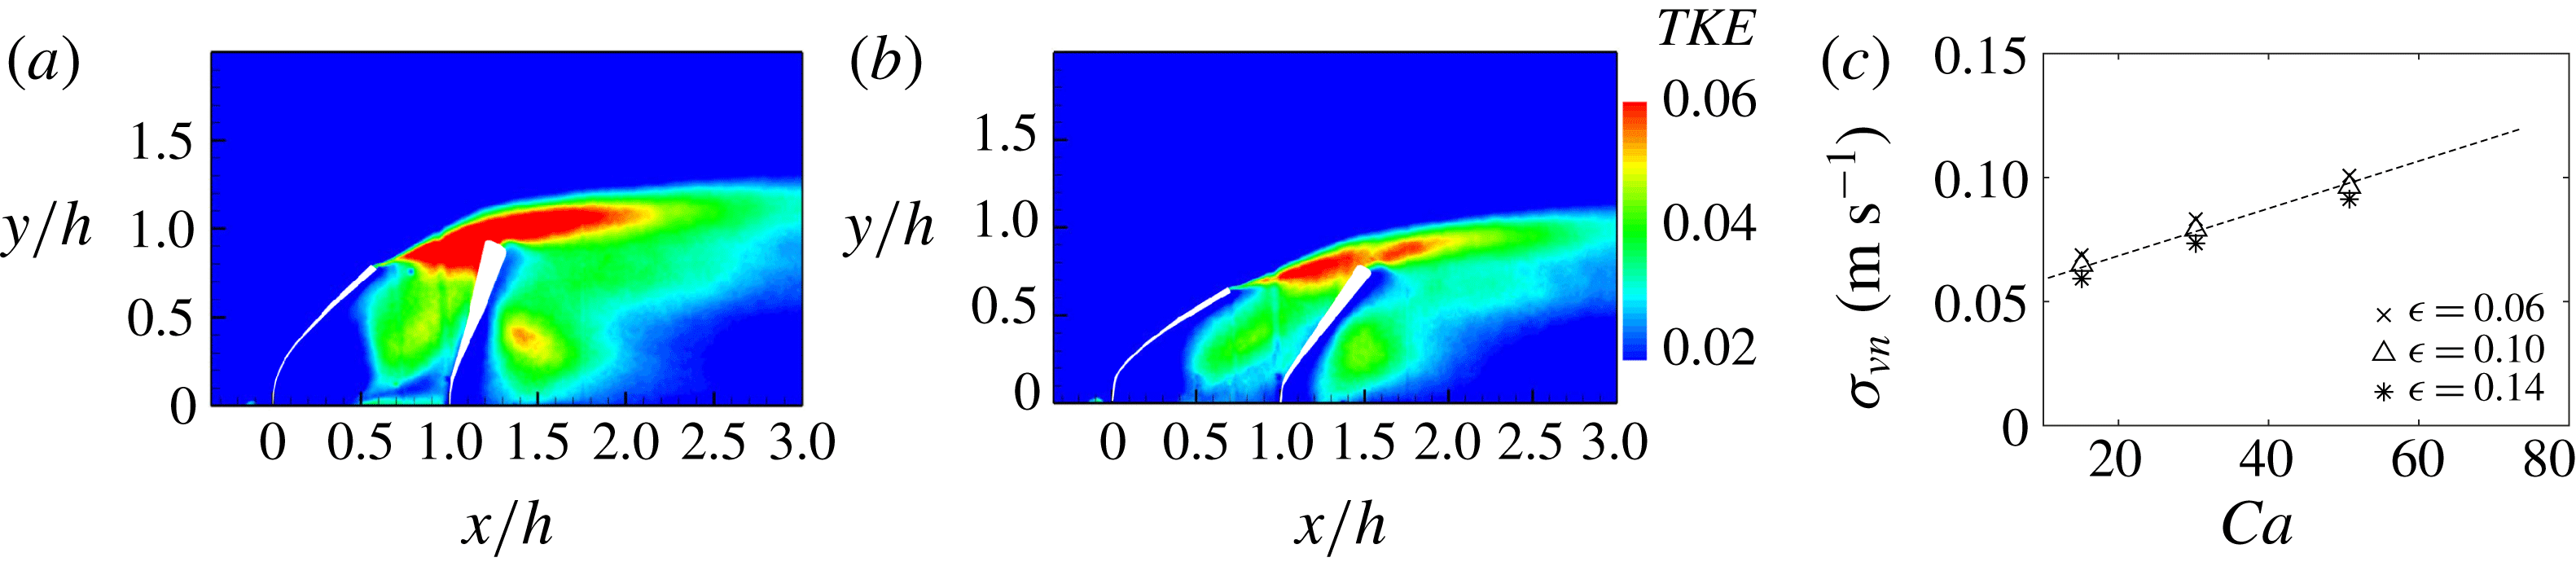
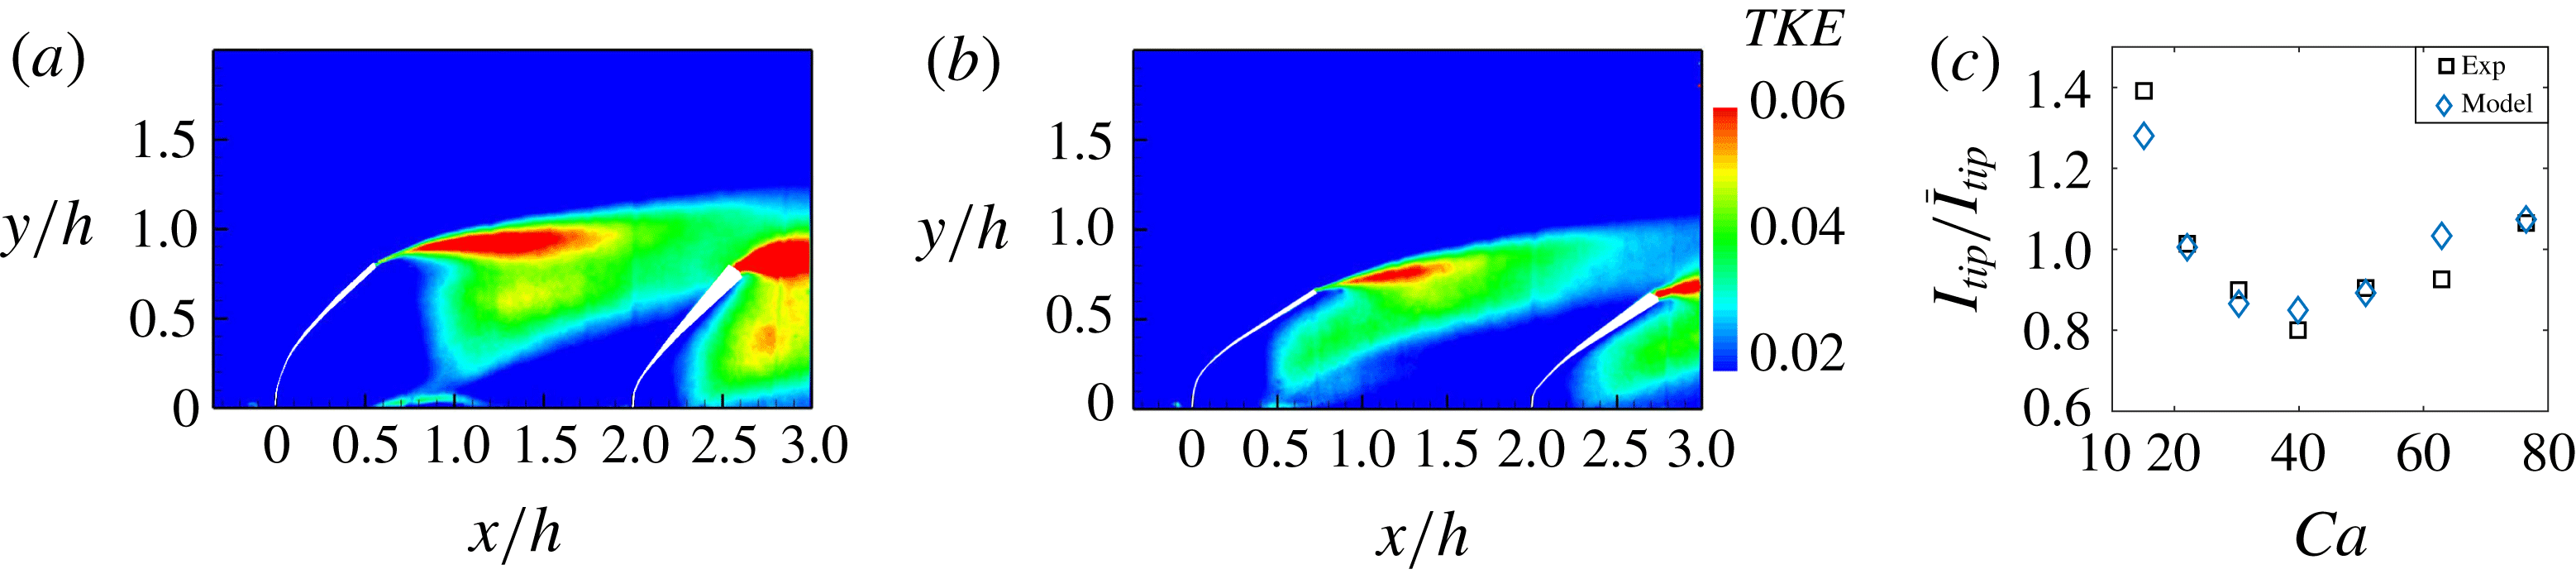
(a) Turbulence kinetic energy (
 $TKE$
) distribution for
 $Ca=15$
; (b) same as (a) but for
 $Ca=30$
; (c) average intensity of the velocity normal to the plate within a circular region centred at the tip with radius
 $R=\unicode[STIX]{x1D716}h$
for various
 $\unicode[STIX]{x1D716}$
. Cases with
 $s_{x}=1$
.

The concave distribution of the tip vibration intensity deserves a close inspection due its impact on various natural and engineering systems. The dynamics of structures in the wake of other bodies is substantially modulated by the velocity fluctuations and the structure stiffness. In particular, comparatively higher turbulence kinetic energy
 $TKE=(1/2)\langle u^{\prime 2}+v^{\prime 2}\rangle /U_{0}^{2}$
in this two-plate system is located in the vicinity of the tip of
 $P_{d}$
(see two examples in figure 6
a,b). Here, the streamwise (
 $u^{\prime }$
) and vertical (
 $v^{\prime }$
) components of the velocity fluctuations may significantly affect the oscillations of
 $P_{d}$
. If we consider that the dynamics of this plate is driven by the velocity fluctuations perpendicular to the tip vicinity
 $v_{n}$
(namely, normal to the tangent vector of the plate near the tip), a bulk effect is given by the standard deviation
 $\unicode[STIX]{x1D70E}_{vn}$
within a region around the tip; i.e.,
 $\langle q\rangle \propto \unicode[STIX]{x1D70E}_{vn}^{2}$
, where
 $q$
is the fluctuating force. A region around the tip may be considered as a circular domain centred at the tip with radius
 $R=\unicode[STIX]{x1D716}h$
with
 $\unicode[STIX]{x1D716}\ll 1$
. Here,
 $\unicode[STIX]{x1D716}=0.1\pm 0.04$
showed a very consistent trend for estimating
 $\unicode[STIX]{x1D70E}_{vn}$
, which increased linearly with
 $Ca$
(see figure 6
c).
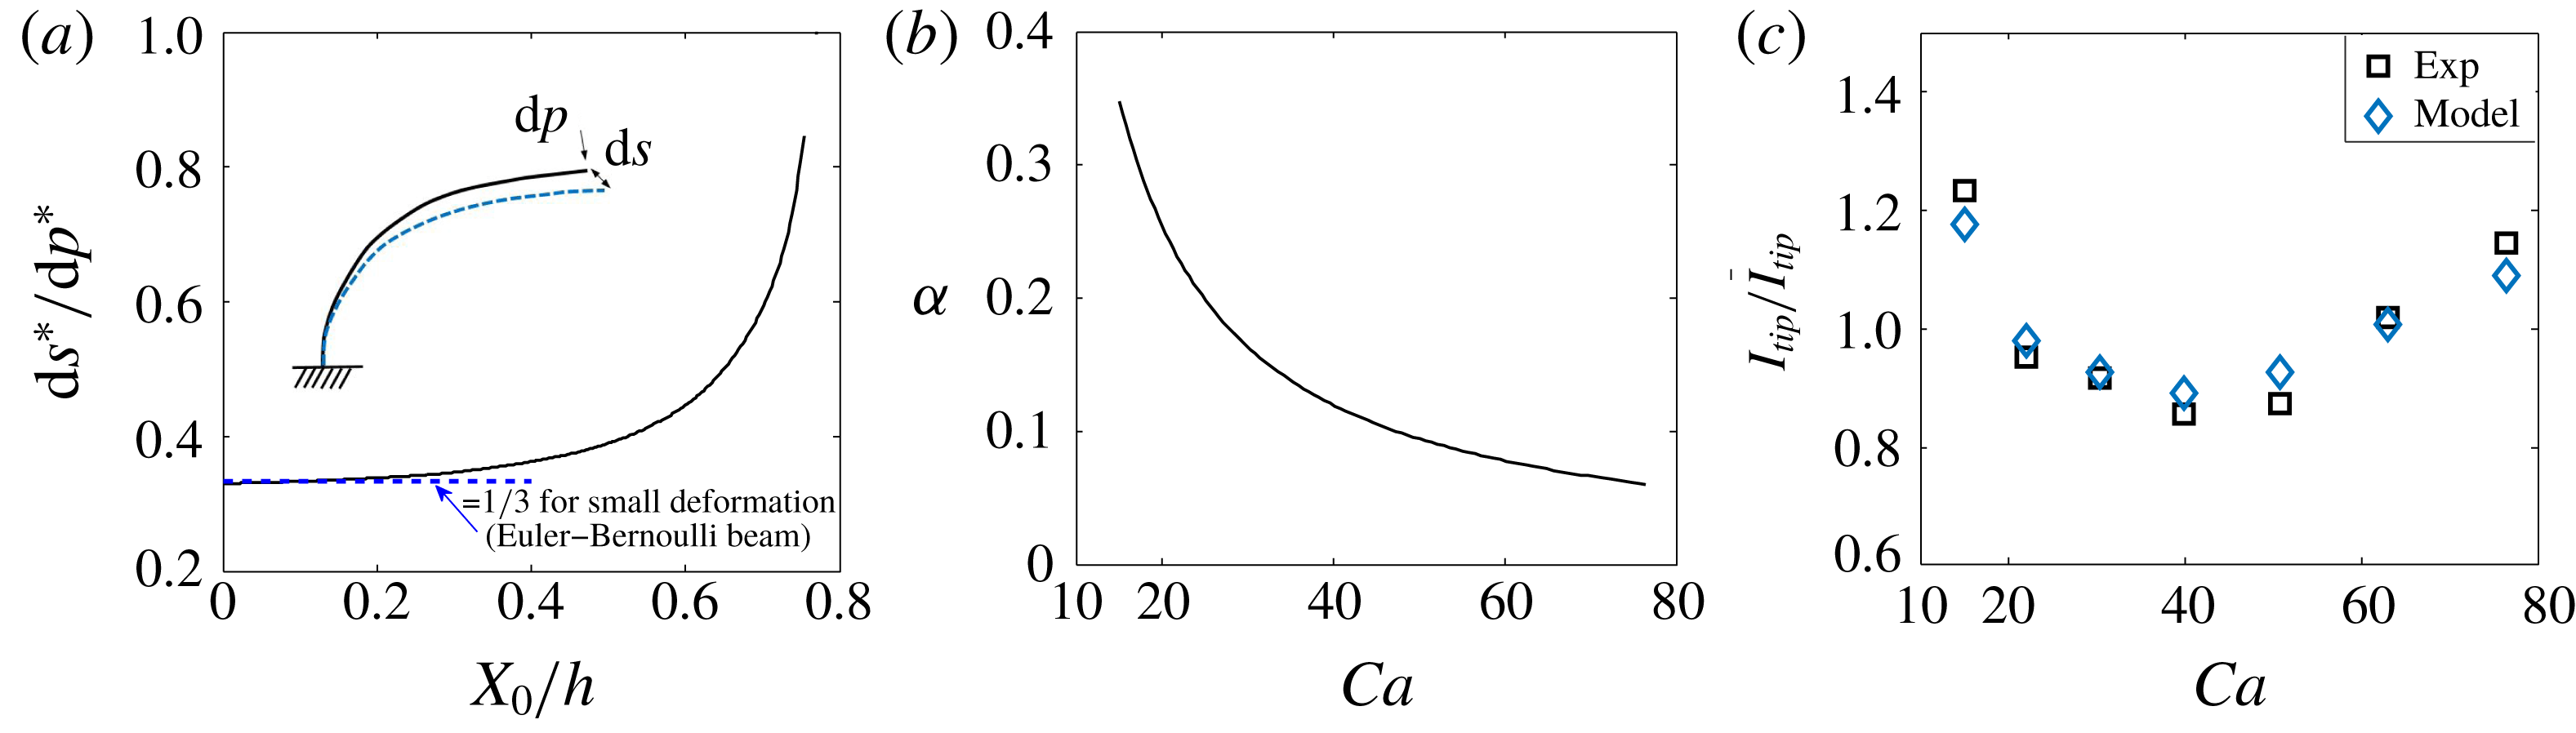
(a) Local bending stiffness
 $\text{d}s^{\ast }/\text{d}p^{\ast }$
as a function of
 $X_{0}/h$
; (b) driven-harmonic-oscillator frequency response function
 $\unicode[STIX]{x1D6FC}$
for the plate across
 $Ca$
; (c) modelled and measured tip oscillation intensity
 $I_{tip}/\bar{I}_{tip}$
. Cases with
 $s_{x}=1$
.

Now, the model by Chen (Reference Chen2010) shows that for sufficiently large external forcing, a cantilever beam may undergo large deformation with strong nonlinear behaviour of the tip displacements. This model is used to estimate the differential tip displacement
 $\text{d}s$
as a result of a differential force
 $\text{d}p$
normal to the tip (
 $\text{d}s/\text{d}p$
) for a given mean streamwise deformation of the structure
 $X_{0}$
. This is illustrated in figure 7(a) in non-dimensional form; i.e.,
 $\text{d}s^{\ast }/\text{d}p^{\ast }=\text{d}s/\text{d}p(EI/h^{3})$
as a function of
 $X_{0}/h$
. Note that for small plate deformation
 $\text{d}s^{\ast }/\text{d}p^{\ast }\rightarrow 1/3$
, which agrees with that from the Euler–Bernoulli beam theory. It is also worth stressing the distinctive increase of
 $\text{d}s^{\ast }/\text{d}p^{\ast }$
for
 $X_{0}/h>0.5$
, which facilitates the occurrence of large-amplitude oscillations. As inferred from figure 5(d), the dynamics of
 $P_{d}$
is strongly modulated by the vortex shedding frequency from
 $P_{u}$
. This modulation may be thought as a case of a driven harmonic oscillator (DHO); consequently, the shedding frequency defines the response function of the steady-sate solution of the DHO, as follows:
 $$\begin{eqnarray}\unicode[STIX]{x1D6FC}=\frac{1}{\sqrt{(1-\unicode[STIX]{x1D6FE}^{2})^{2}+(2\unicode[STIX]{x1D709}\unicode[STIX]{x1D6FE})^{2}}},\end{eqnarray}$$
where
 $\unicode[STIX]{x1D6FE}=f_{v}/f_{n1o}\approx StU_{0}b/f_{n1o}$
is the frequency ratio. Then, as
 $f_{v}$
departs from
 $f_{n1o}$
with increasing
 $Ca$
, the response function
 $\unicode[STIX]{x1D6FC}$
decreases monotonically (figure 7
b). Hence, the combined effect of the flow fluctuations, structure stiffness and dominant shedding frequency on
 $I_{tip}$
of
 $P_{d}$
can be approximated as:
 $$\begin{eqnarray}I_{tip|_{P_{d}}}\propto \unicode[STIX]{x1D70E}_{vn}^{2}\frac{\text{d}s^{\ast }}{\text{d}p^{\ast }}\unicode[STIX]{x1D6FC}.\end{eqnarray}$$
Figure 7(c) illustrates the estimated and measured
 $I_{tip}$
, normalized with the mean value
 $\bar{I}_{tip}$
across
 $Ca$
. It shows a good trend which explains the concave behaviour of
 $I_{tip}$
; namely, for relatively low
 $Ca$
,
 $\text{d}I_{tip}/\text{d}Ca<0$
is governed by the comparatively fast reduction of
 $\unicode[STIX]{x1D6FC}$
, whereas for relatively high
 $Ca$
,
 $\text{d}I_{tip}/\text{d}Ca>0$
is modulated by nonlinear effects of the structure bending (
 $\text{d}s^{\ast }/\text{d}p^{\ast }$
).
(a) Time-averaged tip position (
 $X_{0},Y_{0}$
) of the upstream (
 $P_{u}$
) and downstream (
 $P_{d}$
) plates for
 $Ca\in [15,77]$
; (b) streamwise velocity distribution
 $U/U_{0}$
at
 $Ca=15$
; (c)
 $U/U_{0}$
at
 $Ca=30$
. Cases with
 $s_{x}=2$
.

(a) Intensity of the tip motions
 $I_{tip}$
across
 $Ca$
for the two plates; (b) cross-correlation function
 $\unicode[STIX]{x1D6FE}_{p_{u},p_{d}}(\unicode[STIX]{x1D70F})$
for selected
 $Ca$
; (c) 2D compensated spectra of the tip displacements of the
 $P_{u}$
plate; (d) same as (c) for the
 $P_{d}$
plate. Cases with
 $s_{x}=2$
.

(a) Turbulence kinetic energy (
 $TKE$
) distribution for
 $Ca=15$
; (b) same as (a) but
 $Ca=30$
; (c) modelled and measured tip oscillation intensity
 $I_{tip}/\bar{I}_{tip}$
. Cases with
 $s_{x}=2$
.

3.3 Interaction of the plates with large separation,
$s_{x}=2$

Increasing the plate separation to
 $s_{x}=2$
resulted in substantial recovery of the flow impinging
 $P_{d}$
; as a result, both plates exhibited minor differences in
 $\boldsymbol{X}_{0}$
across
 $Ca$
(see figure 8
a). Like the
 $s_{x}=1$
cases, the
 $P_{d}$
was fully within the wake (figure 8
b,c). In general, the distinctive trends of
 $I_{tip}$
for
 $P_{u}$
and
 $P_{d}$
are similar to those of the
 $s_{x}=1$
cases (figure 9). However, that for
 $P_{d}$
was lower at relatively high
 $Ca$
due to a reduced effect of the wake fluctuations
 $\unicode[STIX]{x1D70E}_{vn}$
near the tip. Indeed, distinctive differences of the
 $TKE$
near the tips are evident in figures 10(a) and 10(b); this phenomenon is also predicted by the model based on (3.3) (figure 10
c). The large separation equivalent to 8 times the plate width resulted in very weak coupling dynamics between
 $P_{u}$
and
 $P_{d}$
(figure 9
b). Like the other configurations,
 $P_{u}$
was dominated by frequencies close to
 $f_{n1}$
across
 $Ca$
(figure 9
c). This evidences that broadband flow fluctuation in the very near wake region of the flexible plate is more significant than the vortex shedding in streamwise-dominated oscillations. Comparatively,
 $P_{d}$
was modulated by both vortex shedding and the natural frequency (figure 9
d); this is possibly due to a weakening of the coherence of the vortex shedding in this relatively long separation compared to
 $s_{x}=1$
.
4 Remarks
Inspection of the plate motions and surrounding flow provided new quantitative insight towards uncovering the complex dynamics of flexible structures in tandem. The analysis revealed the distinctive modulation of the upstream plate on the dynamics of the downstream plate. For the various
 $Ca$
and
 $s_{x}$
explored, the oscillations of the upstream plate were, in general, governed by its natural frequency, whereas the downstream plate also presented a clear footprint of vortex shedding. Interestingly, the downstream plate exhibited an oscillation intensity with a concave distribution as a function of
 $Ca$
for intermediate and large separations (
 $s_{x}=1,2$
). This is due to a combination of multiple factors, including the velocity fluctuations, vortex shedding and substantial geometrical nonlinearities induced by large-amplitude deformation. This is explained via a simple model. As pointed out by Luhar & Nepf (Reference Luhar and Nepf2011), the aspect ratio, stiffness and mass ratio are also important factors defining the dynamics of flexible structures. The characteristic impact of each of these factors in the unsteady dynamics of structures is out of the scope of this work and deserves close inspection.
Acknowledgements
This work was supported by the Department of Mechanical Science and Engineering, University of Illinois at Urbana-Champaign, as part of the start-up package of L.P.C.