Implications
Developing an automatic lameness diagnosis algorithm will benefit animals, producers, and veterinarians in timely and effective lameness detection among individual sows before clinical signs are apparent, as well as aid producers in their efforts to decrease herd lameness by selecting animals that are less prone to become lame. Being able to predict sow lameness can aid in delivering maximum animal health and welfare benefits, improving sow lifetime productivity and optimizing sow farm labor.
Introduction
Lameness is defined as ‘impaired movement or deviation from normal gait’ (Wells, Reference Therneau, Atkinson and Ripley1984). Locomotor disorders can be associated with neurological disorders, lesions on the hoof or limb, a mechanical-structural problem, trauma, or metabolic and infectious diseases (Wells, Reference Therneau, Atkinson and Ripley1984; Smith, Reference Rothschild and Christian1988). A cull sow evaluation by Knauer (Reference Keegan, Dent, Wilson, Janicek, Kramer, Lacarrubba, Walsh, Cassells, Esther, Schiltz, Frees, Cl, Clark, Pollitt, Shaw and Norris2006) found that 85% of sows evaluated postmortem had at least one lesion impacting at least one foot. The same authors (Knauer, Reference Keegan, Dent, Wilson, Janicek, Kramer, Lacarrubba, Walsh, Cassells, Esther, Schiltz, Frees, Cl, Clark, Pollitt, Shaw and Norris2006) further noted that lameness is a common reason why sows leave the breeding herd (10.6% of removals for parity 1 and 2 sows), typically following reproductive failure and body condition. However, many sows reportedly culled for reproductive failure may have been culled as a result of lameness that occurred earlier in the sows’ life cycle.
The high lameness incidence can result in a large profit loss for swine operations due to the sows’ early removal from the breeding herd before they have paid for themselves and mortalities that result in no salvage value for cull sows (Stalder et al., Reference Smith2000; Anil et al., Reference Anil, Anil and Deen2005). Additionally, costs associated with treating sow lameness and reduced production (Fitzgerald et al., 2012) further reduce the sow farm’s production efficiency. The reduced production results from reduced feed intake which impacts piglet weaning weight and pre-weaning mortality resulting in fewer full value pigs at weaning (Fitzgerald et al., 2012). Increased labor required to treat and remove lame sows is another expense to the swine operation. Impaired worker morale occurs when a large amount of time is spent removing sows due to euthanasia or mortality. Combined, the reduced productivity and increased expense associated with lame breeding herd animals reduces the sow farm’s production efficiency, increases production costs and decreases overall profitability. Deen (Reference Deen2009) estimated the total cost associated with a lameness diagnosis to be $230.84.
Identifying a sow during early lameness can allow producers to retain the sow’s salvage value or provide more timely and effective treatment options for the sow. Currently, sow lameness is scored using subjective visual identification methods (Zinpro, Reference Welsh, Gettinby and Nolan2008). Visual scoring methods require substantial training time to allow individuals to become both accurate and proficient when evaluating breeding herd females for lameness. With high employee turnover rates, this can become costly and inefficient because barn workers are constantly in a training state for lameness detection. Visual score methods require substantial education time for untrained individuals to become accurate and precise when identifying lameness.
Few swine research projects have attempted to detect lameness before it is clinically apparent using visual observation methods. An objective identification method is needed to identify sows during early lameness stages potentially when lameness is undetectable by visual identification methods. Early in the lameness process, sows will change the magnitude of the difference in weight distribution between legs (side-to-side, front-to-back and contra-laterally) and will change their gait (Karriker et al., Reference Kaler, Wassink and Green2013). Using technologies to detect leg weight distribution differences can allow an objective, lameness detection method to be developed.
Detecting lameness before clinical signs are visually apparent or evident will allow producers to cull females while they still have salvage value rather than allowing lameness to progress where treatment delays marketing or where lameness results in mortality or necessitates euthanasia. The objective of this study was to compare the predictive abilities and accuracies of weight distribution and gait measures relative to each other and to a visual lameness detection method when detecting induced lameness among multiparous sows.
Material and methods
Sows were housed and fed individually according to the Swine Care and Use Guidelines (Federation of Animal Science Society, Reference Evans, Horstman and Conzemius1999), and protocols were reviewed and approved by the Iowa State University Animal Care and Use Committee before conducting experimental work. Twenty-four multiparous sows derived from the Large White breed with mean weight 155±33 kg were used in this study. The sows’ average parity was 2.5±1.1 and the parity range was from 1 to 4. One day before lameness induction, weight distribution measurements, gait measurements while sows were walking, and a visual lameness score were collected for each sow to determine a baseline ‘sound’ value for all measurements. The 24 sows were injected with 10 mg amphotericin B in the distal inter-phalangeal joint at one of four injection sites (left front toes, right front toes, left rear toes and right rear toes) according to the methods outlined in Karriker et al. (Reference Kaler, Wassink and Green2013). The injection site was randomly assigned to each sow. The injection resulted in synovitis, or synovial membrane inflammation, causing the sows to become lame. Sows injected in rear feet did not completely resolve lameness until after 6 days post-injection (DPI), while sows injected in front feet appeared to resolve lameness by DPI 6 (Karriker et al., Reference Kaler, Wassink and Green2013). For this study, a sow’s foot was considered to be lame after it was injected with amphotericin B and clinical lameness signs were observed.
The sows’ weight distribution on each foot was measured using a microcomputer-based force plate for 9 days following lameness induction (Sun et al., Reference Stalder, Lacy, Cross, Conaster and Darroch2011) and sows were scored for lameness using a visual analog scale. Additionally, each sow’s walking gait was evaluated using the GaitFour pressure mat walkway system (CIR Systems Inc., 2013) on DPI 1 and 6. The GaitFour system has been adapted for quadrupeds from the GaitRite walkway system which was designed for humans, or bipeds. Both systems collect the same measurements in the same manner. Each sow was injected a second time in the lateral joint compared with their first lameness induction during the second treatment replication and subsequent measurements were recorded. This resulted in 48 lameness events (24 sows×2 replications) with weight distribution measurements.
For the measurements collected using the microcomputer-based force plate (Sun et al., Reference Stalder, Lacy, Cross, Conaster and Darroch2011), the weight distribution was measured two times per second for 15 min each day. The force plate was developed as an objective tool to detect sow lameness by measuring the weight placed on each foot and monitoring the sows’ weight distribution between the four feet. Since sows place a disproportionate amount of their weight on their front feet, the data were analyzed separately based on which body half (front or rear) was induced lame. Weight distributions and gait measurements on the two feet from the body half of the sow where lameness was induced were analyzed with one foot labeled lame and the other labeled sound. The variables analyzed for each collection period were the mean weight placed on each foot, the interquartile range (QR), the 5th percentile of weight measurements (P5), the 95th percentile of weight measurements (P95), the standard deviation (s.d.), and the mode. Additionally, the skewness (SKEW) and kurtosis (KURT) of the weight distribution during the collection period was calculated.
Sow lameness was scored using a visual analog scale (Quinn et al., Reference Pastell, Hautala, Poikalainen, Praks, Veermae, Kujals and Ahokas2007). Scorers were asked to indicate degree of sow lameness on a 10 cm line with 0 cm being completely sound with no lameness indications or signs and 10 cm being completely lame and non-weight bearing. The scores were recorded using the millimeter distance from 0. All 24 sows were scored each day by at least two scorers; scorers were aware of the sow’s lameness stage relative to the injection day. This was unavoidable due to personnel availability.
Additionally, each sows’ gait was evaluated while walking using the pressure mat on DPI 1 and 6. The GaitFour walkway system was designed in order to assess gait patterns and behaviors by quantifying footfall measurements. Gait measurements captured while the sow was walking on the pressure mat were recorded for three walking events each day. The active walkway was 0.76×4.27 m2. The sow walked across the pressure mat walkway system repeatedly until three acceptable walking events occurred. All 13 824 sensors in the pressure mat collected data at 120 Hz. A walking event was considered acceptable if the sow maintained a fluid motion while walking across the walkway without running and/or stopping at any point during the recording process. The gait measurements used in the analysis were stride length (cm, STRL), stance time (s, STAT), stride time (s, STRT), maximum pressure (kg/cm2, MP), and number of sensors (NS). Stride length was defined as the distance between each consecutive step made by the same foot. Stance time was the amount of time from the first activation of a sensor until all sensors are no longer activated during given step. Stride time was defined as the time between two successive steps of the same foot. Maximum pressure was defined as the maximum weight placed on a given foot each step. Number of sensors was defined as the number of sensors activated by a step from a given foot. This variable is relevant to lameness detection because lameness could alter the way a sow contacts the pressure mat with each step (especially on a lame hoof). Therefore, the number of sensors activated could indicate lameness.
When evaluating weight distributions and visual lameness scores, a mixed model analysis (SAS, Cary, NC, USA) was conducted to determine at what day the measurements were no longer able to detect lameness in the sows relative to injection day (P>0.05). The model used can be written as:
 $${\bf y}\,=\,{\bf X}{\bf b}\,{\rm {\plus}}\,{\bf Z}{\bf u}\,{\rm {\plus}}\,{\bf e}$$
where y is the vector of observations, b is the vector of fixed effects, u is the vector of random effects, e is the vector of residual effects and X and Z are known incidence matrices. When analyzing visual lameness data, the interaction between the injected feet pair (front or rear) and day relative to injection was fitted as the fixed effect (b), and sow and scorer within date were fitted as random effects (u). When the weight distribution data were evaluated, the three-way interaction between body half injected, day relative to injection, and lameness status was fitted as the fixed effect in the model (b), and sow was fitted as a random effect (u). To analyze the gait measurements captured while the sows were walking, the analysis model included the three-way interaction between body half injected, day relative to injection, and lameness status as a fixed effect (b) and sow within day relative to injection and lameness status as a random effect (u). Since sows completed multiple walks each day, walk within a day was considered to be a repeated measurement for each sow.
A classification tree analysis was performed using the rpart package in R (Therneau et al., Reference Sun, Fitzgerald, Hoff, Karriker, Johnson and Stalder2013). In the classification tree analysis, the distribution for each variable is examined for each classification, lame and sound for this study. Variables where the distributions for each classification (i.e. lame or sound) do not overlap explain the largest proportion of variation between classifications. Recursive partitioning is used to determine which variables provide the most informative division for predicting the classification category for each observation. Nodes or decision tests are created to define the variable threshold values within each test for each lame or sound classification. The threshold values determine at what point or value the animal is declared lame.
The randomForest package (Liaw et al., Reference Knauer2013) was used for a random forest analysis to classify feet as lame or sound. In the random forest analysis, multiple classification trees are created from the data. In this study, 1000 trees were generated. The variables used in the greatest proportion of the trees created are considered to be the most informative for prediction. The response variable in both analyses was foot status (lame or sound). The relative importance of each variable in the random forest analysis was evaluated and compared with the variables used in the classification tree. The mean decrease in accuracy quantifies the reduction in error rate observed when a variable is included in the decision tree and was used to measure variable importance in classifying observations as sound or lame.
Multiple analyses were performed where the weight distribution measurements were only included as potential variables in the tree, the gait measurements were only included and both measurements types were included. For the gait measurements, average of the sows’ three daily walking events was used in the analysis. When developing the decision tests, the measurements involving the weight and pressure a sow placed on each foot were expressed as a percentage of the sow’s total BW. Cross-validation was used to determine the predictive ability of the classification trees. This involved removing a single observation from the analysis and predicting the observation based on the remaining observations. This process continued until all observations were removed and predicted by the remaining data. Error rates were calculated as the number of incorrect classifications for the observation predicted using the remaining observations.
Results
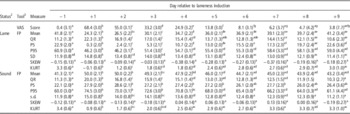
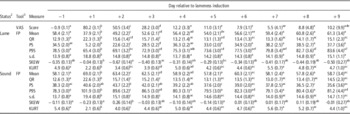
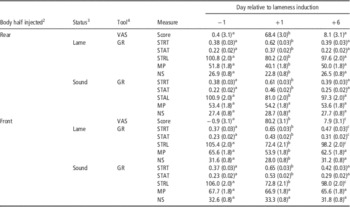
Least squares means for the subjective and objective measurements for sows injected in a rear or front toe are seen in Tables 1 and 2, respectively, for weight distribution measurements. The least squares means for the gait measurements are shown in Table 3. The visual analog scale scores for DPI 1 through 6 were significantly different (P<0.05) from the sound day visual score when a rear or front toe was lame. At DPI 7, the visual score was not significantly different (P>0.05) from the sound day score regardless of which body half (front or rear) was injected. In general, the weight distribution measurements were significantly different when compared with baseline day up to DPI 7 and 4 when a rear and front foot were injected, respectively. The gait measures taken while the sows were walking were significantly different (P<0.05) the day immediately following injection; in general, the measurements were resolved (P>0.05) by DPI 6 regardless of which body half the foot was from (front or rear).
Subjective visual scores and objective weight distribution measures least squares means (standard error) from a study where lameness was induced in the sow’s rear feetFootnote 1

Score=visual score, mm; Mean=mean weight, kg, placed on the foot; QR=interquartile range of the weight, kg, place on each foot; P5=5th percentile of weight, kg, placed on each foot; P95=95th percentile of weight, kg, placed on each foot; s.d.=standard deviation of weight, kg, placed on each foot; SKEW=skewness of weight distribution for each foot; KURT=kurtosis of weight distribution of each foot.
a–gWithin a row, values with different superscripts are significantly different (P<0.05).
1 The model used for each measurement is described in the text.
2 Indicates the status of the foot measured. The 24 sows were injected with 10 mg amphotericin B in the distal inter-phalangeal joint according to the methods outlined in Karriker et al. (Reference Kaler, Wassink and Green2013).
3 Tool indicates which lameness detection tool was used: VAS (visual analog scale) and FP (force plate).
Subjective visual scores and objective weight distribution measures least squares means (standard error) from a study where lameness was induced in the sow’s front feetFootnote 1

Score=visual score, mm; Mean=mean weight, kg, placed on the foot; QR=interquartile range of the weight, kg, place on each foot; P5=5th percentile of weight, kg, placed on each foot; P95=95th percentile of weight, kg, placed on each foot; s.d.=standard deviation of weight, kg, placed on each foot; SKEW=skewness of weight distribution for each foot; KURT=kurtosis of weight distribution of each foot.
a–fWithin a row, values with different superscripts are significantly different (P<0.05).
1 The model used for each measurement is described in the text.
2 Indicates the status of the foot measured. The 24 sows were injected with 10 mg amphotericin B in the distal inter-phalangeal joint according to the methods outlined in Karriker et al. (Reference Kaler, Wassink and Green2013).
3 Tool indicates which lameness detection tool was used: VAS (visual analog scale) and FP (force plate).
Subjective visual scores and objective gait measures least squares means (standard error) from a study where lameness was induced in the sow’s feetFootnote 1

Score=visual score, mm; STRT=stride time, s; STAT=stance time, s; STRL=stride length, cm; MP=maximum pressure, kg/cm2; NS=number of sensors.
a–cWithin a row, values with different superscripts are significantly different (P<0.05).
1 The model used for each measurement is described in the text.
2 Indicates which body half was injected.
3 Indicates the status of the foot measured. The 24 sows were injected with 10 mg amphotericin B in the distal inter-phalangeal joint according to the methods outlined in Karriker et al. (Reference Kaler, Wassink and Green2013).
4 Tool indicates which lameness detection tool was used: VAS (visual analog scale) and GR (GaitFour walkway system).
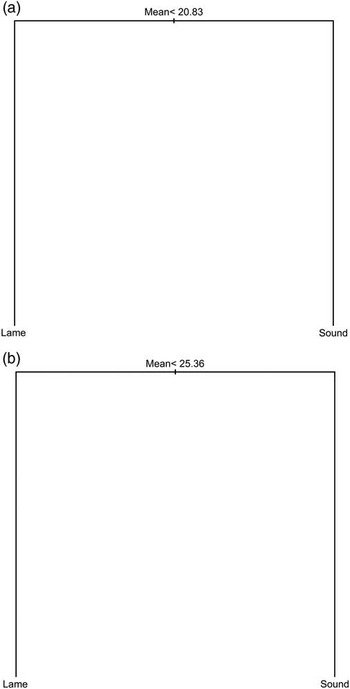
Both classification trees generated using the force plate measurements for rear and front feet injected on DPI 1 have a single node. The statement used for classification for a rear foot is if the mean total BW percentage placed on the foot (mean) is <20.8%, then the foot should be classified as lame. If the mean total BW percentage placed on the foot (mean) is ⩾20.8%, then the foot should be classified as sound. A similar classification statement is used for a front foot using 25.4% as the threshold value. Regardless of which body half (front or rear) was injected, the only variable in the tree was mean total BW percentage placed on the foot. This indicates that, on average and as expected, the sows placed less weight on the lame foot compared with the sound foot. The larger threshold for the front foot injected tree is a result of the weight a sow places on her front legs compared with her rear legs (Figure 1).
(a) Lameness induced in rear foot; (b) Lameness induced in front foot. Classification tree to detect lameness at day 1 post-injection using measurements collected from the microcomputer-based embedded force plate system to detect induced sow lameness. The 24 sows were injected with 10 mg amphotericin B in the distal inter-phalangeal joint at one of four injection sites (left front toes, right front toes, left rear toes, and right rear toes) according to the methods outlined in Karriker et al. (2013). Variables included in analysis were Mean (mean total body weight percentage placed on the foot), QR (interquartile range of the body weight percentage place on each foot), P5 (5th percentile of body weight percentage placed on each foot), P95 (95th percentile of body weight percentage placed on each foot), SD (standard deviation of body weight percentage placed on each foot), SKEW (skewness of body weight percentage distribution for each foot), and KURT (kurtosis of weight distribution of each foot). If the statement at the node is true, this tree directs to the left branch, otherwise the tree directs to the right branch. The classifications are the leaves at the bottom of the branches.

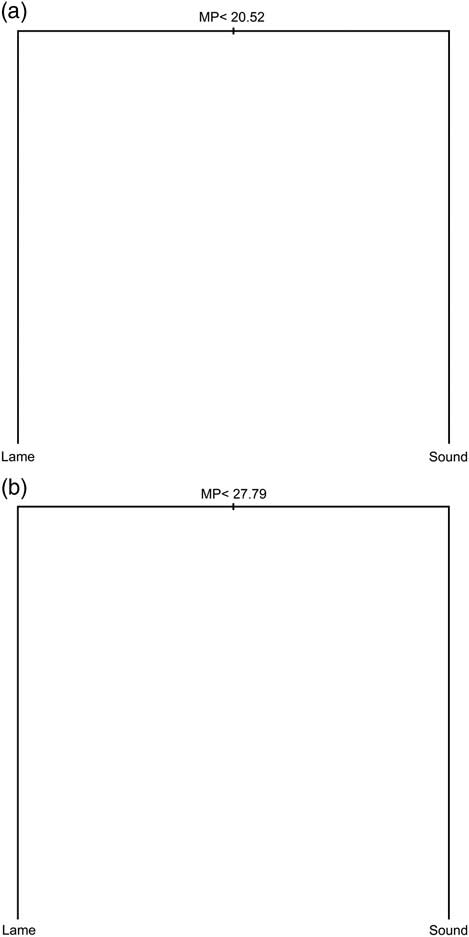
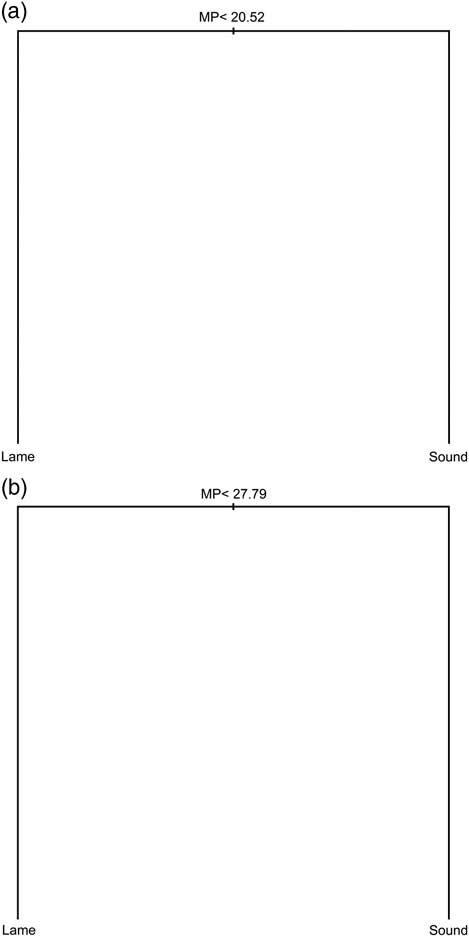
Both classification trees generated using the pressure mat measurements for rear and front feet injected on DPI 1 have a single node with maximum pressure as a percentage of total BW being the decision variable. This is in agreement with the decision variable in the weight distribution trees. The threshold values for the classification statements are 20.5% and 27.8% for rear and front feet, respectively (Figure 2). When a classification tree was developed using both the weight distribution information and the gait information, the resulting tree used the same decision variables and threshold values as the weight distribution classification tree for DPI 1 and 6 regardless of which body half (front or rear) was injected. Thus, the tree and associated error rates are identical to the results found when the force plate measurements were analyzed alone. This indicates that the weight distribution measurements have higher predictive ability to detect lameness compared with the gait measures.
(a) Lameness induced in rear foot; (b) Lameness induced in front foot. Classification tree to detect lameness at day 1 post-injection using measurements collected from the pressure mat walkway system to detect induced sow lameness. The 24 sows were injected with 10 mg amphotericin B in the distal inter-phalangeal joint at one of four injection sites (left front toes, right front toes, left rear toes, and right rear toes) according to the methods outlined in Karriker et al. (2013). Variables included in analysis were STRT (stride time, s), STAT (stance time, s), STRL (stride length, cm), MP (maximum pressure as a percentage of total body weight), and NS (number of sensors). If the statement at the node is true this tree directs to the left branch, otherwise the tree directs to the right branch. The classifications are the leaves at the bottom of the branches.
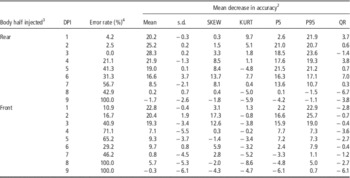
The error rates for the weight distribution and gait classification trees by day relative to lameness induction are shown in Tables 4 and 5. The weight distribution trees were able to classify the lame and sound feet with <5% error the first 3 days following lameness induction when a rear foot was injected. However, it is more important to detect lameness several days after lameness induction when clinical signs may not be as readily apparent and may be more like the onset for a lameness challenge that is just beginning to occur on a breeding female in a commercial herd setting. The cross-validation error rate was <50% up to DPI 6 and 8 when a rear foot was injected and up to DPI 3 and DPI 6 and 7 when a front foot was injected. By DPI 9 for rear injected sows and DPI 8 for front injected sows, the classification trees were not able to accurately predict any of the observations when the observation was not included in the development of the tree. Because the treatments used in the present study involved injecting one foot (i.e. left or right) within the sow’s two foot pairs (i.e. front or rear feet), the maximum error rate based on classifying individual feet as lame or sound would be 50%. In this case, the classification tree would have only a single node and all observations would be given the same classification. The errors rates presented in this study are associated with the cross-validation method described above and thus, are based on the number of correctly classified observations, when the observation was not included in the tree development. Therefore, the maximum error rate is 100%, meaning that no observations were correctly classified.
Classification tree error rates and mean decrease in accuracy for each weight distribution variable used to detect induced sow lamenessFootnote 1

DPI=days post-injection.
Variables included in analysis were mean – mean total BW percentage placed on the foot; QR=interquartile range of the BW percentage place on each foot; P5=5th percentile of BW percentage placed on each foot; P95=95th percentile of BW percentage placed on each foot; s.d.=standard deviation of BW percentage placed on each foot; SKEW=skewness of BW percentage distribution for each foot; KURT=kurtosis of weight distribution of each foot.
1 The 24 sows were injected with 10 mg amphotericin B in the distal inter-phalangeal joint at one of four injection sites (left front toes, right front toes, left rear toes, and right rear toes) according to the methods outlined in Karriker et al. (Reference Kaler, Wassink and Green2013).
2 The mean decreases in accuracy for each variable should be compared within row and ranked from largest to smallest. The mean decrease in accuracy was calculated using the randomForest package in R.
3 Indicates in which body half (front or rear) the sow was injected.
4 The error rate is the percent of misclassifications when using the decision tree generated. The decision tree was developed using the rpart package in R.
Classification tree error rates and mean decrease in accuracy for each gait measurement used to detect induced sow lamenessFootnote 1

DPI=days post-injection.
Variables included in analysis were stride time, stance time, stride length, maximum pressure as a percentage of total BW and number of sensors.
1 The 24 sows were injected with 10 mg amphotericin B in the distal inter-phalangeal joint at one of four injection sites (left front toes, right front toes, left rear toes and right rear toes) according to the methods outlined in Karriker et al. (Reference Kaler, Wassink and Green2013).
2 The mean decreases in accuracy for each variable should be compared within row and ranked from largest to smallest. The mean decrease in accuracy was calculated using the randomForest package in R.
3 Indicates in which body half (front or rear) the sow was injected.
4 The error rate is the percent of misclassifications when using the decision tree generated. The decision tree was developed using the rpart package in R.
In general, the weight distribution trees had a greater predictive ability to detect lameness compared with the gait measures captured on the sows. The duration of data collection for each observation point in the two systems was different (force plate: 15 min, pressure mat: <1 min). Because of this, the static force plate system may have a preferential bias to detect lameness compared with the dynamic measurements recorded with the pressure mat. If the gait measurements had been collected over 15 min as was the case with the weight distribution measurements, the gait measurements may have had a higher predictive ability than reported in this study.
The mean decrease in accuracy for each variable included in the analysis for the force plate and pressure mat measurements are in Tables 4 and 5, respectively. Based on the results seen in Table 4, it is clear that the mean total BW percentage and the 5th and 95th percentiles for total BW percentage placed on each foot were consistently important variables when classifying lameness regardless of which body half (front or rear) was injected. The results in Table 5 indicate that maximum pressure as a percentage of total BW is most informative for detecting lameness regardless of which body half (front or rear) was injected. For most of the variables, the mean decrease in accuracy became negative at day 6, indicating a decrease in the predictive ability for the gait measures.
Discussion
There are numerous methodologies that can be employed to subjectively and objectively measure and evaluate the relative degree of lameness for an individual animal at a given point in time. Subjective lameness detection systems are designed to categorize lameness expressed while the animal is walking and have been developed for cows (Manson and Leaver, Reference Main, Clegg, Spatz and Green1988), dogs (Quinn et al., Reference Pastell, Hautala, Poikalainen, Praks, Veermae, Kujals and Ahokas2007), sheep (Welsh et al., Reference Wells1993; Kaler et al. Reference Grégoire, Bergeron, D’Allaire, Meunier-Salaün and Devillers2009), horses (Keegan et al., Reference Karriker, Abell, Pairis, Holt, Sun, Coetzee, Johnson, Hoff and Stalder2010) and finishing pigs (Rothschild and Christian, Reference Quinn, Keuler, Lu, Faria, Muir and Markel1988; Main et al., Reference Liaw, Wiener, Breiman and Cutler2000). The scoring systems used in the livestock industries have been implemented so that caretakers can quickly and affordably quantify lameness prevalence in the herd on any particular day. However, there can be disagreement between the lameness score assigned to an individual animal (Flower and Weary, Reference Fitzgerald, Stalder, Karriker, Sadler, Hill, Kaisand and Johnson2006). This disagreement is the result of either inter- or intra-scorer variation, meaning that different scorers may provide different scores for the same animal or that the same individual may provide different scores when scoring the same animal twice. An objective and standardized method for assigning lameness scores to an animal would likely be more accurate when compared with subjective scoring measures and provide producers with a useful tool to assess lameness, resulting in more timely identification and treatment of lame sows.
One such method that shows promise is the force plate measurement system. This device quantifies the amount of force each limb applies to the assessment tool surface (Pastell et al., Reference Pastell and Kujala2008). Force plate measurement systems can measure variables that have been associated with objectively classifying structural abnormalities into lameness scores. An animal will distribute less weight on the limb(s) that is(are) painful or structurally unsound (Corr et al., Reference Corr, McCorquodale, McGovern, Gentle and Bennett2003). The use of such equipment has been evaluated in other species such as dogs (Evans et al., Reference Deen2005), chickens (Corr et al., Reference Corr, McCorquodale, McGovern, Gentle and Bennett2003) and dairy (Pastell and Kujala, Reference Morrow, Rothschild, Draper and Christian2007).
In this study, the results from the visual analog scale indicated that scorers were able to distinguish a difference between the baseline sound animals and lame animals up to DPI 7 and 9 for sows injected in the rear and front feet, respectively. Since this was not a blind study, visual scores may be biased by scorer’s knowledge of the sow’s lameness stage. This bias would place an advantage to the visual lameness detection, which suggests that the objective measurements used in this study are performing up to a level comparable to the best possible detection level of the visual identification method. A similar bias would be expected if a numerical rating system had been used. To evaluate the ability of this visual lameness scoring method to distinguish between lame and sound animals in an unbiased manner, a blind study should be conducted. However, the objective of this study was to demonstrate that the objective measurements have the ability to detect lameness similar to the visual analog scale. Based on the bias of the visual scores, the observed differences between the visual scoring and objective measures would be conservative estimates of the true differences. In reality, lameness scorers would have no prior knowledge of the sow lameness status, likely making the differences between the visual scores and the objective measures as large as or larger than the differences detected in this study.
The objective force plate measures were able to detect a difference between baseline sound animals and lame animals up to DPI 7 and 4 for rear and front toes injected, respectively. While the force plate measurements were not able to detect lameness for a longer time period after lameness induction compared with the visual identification method, the force plate was still able to detect lameness, and implementing a lameness diagnosis algorithm using the force plate would not require the training time and effort that is associated with using visual appraisal. If the visual scorers did not have prior knowledge of the sows’ lameness, the force plate measures may have outperformed the visual identification method when detecting sow lameness.
For the pressure mat, all measurements resolved by DPI 6 with the exception of stride length when injection occurred in the sow’s front toe. This may indicate a need to evaluate the pressure mat measurements for a longer time period post-lameness induction to determine when stride length resolves. Since stride length can be observed by an individual, this may be a measurement that does not resolve before the visual scores indicate that lameness has resolved. Grégoire et al. (Reference Flower and Weary2013) reported that lame sows tend to have shorter stride lengths, walk slower and have a longer stance time when compared with non-lame sows which agrees with the current study. Additionally, boars selected for poor front leg structure had significantly short stride length compared with boars selected for desirable front leg structure (Morrow et al., Reference Manson and Leaver1991).
The results of this study indicate that the objective tools in this analysis can detect lameness and provide a way to classify lame and sound animals, and the measurements taken using the pressure mat and force plate change with varying lameness severity. Understanding which measurements are most important when classifying lameness will allow for development of an algorithm to detect lameness based on objective measurements. Using objective measurements will remove the differences between scorers and provide a more uniform method to detect sow lameness.
The decisions tests developed from the weight distribution measurements had a lower error rate when sow lameness was more severe when compared with the decision tests developed from the gait measurements. However, the error rates converged as lameness severity decreased. The classification trees associated with the gait measurements used similar decision tests as the weight distribution trees, but had higher error rates. Since the combined classification tree with both types of measures only used weight distribution measurements as decision variables, there is evidence that the weight distribution measurements are more informative than the gait measures.
Comparing day-to-day weight distribution differences could allow for detecting lameness in sows. This could account for the variation between sows. However, if a prediction method is implemented into a new herd, there would not be any prior information at the time of implementation. A baseline value would need to be established for each sow before lameness could be detected, which means sows would need to be sound when introduced to the force plate system.
The results of this study indicate that the force plate was able to identify sow lameness by separately measuring the weight each sow is willing to bear on each leg. Using the force plate in conjunction with the lameness detection tree created from this study can aid swine producers in detecting lame sows, and thus, improve management decisions in relation to lame animals. The force plate could be incorporated into an electronic feeding system where sow lameness could be monitored on a daily basis without human interaction. More timely lameness detection could result in more treatable lameness, less mortality and euthanasia due to lameness, improved productivity, less treatment expense, and greater production efficiency and profitability for the sow operation.
Acknowledgements
The funding for this project was provided in part by the Iowa Pork Producers Association, the National Pork Board, and the Iowa Livestock Health Advisory Council. The authors would like to the Becky Parsons and Lori Layman at the sow longevity lab at Iowa State University as well as the graduate students, undergraduate students and summer vet scholars that help with the project.