I. INTRODUCTION
Recently, there has been a keen interest in measuring the high strain rate behavior of polyurea because of its potential use in developing advance armors. The latter was motivated by underwater blast experiments of Barsoum et al.Reference Barsoum and Dudt1 who demonstrated that use of a mere 2- to 3-mm-thick layer of polyurea on top of a steel armor plate significantly improved its blast resistance. Specifically, the polyurea/steel plate failed through the formation of a single bulge or few large but intact petal tears in contrast to the complete fragmentation observed for an uncoated steel plate when subjected to the exact same shock conditions. To fundamentally understand these unusual observations and to further develop, optimize, and realize the full potential of polyurea for dynamic applications, it is necessary to measure its constitutive behavior and ultimate failure capacity (measured in terms of tensile strength and fracture energy) at high strain rates. By deforming thin polyurea layers using laser-generated stress waves of several nanoseconds in duration, our group has addressed all of these problems. Our results are provided in three articles.
In the first article, presented here, we provide measurements of the dynamic tensile strength by adapting a previously developed laser spallation experiment to measure the tensile strength of thin film interfaces. In this experiment, a laser-generated pressure pulse on the back surface of the substrate reflects into a tensile wave from the free surface of the test coating deposited on its front surface. The returning tensile wave pries off the interface at sufficiently high amplitude. Optical interferometry is used in conjunction with wave mechanics simulation to calculate the tensile strength of the failed interface. A number of previous publications provide results for several interface systems involving metal, ceramic, and polymeric coatings and various engineering substrates.Reference Gupta, Argon, Parks and Cornie2–Reference Wang, Gupta and Basu10 Tensile strength measurements, presented here, follow the same procedure except that the thickness of the polyurea coating was made thick enough that the peak of the returning tensile wave occurred inside the polyurea layer. This caused the desired cohesive failure within polyurea. The stress quantification procedure at the failure site involved a combination of interferometric measurements and wave propagation simulation. Because of the sharp rise-time of the stress pulse, failures were accomplished at a peak strain rate of 1.67 × 10⁷ s−1 during which the material essentially deformed in its glassy regime. This resulted in a tensile failure without any shear banding or crazing that is well known to occur in polymers at low strain rate loading.
In the second article,Reference Youssef and Gupta11 we provide measurements of the dynamic fracture energy of polyurea. These measurements were made by following the tensile strength measurement procedure except that the sample was implanted with a well-characterized crack just below the free surface of polyurea, during sample preparation. A wave mechanics simulation was used to calculate the energy delivered to the crack tip, by the propagating stress wave, whose profile in the steel substrate was measured in separate independent polyurea-free steel plates using optical interferometry.
In the third article,Reference Youssef and Gupta12 we present the dynamic constitutive behavior of polyurea in its linear viscoelastic regime at strain rates up to 107 s−1. It was further shown that the time temperature superposition principle is valid for polyurea even at these extraordinarily high strain rates. This means that the dynamic behavior of polyurea can be modeled based on the constitutive data gathered under quasistatic conditions. This was also found to be true by Zhao et al.,Reference Zhao, Knauss and Ravichandran13 albeit for material strain rates below 103 s−1.
Together, these three articles provide tensile strength, fracture energy, and constitutive behavior of polyurea at ultrahigh strain rates. Deformations at such strain rates cannot be obtained by even the most sophisticated plate-impact and split-Hopkinson bar type setups that exist within the high-energy materials community today. In this sense, these three articles can also be viewed as introducing new experimental apparatuses and procedures to obtain mechanical behavior of materials at ultrahigh strain rates. There is a critical need for obtaining material data in this dynamic regime for various applications. One such application concerns development of advance armor concepts for protection against new weapons, such as shaped charges and explosively formed projectiles, which can attain extremely high speeds between 9,000 and 30,000 ft/s. Impacts from these hypervelocity penetrators and explosion debris are expected to generate stress waves with rise-times and durations spanning the nanoseconds domain, which, in turn, will result in deformations at strain rates in excess of 105 s−1.
In what follows, we provide details of the sample preparation, and experimental procedures for measuring the dynamic tensile strength of polyurea.
II. OVERVIEW OF THE EXPERIMENTAL PROCEDURE TO MEASURE THE DYNAMIC TENSILE STRENGTH
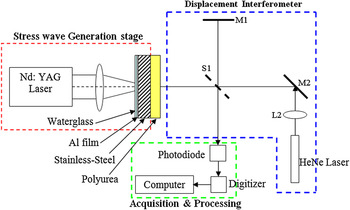
Figure 1 shows the schematic of the experimental setup. A polyurea layer was cast on a stainless steel plate of 0.72-mm thickness. A 0.5-μm-thick laser-absorbing aluminum film was sputtered on the back surface of the steel plate. This film was then constrained by a thin water glass layer of approximately 50- to 100-μm thickness. A Nd:YAG pulsed laser was focused onto a 3-mm-diameter area of the Al film. As discussed above, this resulted in melting of the Al film and launching of a compressive stress wave toward the polyurea layer supported on the steel plate’s front surface. It is well known thatReference Ready14 plasma is generated during the interaction of the laser pulse with the Al film. This plasma interferes in the ability of the laser pulse to transfer its energy into the Al film, which, in turn, reduces the efficiency of the stress wave generation process. For our experiments, this effect was not important as excess laser energy was used to overcome this effect and cause melting of the Al film which was needed to generate the stress wave through the mechanism of constrained volumetric expansion of the Al film.Reference Ready14 That is, the plasma may have reduced the efficiency of the stress wave generation process, but it was not important to know as the actual stress wave profile through the complex laser/Al interaction was experimentally recorded using an interferometer. The compressive wave reflected into a tensile wave from the free surface of the polyurea and loaded its volume in tension. The critical laser fluence to cause polyurea failure was recorded by gradually increasing the laser energy while keeping the laser heating spot diameter constant. At each level of energy fluence, the sample was removed and carefully examined under an optical microscope for failure. A new spot was used for each test to avoid the fatigue effects. When failure was observed, the energy fluence was recorded, and the depth at which the failure occurred was determined using a mechanical profilometer. This constituted step 1 of the test procedure. The tensile stress at the failure site was quantified by using two additional steps.
A schematic of the test setup along with that of an optical interferometer that was used to measure the spall strength of polyurea.

In the next step (step 2), profiles of the stress waves in an isolated polyurea-free steel plate were interferometrically recorded at the same laser fluences at which failures in step 1 samples were observed. Except for the absence of the polyurea layer, these samples were otherwise identical in geometry to step 1 samples, including the thickness of the Al and water glass layers. The schematic of the optical interferometer used for these measurements is shown in Fig. 1.
In step 3, the geometry of the step 1 samples was modeled in an ANSYS finite element program using two-dimensional plane strain elements. The stress wave profile in the steel plate from step 2 was used to load the model geometry. This wave essentially corresponded to the stress wave profile in the steel plate that caused failure in the step 1 samples. The magnitude of the peak tensile stress at the location at which failure was observed in the step 1 samples was determined using the simulation and taken as the dynamic tensile strength of polyurea. In the finite element simulation, the steel plate was modeled as a linearly elastic solid while polyurea was modeled as a viscoelastic solid with the constitutive law presented in the third article.Reference Youssef and Gupta12 Details of each step are provided below.
III. SAMPLE PREPARATION
Polyurea was prepared by mixing four parts of Versalink P1000 (oligomeric diamine made by AirProducts, Allentown, PA) and one part of Isonate 143L (modified methylene diphenyl diisocyanate made by DOW, Torrance, CA) by weight.Reference Youssef15 The mixture was stirred well for 1 min. A 1-mm-thick layer was cast on a 100 mm × 70 mm × 0.72 mm thick 304 stainless steel plate. Polyurea was then cured under ambient conditions for 24 h. It was then placed for an additional 24 h in a vacuum oven at 80 °C. Prior to casting, the steel surface was sanded by using 800 grit sanding paper to ensure good bonding with the polyurea. This was necessary for avoiding premature interfacial failures.Reference Youssef15 Prior to polyurea casting, the steel plate was sputtered with a 0.5-μm-thick Al layer and subsequently covered by a 50-μm-thick water glass layer.
IV. DETAILS OF NUMERICAL SIMULATION
A. Time and space discretization and boundary conditions
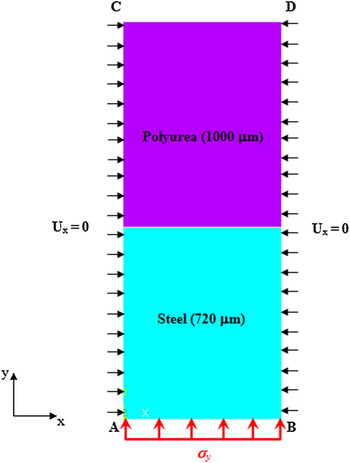
Figure 2 shows the overall finite element method (FEM) model and boundary conditions that were used in the simulation. Both regions were modeled in ANSYS using the Plane-183 elements. A uniform element size of 1 μm was chosen to avoid internal wave reflection artifacts that are known to arise from nonuniform meshing. Expanding this discretization scheme to include the entire lateral geometry of the physical sample was prohibitively expensive, especially while performing the dynamic analysis. An alternate strategy was used in which only the central 10-μm-diameter region of the laser-generated stress wave area was modeled in the lateral direction.Reference Youssef15 The geometry in the thickness direction was fully modeled consistent with the physical dimensions of the specimen. In the central region, the stress wave was modeled as a uniaxial strain pulse with the two lateral strains fully constrained. That is, only the strain in the wave propagation direction was allowed. This is justified as in the central region the material elements are not only loaded over an extremely short duration, but they are also constrained in the lateral directions by the massive stressed and unstressed regions of the steel substrate (wave is generated over 3-mm-diameter area of at least 25-mm-diameter substrate). This deformation condition was modeled in ANSYS by prescribing zero displacements in the x-direction on all nodes on sides AC and BD (Fig. 2) and use of plane elements (which ensured zero displacement in the thickness direction). The surface CD from which the stress wave reflects was kept traction-free. The stress wave recorded from the isolated polyurea-free steel plate from step 2 was used as an input to the model by prescribing its wave profile on the surface AB. After some trials, the time step Δt was chosen to be 1 ns to satisfy the standard numerical stability condition relating Δt to the element size Δx through the wave velocity c Reference Kim16:

A schematic showing the central slice of the numerically modeled stress wave loaded region of the steel/polyurea sample along with the boundary conditions.

B. Material models
The simulation also required constitutive models for the steel plate and the polyurea layer. Because of the expected high rate of loading (107 s−1), the steel plate was modeled as a linear elastic solid obeying Hooke’s law of linear elasticity, with density, elastic modulus, and Poisson’s ratio of 8060 kg/m3, 195 GPa, and 0.30, respectively.
Polyurea displays viscoelastic behavior and thus its mechanical properties are strongly strain rate dependent.Reference Amirkhizi, Isaacs, McGee and Nemat-Nasser17–Reference Roland, Twigg, Vu and Mott20 Zhao et al.Reference Zhao, Knauss and Ravichandran13 recently showed that the polyurea deformation data gathered at low strain rates and ambient conditions, as provided in Amirkhizi et al.,Reference Amirkhizi, Isaacs, McGee and Nemat-Nasser17 can be used to predict its dynamic behavior at strain rates up to 103 s−1, by using the time–temperature shift principle. By deforming thin polyurea films with laser-generated stress waves, Youssef et al.Reference Youssef and Gupta12, Reference Youssef15 extended the Zhao et al. thesis up to strain rates greater than 105 s−1. That is, the viscoelastic constants used in the Knauss et al.Reference Knauss and Zhao21 model were used for modeling the polyurea where peak strain rates greater than 105 s−1 are expected.
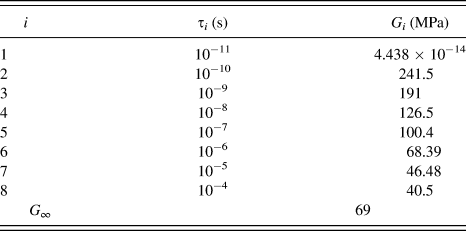
Specifically, the shear relaxation modulus G of the polyurea was based on the quasi-statically derived master curve and implemented using the Prony series with constants identical to those provided in Knauss et al.Reference Knauss and Zhao21:

where,

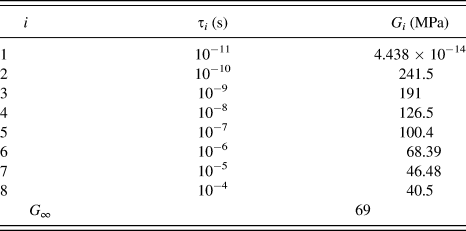
Instead of the six terms used by Knauss et al.,Reference Knauss and Zhao21 we used eight terms of the Prony series, which was deemed consistent with the time scale and the anticipated deformation and stress relaxation history of our experiments.Reference Ready14 Because of the high bulk modulus of polyurea, the volumetric part of the deformation was assumed to be linearly elastic. This, in turn, was modeled using a bulk modulus K equal to 4.54 GPa and Poisson’s ratio equal to 0.486.Reference Amirkhizi, Isaacs, McGee and Nemat-Nasser17, Reference Sarva, Deschanel, Boyce and Chen18, Reference Knauss and Zhao21Table I shows the values of all parameters that were used to define the viscoelastic constitutive model of polyurea in the ANSYS simulation.
Viscoelastic constitutive parameters for polyurea used in the finite element method simulation.
V. RESULTS AND DISCUSSION
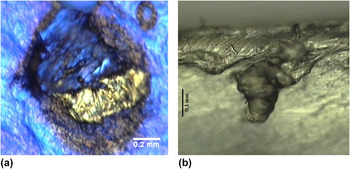
Failure in step 1 samples occurred at a critical laser fluence of 911 ± 64 kJ/m2. This data represents the result of 10 separate experiments. Figure 3(a) shows the top view of a typical fracture surface of polyurea after a plug of polyurea was spalled off. Figure 3(b) shows a cross section through this spot. The failure surface does not show any crazing or shear deformation effects. Failure appears brittle because of the high strain rate loading. For this sample, the deepest point in the crater was measured to be 153 μm using a mechanical profilometer.
(a) Top view of the polyurea where failure was caused by the returning tensile wave. (b) A view showing a cross section through the spot shown in (a).

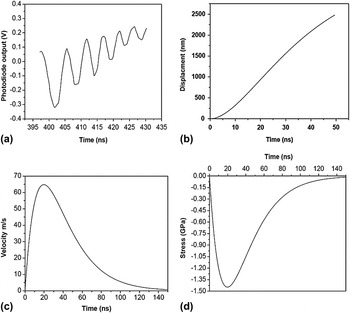
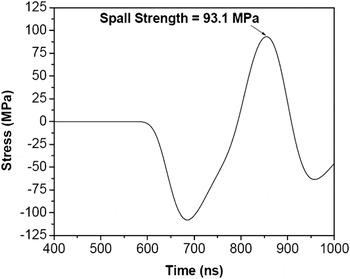
The sequence of plots in Fig. 4 shows a typical result from step 2, or the interferometric procedure for obtaining the stress wave profile in the steel substrate. Figure 4(a) shows the raw fringe data, which was used to calculate the transient-free surface displacements of Fig. 4(b). By differentiating the latter, free surface velocity was determined, Fig. 4(c). By multiplying this by ½ρc, the stress wave profile in the steel substrate was calculated [Fig. 4(d)]. The FEM simulation was loaded with this input stress wave in the steel substrate. The stress wave was propagated toward the polyurea/steel interface, and the tensile stress history at the maximum depth of the crater of 153 μm was determined. The calculated stress history at this depth is shown in Fig. 5. The stress goes into compression (negative values) as the initial compressive stress wave passes through this point. It then turns tensile as the returning tensile wave arrives. The tensile peak of this stress history was taken as the tensile strength or the spall strength of the polyurea. This procedure was repeated for seven successful spallation experiments, and this resulted in a dynamic tensile strength of 93.1 ± 5 MPa. Because of the transient nature of the stress wave loading, the strain rate varied continuously throughout the deformation history of polyurea. At the failure point, a strain rate of 1.67 × 10⁷ s−1 was calculated.
(a) Fringe record obtained at a laser fluence of 911 kJ/m2 from the free surface of a steel plate using the interferometer shown in Fig. 1. (b) Calculated free surface displacement from the fringe record. (c) The reduced velocity profile derived from free surface displacement. (d) The stress wave profile in the steel plate corresponding to the velocity profile shown in (c).

Stress history inside polyurea at the failure depth of ∼153 μm. The peak of the positive stress was taken as the spall strength of polyurea.

There is only one other study in the literature that has reported the dynamic tensile strength of polyurea. While reporting the dynamic pressure–shear constitutive model for polyurea, Clifton et al.Reference Jiao, Clifton and Grunschel22 reported its spall strength to be 106 MPa. These measurements were made at a peak strain rate of 106 s−1 using a pressure–shear plate setup. Their values compare quite well with those reported in this study of 93.1 ± 5 MPa. The small difference between the strengths could be attributed to the random porosity in our samples as the chemistry of the polyurea used in both studies was otherwise identical. The fact that both strength numbers are comparable even though the strain rate in our study is about 10 times faster than that in the Clifton et al. experiments means that the material is already deforming in its glassy state at these strain rates. Thus, it is unlikely that further strain rate hike will result in higher tensile strength values.
The tensile strengths reported here can be used as a local failure criterion in design simulations aimed at designing, optimizing, and developing novel polyurea-based heterogeneous composites for high-energy applications.
ACKNOWLEDGMENTS
This research was supported by an ONR grant no. N00014-00-1-0680 from the Office of Naval Research for which we are grateful to Dr. Roshdy G. S. Barsoum of that agency.