1. INTRODUCTION
In Italy, there is a long-lasting historiographical debate on north-south disparities in living standards at the time of national unification (1861) (Ciccotti Reference Ciccotti1898; Eckaus Reference Eckaus1961; Cafagna Reference Cafagna1989). In recent years, the debate has been enriched by new data and estimates on socioeconomic indicators. Despite the margin of uncertainty, the estimates of GDP per capita suggest that, in the first post-unification decades, the gap between the centre-north and the south was modest (Daniele and Malanima Reference Daniele and Malanima2011). For 1871, the difference in GDP per capita between the two areas was estimated at about 10-15 per cent (Felice Reference Felice2015; Felice and Vasta Reference Felice and Vasta2015). Data on infant mortality and life expectancy at birth, as well as estimates on nutritional conditions, do not indicate significant north-south differences in the first decade after unification, except for education levels (Vecchi and Coppola Reference Vecchi and Coppola2006; Atella et al. Reference Atella, Francisci, Vecchi and Vecchi2017; A'Hearn and Vecchi Reference A'hearn, Vecchi and Vecchi2017b). Regional economic disparities widened at the end of 19th century when, in the northern regions, the process of modern industrialisation began (Daniele and Malanima Reference Daniele and Malanima2011, Reference Daniele and Malanima2014).
In recent decades, a growing strand of literature has used anthropometric measures to investigate changes in health and living standards of populations over time (Floud et al. Reference Floud, Fogel, Harris and Hong2011). Anthropometric data also offer a detailed view of the unequal impact that economic development may have on the standards of life across individuals, social groups and geographical areas (Steckel Reference Steckel1995; Quiroga Valle Reference Quiroga Valle2001; Cámara et al. Reference Cámara, Martínez-Carrión, Puche and Ramon-Muñoz2019). In particular, data on the height and body mass index of conscripts have been extensively used by scholars to measure the changes in the standard of living across generations (Martínez Carrión Reference Martínez Carrión2012; Schoch et al. Reference Schoch, Staub and Pfister2012; Hatton Reference Hatton2014).
In Italy, universal male conscription began in 1863—2 years after national unification—and remained compulsory for all males until 2005 (birth cohort of 1985). Thus, Italian military records provide a great deal of information on the height and health conditions of the youths examined by draft boards at the age of 20 and, from the cohort of 1941 onwards, at the age of 18 years (Istat 2011, p. 190). Data on conscripts' average height have been used to investigate the trend, as well as regional differences, in the well-being of Italians in relationship with socioeconomic indicators (Terrenato and Ulizzi Reference Terrenato and Ulizzi1983; Hermanussen et al. Reference Hermanussen, Burmeister and Burkhardt1995; Arcaleni Reference Arcaleni2006; A'Hearn et al. Reference A'hearn, Peracchi and Vecchi2009; A'Hearn and Vecchi Reference A'hearn, Vecchi and Vecchi2017a).
Starting from the conscription of 1863 (birth cohort of 1842), the results of the Italian army's conscription boards' examinations, collected by Lieutenant General Federico Torre, have been published in volumes by the Italian Ministry of War (Ministero della Guerra, various years)Footnote 1. These reports contain data on the height of conscripts, as well as the number of those rejected due to insufficient height or because of disease or disability.
This article presents data on the causes of inability for military service among conscripts born in 1843-1871 (n = 7,202,883) and examined in the drafts 1864-1891. We focus, in particular, on data regarding the conscripts born in 1843-1856, showing regional and provincial differences in rejection rates. With few exceptions (Sormani Reference Sormani1881; Raseri Reference Raseri1898), these data have not previously been used by scholars. Yet, coupled with those on conscripts' mean height, they provide valuable information on the health standards in Italy at the time of national unification. Moreover, we examine the relationships between average height of conscripts, infant mortality and wage levels across Italian regions over the period 1861-1911.
Over the period we considered, the share of conscripts unfit for military service declined. For the birth cohorts of 1843-1856, the total rejection rates in the north and in the peninsular south were similar, although there were relevant regional and local differences. In the south and, particularly in Sardinia, the shares of conscripts unfit to serve due to insufficient height were notably higher than in the centre-north. We propose that, in the case of Italy, regional differences in average height did not necessarily reflect disparities in living standards, being probably also influenced by genetic (or possible epigenetic) factors.
This paper is organised as follows: section 2 briefly illustrates the recruitment procedures in Italy; section 3 presents the data on national trend and macro-regional differences in selected years; section 4 examines the data on the conscript cohorts of 1843-1856; section 5 focuses on regional differences in height and section 6 concludes.
2. MILITARY RECRUITMENT IN ITALY
The primary sources of the data exploited in the present article are the reports on the army conscriptions published by the Italian Ministry of War, Directorate-General of Military Conscription over the period 1865-1893, and which, until 1892, were compiled by Lieutenant General Federico Torre (Ministero della Guerra 1863-1893).
These reports contain data on height and the causes of inability to serve of the 20-year-old males who underwent the conscription examination for the army; data are disaggregated by regions, provinces and military districts. For some years, the number of conscripts examined, and that of those unfit for service, taken from the above-mentioned source, were reported by the Italian Institute of Statistics (MAIC 1884, 1908) and by some scholars (Sormani Reference Sormani1881; Raseri Reference Raseri1898).
To understand how data on the physical status of conscripts were collected, it is useful to briefly describe the military recruitment procedures in force in the considered period. The first conscription law of the Italian kingdom, issued in 1862 (Law no. 696 of 13 July 1862), substantially drew upon the «La Marmora Act» of 1854, first adopted by the Kingdom of Sardinia and subsequently extended to the former Italian states as they were then progressively annexed (Del Negro Reference Del Negro1979; Ilari Reference Ilari1989; Rovinello Reference Rovinello and Zürcher2013, Reference Rovinello2020). The conscription procedures were organised as follows. Each year, municipal offices compiled conscription lists which included all 19-year-old male citizens. During the subsequent month of March (corresponding to the contingent reaching their 20th year of age), the list was transmitted to the local army selection board, chaired by the local prefect of the government. The board checked the list, making the needed amendments, and drew up a so-called «draw-pool list» (lista d'estrazione), on the basis of which the military contingent established in each year was constitutedFootnote 2.
The youths selected were then subject to a medical check-up. First, they were measured; subsequently, those that satisfied the minimum height requirement were subject to a medical examination, to ascertain their physical and mental fitness for military service. At the end of the check-up, each conscript could be declared fit for the service, permanently unfit (rejected) or temporarily unfit and, therefore, deferred to a subsequent draft (Lamioni Reference Lamioni2002). Until the conscription of 1883, the minimum height requirement was 156 cm, and it was then set at 155 cm. Youths who, in their first draft, were found shorter than 154 cm were immediately rejected, while those whose height was between 154 and 156 cm were deferred to the subsequent draft. If they did not meet the minimum height requirement the following year, they were rejected definitively (Torre Reference Torre1871, p. 34).
In 1859-1861, while the national unification process was still ongoing, eight partial conscriptions, involving the youths of the former Italian states progressively annexed to the Kingdom of Sardinia, were called up; three conscriptions drew upon the pre-existing local legislations, while the others were enacted under the 1854 Act (Del Negro Reference Del Negro1979; Ilari Reference Ilari1989, p. 359).
The partial conscriptions held in 1859-1861, and the first one of the Italian Kingdom, held in 1863 (birth cohort 1842), are excluded from the present investigation. As previously noted, the conscriptions of 1859-1861 involved, in fact, some regions, and were based on different legislations, while the first conscription of 1863 was characterised by a very high number of absentees and draft-evaders, particularly in the southern regions (Ministero della Guerra 1865, p. 78; Del Negro Reference Del Negro1979, p. 178; Farolfi Reference Farolfi1979). In the conscription held in 1864 (cohort 1843), the number of draft-evaders was 13,476, that is 5.8 per cent of the youths recorded in the draw-pool lists (232,154). The percentage diminished further in the subsequent conscriptions, even though in the south the figure remained higher than in the rest of Italy for a long time.
The exceptionally high number of draft-evaders in southern Italy and Sicily (the former Kingdom of Two Sicilies) in the first drafts was largely due to the widespread discontent caused by the introduction of compulsory conscription by the government of the Italian kingdom. In reaction to conscription, many young southern men defected, and many of them joined the groups of «brigands» that, in the period 1862-1865, fuelled a guerrilla war (brigandage) in the peninsular south (Gooch Reference Gooch1989, p. 12).
Summing up, the data considered in the present article cover the army drafts held in 1864-1891 (cohorts born in 1843-1871), for a total of 7,202,883 20-year-olds examined by conscription boardsFootnote 3. Given the compulsory nature of conscription, and the number of individuals examined, data can be considered as representative of a large part of the Italian male populationFootnote 4.
In the next sections, the percentages of rejections because of insufficient height and health reasons are computed over the number of youths effectively examined by the conscription boards, not over those included in the conscription lists (that, obviously, also included youths exempted from the conscriptions for legal reasons, and evaders). As previously noted, it is important to keep in mind that only the youths who satisfied the minimum height requirements were subject to the full medical check-up to ascertain their fitness for military service.
Since the sources we used do not report the number of youths of the same birth cohort really examined in each conscription, to compute these numbers we followed the method used by Torre (Reference Torre1874, 1883) (see Table A.1 in the online Appendix). Finally, the data refer to the national and regional borders of the time (see Figure 1A in the Appendix). In the period under examination, the main changes to Italian borders regarded the inclusion of the provinces of Veneto and that of Mantua, data for which are available from the cohort of 1846, and that of Rome (Latium) from the cohort of 1850 onwardsFootnote 5.
3. THE NATIONAL TREND AND MACRO-REGIONAL DIFFERENCES
3.1. Italy: Cohorts 1843-1871
Figure 1 shows the trends of youths examined and that of those found unfit for service in the 1864-1891 conscriptions (birth cohorts 1843-1871) in Italy. Over the entire period, the number of youths examined was 7,202,883; of these, about 1,928,000 (27 per cent) were found unfit for the service. As shown in Figure 1, the number of conscripts examined increased notably over time, not only due to the increase in population, but also as a result of some changes in the laws pertaining to conscription.
ITALY, NUMBER OF CONSCRIPTS EXAMINED AND REJECTED—COHORTS 1843-1871.
Source: Ministero della Guerra, various years.

In particular, the number of conscripts increased in 1875, following a reform (Ricotti's Law) which abolished the causes of exemption from military service included in earlier legislation; in previous years, this had allowed 26 per cent of the youths in «draw-pool lists» to be exempted.
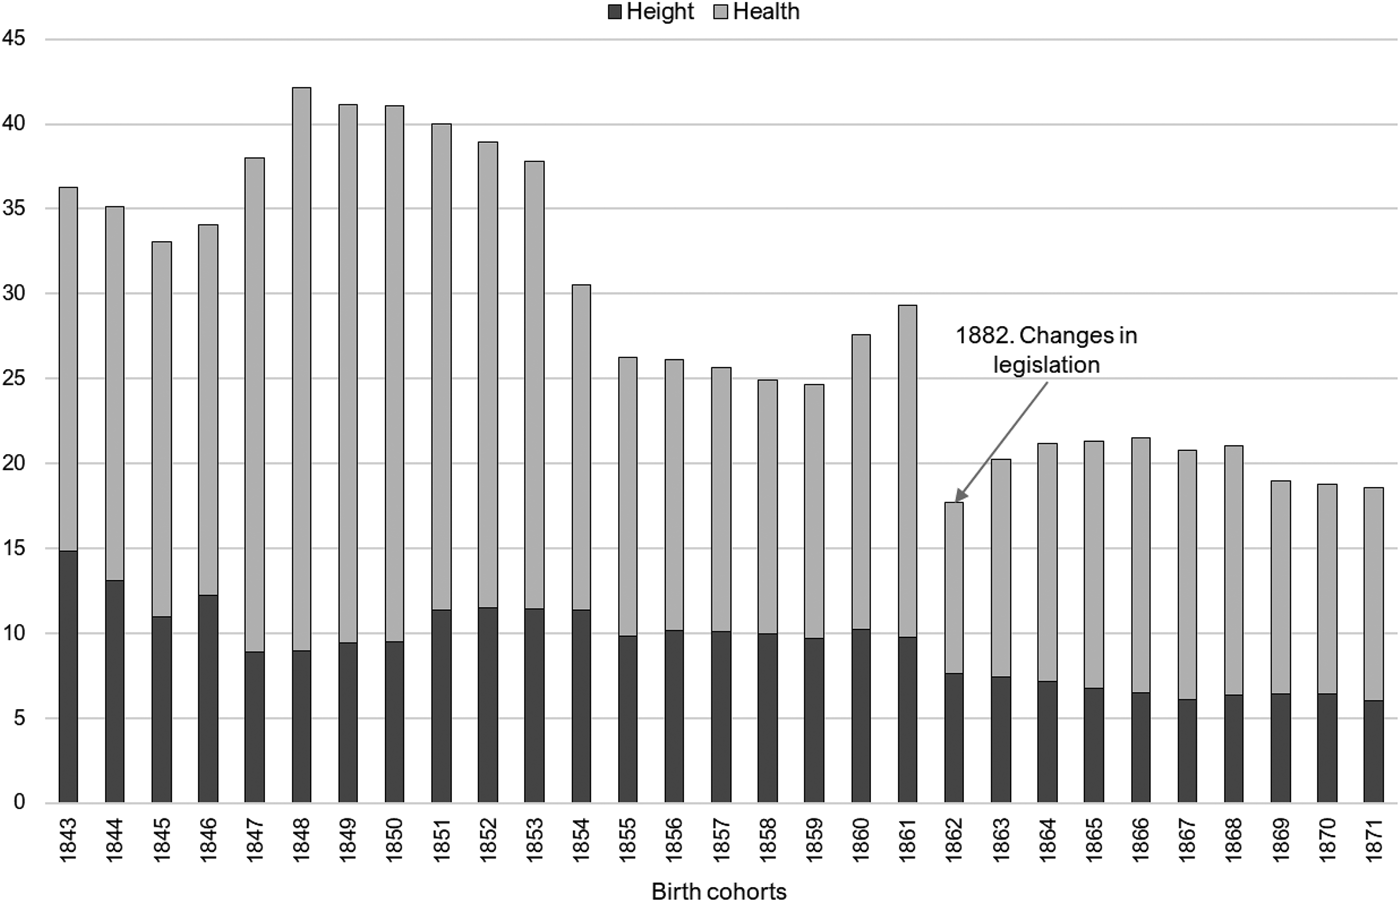
The trend in the share of unfit conscripts is shown in Figure 2, which distinguishes between rejections for insufficient height and those for health reasons. In the drafts that took place in the period 1864-1875 (birth cohorts of 1843-1854), the number of unfit conscripts was remarkable: as many as 772,186 out of the 2,044,000 youths examined were declared unfit (37.8 per cent); 11 per cent of youths measured were rejected since they did not satisfy the minimum height requirement, and a further 26.5 per cent were found unfit for health reasons. The rejection rate reached a peak of 43 per cent for the cohort born in 1848. By comparison, in France, in the conscriptions called up between 1861 and 1864, 33 per cent of conscripts examined turned out to be unfit for service (Balfour Reference Balfour1867, p. 250).
ITALY, REJECTION RATES (%) FOR INSUFFICIENT HEIGHT AND HEALTH REASONS—BIRTH COHORTS 1843-1871.
Source: Calculations on Ministero della Guerra, Della leva sui giovani nati nell'anno… (various years).

The infirmities affecting the conscripts clearly reflected the nutritional and sanitary standards of most of the Italian population. The most common causes of rejection were physical frailty, thoracic malformations and goitre. On average, 15 per cent of conscripts born in 1843-1861 were found to be unfit due to general frailty, about 6 per cent due to thoracic malformation and 4 per cent because of goitre. However, as we will see in the next sections, the incidence of these inabilities showed notable regional differences.
The share of unfit conscripts increased in some years, particularly in the conscriptions drawn from youths born in 1847-1851 and in 1860-1861. Raseri (Reference Raseri1898, p. 338), one of the first scholars who analysed data for conscripts, suggested that these increases were attributable to a more rigorous scrutiny of conscripts' physical standards by army selection boards, even though, he admitted, other causes could also have played a role. In particular, Raseri mentioned the cholera epidemics of 1849 and 1854-1855 that, possibly, impacted the economic and nutritional conditions of the Italian population, affecting the health of individuals born in those years. Effectively, the cholera epidemics of 1854-1855 in Italy caused over 248,000 deaths (Forti Messina Reference Forti Messina and Della Peruta1984), while the years just before national unification, and particularly 1854 and 1855, were characterised by crop failures, high prices and low real wages (Romani Reference Romani1982, pp. 149-164; Malanima Reference Malanima2015).
Undoubtedly, the trend in the percentage of youths unfit for service reflected, to some extent, the changes in the regulations on military recruitment that occurred in the period under scrutiny. The share of rejections dropped, in fact, in 1874 (cohort of 1854), as a result of a Decree that modified the chest measurement requirement (Ministero della Guerra 1876, p. 20). Another reform, introduced in 1882 (Law no. 831), reduced the ratio of chest measurement in proportion to height and, moreover, established that youths with a «weak constitution», or who were affected by presumably curable diseases, or those whose height was between 154 and 156 cm, could be deferred to the subsequent two conscriptions (MAIC 1884, p. 175; Raseri, Reference Raseri1898, p. 333). This explains the drop in rejections regarding the cohort of 1862.
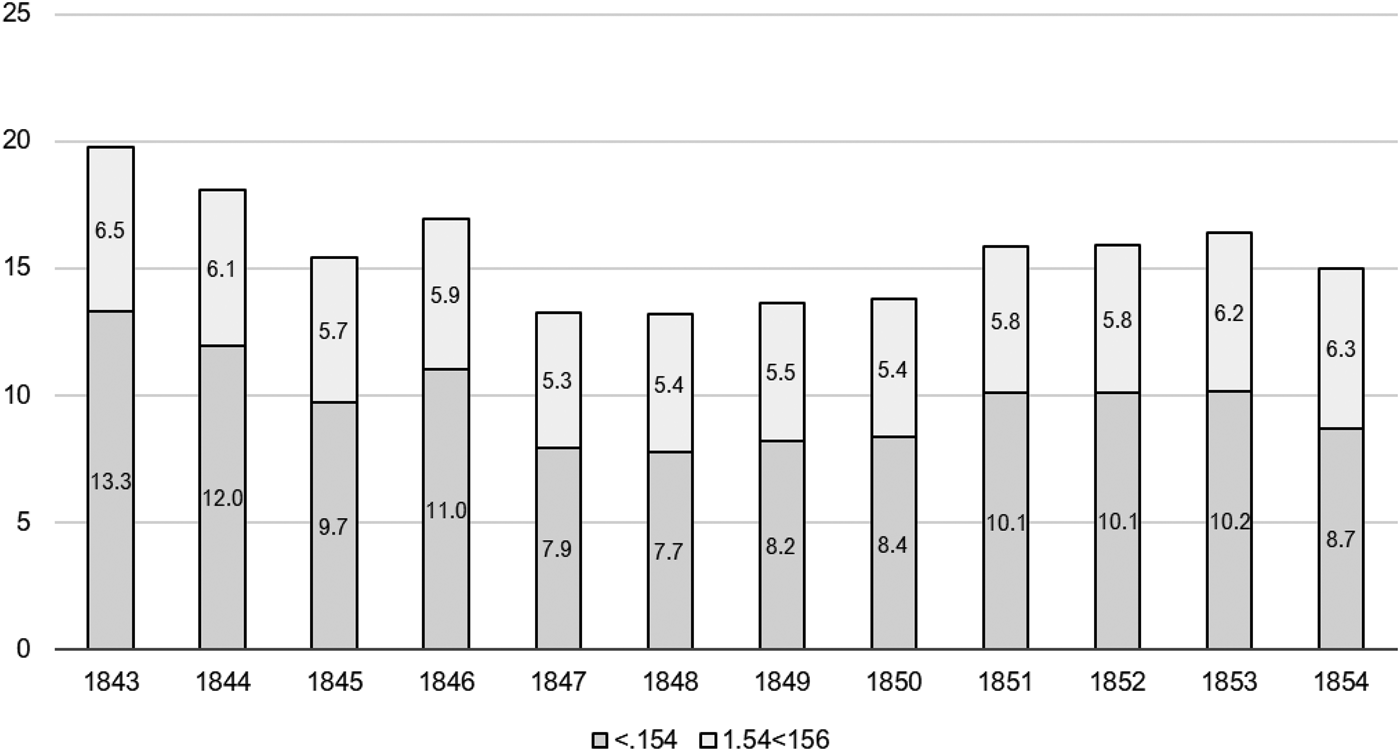
A reliable way to evaluate whether the changes in rejection rates reflected underlying changes in nutritional conditions is to consider the data on average height. It is well known, in fact, how adult height is affected by nutrition during infancy and adolescence (as well as by genetics), and the possibly permanent effects of severe nutritional shortage during infancy on height in adulthood have been documented (Silventoinen Reference Silventoinen2003; Perkins et al. Reference Perkins, Subramanian, Davey Smith and Özaltin2016). Unfortunately, in the case of Italy, data on conscripts' height are available only from the cohort of 1854 onwards. In fact, for the birth cohorts 1843-1853, the height data are grouped into classes of different intervals and are reported only for the numbers of conscripts taller than 154 cm.
Figure 3 shows the percentages of conscripts from the 1843-1854 classes with a stature of less than 154 cm and those with a stature of between 154 and 156 cm. The shares of those shorter than 154 and 156 cm increased at the end of the 1840s. It is, however, difficult to say whether these variations effectively reflected a worsening of nutritional conditions. It is noteworthy that 10 per cent of Italian conscripts born in 1843-1854 were shorter than 154 cm. By comparison, in the conscription taken from the 1871 class, the percentage diminished to 6.3 per cent.
PERCENTAGES OF CONSCRIPTS WITH A HEIGHT <154 CM AND 154 to <156 CM (COHORTS 1843-1854).
Note: Percentages are computed over the number of conscripts measured, including those deferred from previous years.
Source: Ministero della Guerra (various years); see also Raseri (Reference Raseri1898, p. 7).

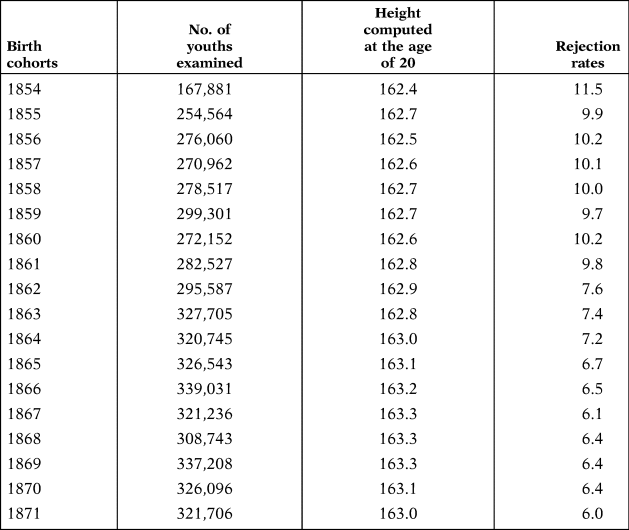
The average height of the conscripts born in 1854-1871 is reported in Table 1. Although the considered period is relatively short, it can be noted that the average height increased by about 0.7 cm, while the share of conscripts rejected for insufficient height diminished. These trends, evident from the cohorts from 1861 onwards, suggest an improvement in the living standards of the population.
AVERAGE HEIGHT AND REJECTION RATES FOR INSUFFICIENT HEIGHT OF CONSCRIPTS BORN IN 1854-1871

Source: Ministero della Guerra (various years); for height: Costanzo (Reference Costanzo1948, p. 74).
In synthesis, the trend in the share of unfit conscripts, although influenced by changes in recruitment regulations, indicates a substantial stagnation of the health standards among conscripts born between 1843 and 1853, and some improvement among those born in subsequent years.
3.2. Macro-Regional Disparities
The above-mentioned problems of comparability of data over time, due to changes in military procedures and legislation, obviously do not arise in regional comparisons for a given conscription. In the case of Italy, the comparison of regional data on the causes of inability for military service is of particular interest. It may, in fact, shed light on the relative socioeconomic conditions of northern and southern regions over the years at the time of national unification. Figure 4 shows the total rejection rates, for selected cohorts of conscripts, in the four Italian macro-regions: north, centre, south and the Isles (Sicily and Sardinia) (for regional data, see the online Appendix).
TOTAL REJECTION RATES IN THE ITALIAN MACRO-REGIONS—SELECTED COHORTS 1843–1871.
Note: As percentages of youths actually examined.
Source: Our calculations on Ministero della Guerra (various years).

It can be noted how, for the considered conscriptions, the rejection rate for conscripts from central Italy was always lower than in the rest of the country, while the rate was systematically higher for those from the Isles. In the conscription drawn from the contingents of 1846-1847 and 1850-1851, as many as 45 per cent of Sardinian and Sicilian conscripts turned out to be unfit for military service.
The differences between the north and the peninsular south were, instead, smaller. For the 1843-1844 cohorts, the rejection rate in the north (34.7 per cent) was slightly lower than in the south (36.5 per cent). It is possible that, for the first conscriptions, the number of unfit conscripts in the south was, to some extent, inflated by the relatively higher number of draft evaders. Indeed, as noted by Torre, youths potentially fit for military service had an incentive to avoid the conscription, compared to those clearly unfit or affected by disabilities (Torre Reference Torre1874). However, for the cohorts of 1846-1847 and 1850-1851, the share of unfit conscripts in the south was lower than in the north. Notably, the largest difference in the rejection rates (5 percentage points) between the north and the peninsular south regarded the cohorts of 1860-1861, the generation that grew up in the initial post-unification period. The overall trend of the total rejection rate was, however, similar in all macro-regions.
The rejection rates for insufficient height in the macro-regions are illustrated in Figure 5. In this respect, the differences among macro-regions were remarkable. About 20 per cent of conscripts born in 1843-1844 in the Isles, and about 19 per cent of those of the peninsular south, did not reach the minimum height requirement, in comparison to 10 per cent of those in the north and the 8 per cent of those of central Italy. Over the period, the shares of conscripts discharged due to insufficient height diminished, even though the differences between the macro-regions remained virtually unchanged. For the cohorts of 1870-1871, the rejection rate was about 4 per cent for the conscripts from the centre-north, 8.7 per cent for those of the south and 10.6 per cent for those from the Isles.
REJECTION RATES FOR INSUFFICIENT HEIGHT IN THE ITALIAN MACRO-REGIONS—SELECTED COHORTS 1843-1871.
Note: As percentages of youths actually examined.
Source: Our calculations on Ministero della Guerra (various years).

Finally, Figure 6 shows the percentages of rejections for diseases and disabilities. In this case, the percentages in the south were always lower than in the north, especially for the cohorts 1843-1857. The increase in the rejection rates in the conscriptions for 1870-1871 (cohorts 1850-1851) in all macro-regions, and the subsequent decline, is evident. The lower rejection rate for infirmities in the south may, in part, be explained by the fact that a comparatively higher share of southern conscripts was discharged after the preliminary inspection regarding height measurement, and was not, therefore, subjected to the full medical examination. It is, thus, possible that a share, impossible to quantify, of the southern conscripts discharged for insufficient height, was also affected by infirmities which would, in any case, have rendered them unfit for military service.
REJECTION RATES FOR HEALTH REASONS IN THE ITALIAN MACRO-REGIONS—SELECTED COHORTS 1843-1871.
Note: As percentages of youths effectively examined.
Source: our calculations on Ministero della Guerra (various years).

4. REGIONAL AND LOCAL DIFFERENCES: COHORTS 1843-1856
This section focuses on the causes of rejection of conscripts born in 1843-1856. For the cohorts considered, the data are drawn from the work of Giuseppe Sormani, a professor of public hygiene, who collected and organised the data on conscriptions contained in the above-mentioned reports of the Ministry of War (Sormani Reference Sormani1881). Sormani's work is valuable not only because it summarises a substantial amount of data, but also because it offers a homogeneous classification of the 18 main diseases and disabilities that led to the rejection of conscripts. Overall, the causes listed accounted for about 77 per cent of the rejections on medical grounds in the considered conscriptions.
In his computation of youths examined by conscription boards, Sormani excluded those deferred to the subsequent draft to be re-examined because, according to him, «the medical commissions had not ruled on them with a final decision on their aptitude for military service» (Sormani Reference Sormani1881, p. 16). Obviously, these conscripts were examined; in fact, they were deferred either because their stature was between 154 and 156 cm (thus, it was supposed that they might outgrow the deficiency), or because they were affected by curable diseasesFootnote 6. For these reasons—and in order to ensure the comparability with other data—we supplemented Sormani's data by adding, in each draft, the number of conscripts deferred for re-examination, for a total of about 2,575,000 conscripts effectively examined (Table A.4, online Appendix).
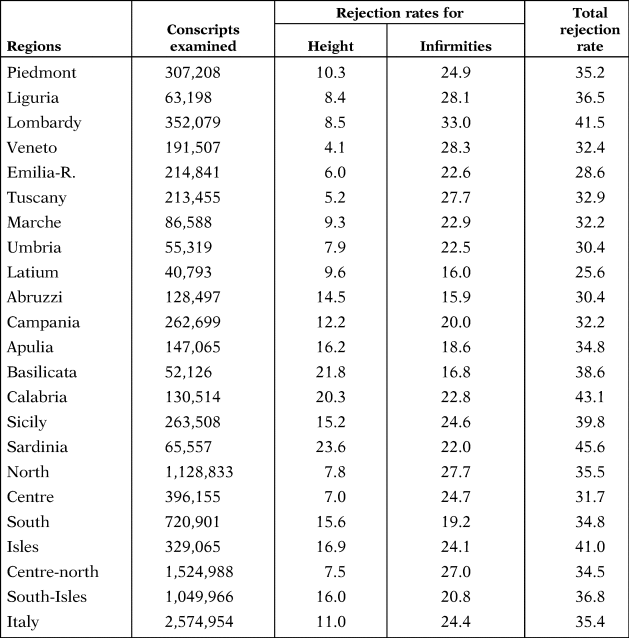
As shown in Table 2, the total rejection rate in the continental south (34.8 per cent) was slightly lower than in the north (35.5 per cent), while in the central region it was lower still (31.7 per cent). As previously noted, the difference between the central-northern and the southern regions is striking when rejection rates for insufficient height are considered. In the peninsular south, in fact, 15.6 per cent of youths examined did not meet the minimum height standard; more than twice the rate found in the rest of the country. The share of conscripts rejected for height deficiency was even higher in the islands (17 per cent). The picture changes when rejections for health reasons are considered. For the considered cohorts, in the peninsular south, the incidence of rejection (19 per cent) was lower than in the north (27.7 per cent).
REJECTION RATES OF CONSCRIPTS—BIRTH COHORTS 1843-1856 (%)

Note: The rejection rates for height and health are computed over the number of conscripts effectively examined. Abruzzi includes Molise.
Source: Our calculations on Ministero della Guerra, 1863-1876; Sormani (Reference Sormani1881).
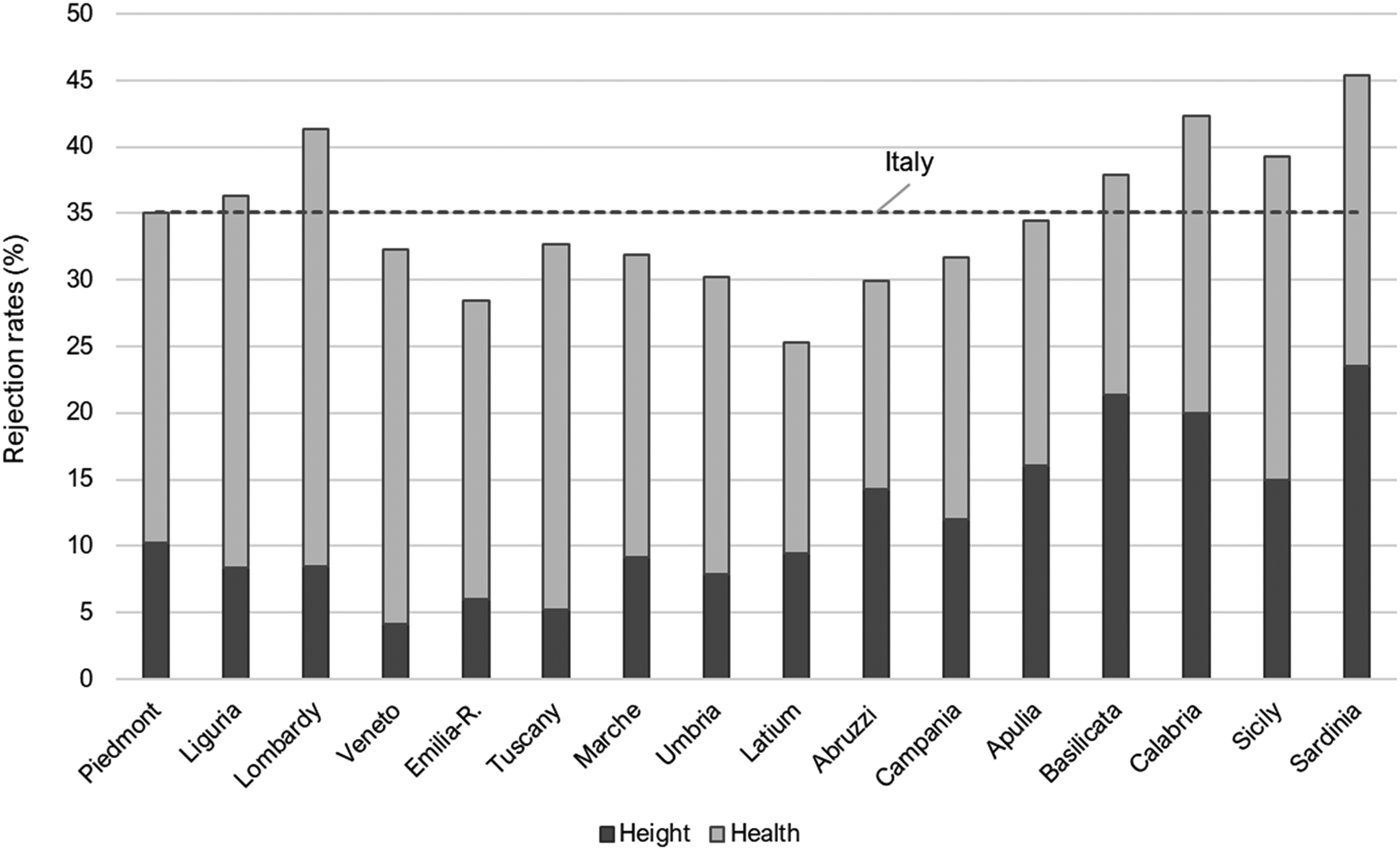
Figure 7 offers a synthetic comparison of regional data. The highest percentages of rejections were recorded in Sardinia (45.6 per cent), followed by Calabria (43 per cent), Lombardy (41.5 per cent) and Sicily (40 per cent). However, while rejection rates in the south were largely explained by the high share of youths shorter than 156 cm, in Lombardy, by contrast, it was due to the very high number of physically unfit conscripts, up to 33 per cent of those examined. The case of Lombardy stands out in comparison to other northern regions, such as Liguria and Piedmont (which had similar rejection rates for height deficiency) and compared to Veneto and Emilia-Romagna. It is noteworthy that the number of unfit conscripts in Lombardy accounted for 16 per cent of the national total, while those of Sicily and Sardinia together accounted for 14.7 per cent of the total. In Veneto, Emilia-Romagna and in the central regions, the total rejection rates were below the Italian average. Latium had the lowest rejection rate in Italy (25.6 per cent).
REJECTION RATES IN ITALIAN REGIONS—COHORTS 1843-1856 (%).
Note: The rejection rates are computed over the number of conscripts measured. «Abruzzi» includes Molise.
Source: Sormani (1881) and Ministero della Guerra, years 1863-1876.

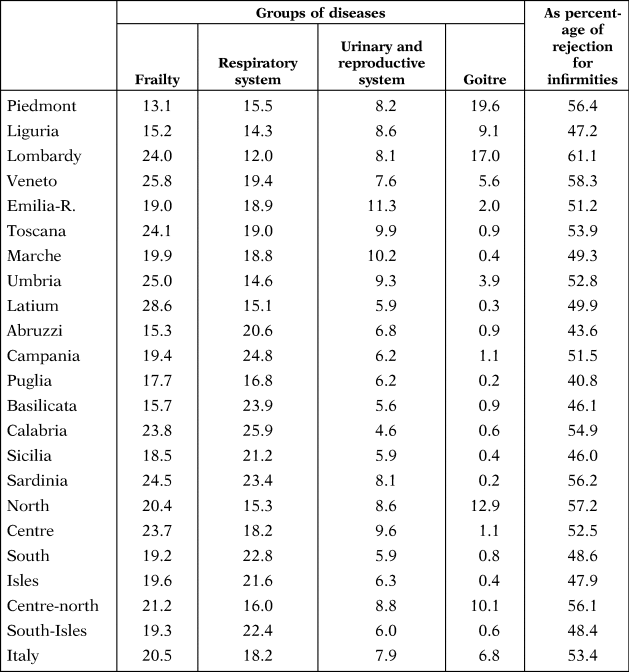
For the considered cohorts of conscripts, the main causes of rejection were physical frailty, respiratory diseasesFootnote 7 and goitre. Overall, these infirmities accounted for 53 per cent of rejections for health reasons in Italy (see the online Appendix). The incidence of these infirmities was, however, comparatively higher in the north, accounting for 61 per cent of rejections on medical grounds in Lombardy. In the northern regions, there was a very high incidence of goitre, an abnormal enlargement of the thyroid gland, due to a lack of iodine in the diet that was endemic in some provinces, especially in the Alpine Valley of Lombardy, the Aosta Valley and Piedmont and in Veneto (MAIC 1887; Croce Reference Croce2015). Often, goitre was associated with cretinism, the incidence of which was, in fact, higher in the mentioned regions than in the rest of the country. In Piedmont and Lombardy, 15,000 and 19,774 conscripts were respectively found to be affected by goitre; in the two regions, goitre represented 19.6 per cent and 17 per cent of diseases that caused inability over the considered period. In the Mezzogiorno (south-Isles), instead, goitre accounted for just 0.6 per cent of rejections caused by diseases (Table 3).
MAIN CAUSES OF REJECTION FOR INFIRMITIES FOR THE COHORTS 1843-1856 (%)

Source: Calculations on Sormani (Reference Sormani1881).
The incidence of physical frailty as a cause of rejection is of particular interest. Frailty is, in fact, clearly related to nutritional condition. Thus, the incidence of rejections for frailty in relationship to the overall rejections for physical inabilities or diseases can be considered as an indicator of average nutritional standards, particularly when comparisons are made within provinces and regions of the same macro-region. In fact, as previously noted, since the medical check-up was performed on the youths who satisfied the height requirement, it cannot be excluded that in the south the incidence of frailty was higher than that resulting from rejection data. However, in the Mezzogiorno region frailty accounted for 19 per cent of rejections for infirmities, against 21 per cent in the rest of the country.
The case of Lombardy is of particular interest, since the remarkable share of conscripts affected by infirmities, including frailty and goitre, contrasts with the fertility of its soil and the relative level of development of the region in the initial post-unification period (Zamagni Reference Zamagni1990, pp. 31-33). However, the miserable living standards of the peasants in some fertile areas of Lombardy, such as the province of Milan, were documented by some coeval enquiries (Jacini Reference Jacini1854, p. 165). As noted by Sormani (Reference Sormani1881, pp. 140-146), the notable incidence of frailty and some diseases, such as scrofula (cervical tuberculous lymphadenitis), was due, in Lombardy, to the fact that a number of peasants' households ate almost nothing except vegetables, dwelt in unhealthy houses and, in many cases, lived in stables for 5 or 6 months each year. Moreover, in many northern areas, particularly in the Po Valley, the nutrition of peasant families was unbalanced and largely based on maize, as shown by the incidence of pellagra; in the province of Brescia there were 3,167 pellagrosi (pellagra sufferers) every 100,000 inhabitants, and 1,829/100,000 in the province of Bergamo (Lombroso Reference Lombroso1877; Sormani Reference Sormani1881). In the south, due to a more favourable climate and a more balanced diet, the incidence of these diseases was lower.
Southern regions, together with the Latium countryside, were, instead, particularly affected by malaria, a disease which was present in a large part of the Italian territory (Corti Reference Corti and Della Peruta1984). The hardest-hit regions were Sardinia, Apulia and Basilicata. In Italy, all the species of Plasmodium (single-celled parasites that cause malaria) were present, even though Plasmodium falciparum, which causes the most severe and often fatal form of the disease, was found in central and southern regions, while Plasmodium malariae, rare, was mainly present in Sardinia (Crotti Reference Crotti2005). According to an interesting hypothesis, the exposure to malaria in childhood, having adverse effects on growth, would have contributed to explaining the north-south difference in average height in Italy at the end of 19th century (Percoco Reference Percoco2021). A link between the incidence of malaria and short height has also been suggested for the region of Murcia, Spain, in the second half of 19th century (Martínez Carrión Reference Martínez Carrión and Komlos1994). The association between malaria and stunting is a matter of debate, and international studies—most of which focus on African countries—reach contrasting results (Ferreira et al. Reference Ferreira, Alexandre, Salinas, De Siqueira, Benzecry, De Lacerda and Monteiro2015; Amoah et al. Reference Amoah, Giorgi, Heyes, van Burren and Diggle2018).
4.1. Provincial Differences
The north-south gradient in rejection rates for insufficient height is evident in panel A of Figure 8, that refers to Italian provinces. In the northeast provinces, rejection rates were lower than in the northwest; these variations are perfectly consistent with those in average height. In fact, the Venetians were taller than the Piedmontese and the natives of Lombardy. It is noteworthy how, in the north, the highest rejection rates for short height were reached in some provinces of Piedmont (particularly Aosta) and in Lombardy, mainly in the province of Sondrio, which was, in fact, one of the poorest northern provinces (Livi Reference Livi1883). The percentage of rejections progressively increased with a clear latitudinal gradient, reaching the highest values in some provinces of Sardinia (Cagliari, 25.5 per cent, Sassari, 20.3 per cent), Basilicata (22 per cent) and Calabria (Catanzaro and Reggio Calabria, 20.5 per cent).
REJECTION RATES FOR INSUFFICIENT HEIGHT (A) AND FOR HEALTH REASONS (B), COHORTS 1843-1856.
Note: rejection rates are computed over the number of conscripts effectively examined.
Source: calculations on Sormani (Reference Sormani1881) and Ministero della Guerra, 1863-1876.

Figure 8B shows the rejection rates due to health reasons. In part, the distribution mirrors the previous chart. The highest rejection rates were recorded in some provinces of Lombardy, namely Sondrio, Milan and Como, and in Vicenza (Veneto), where levels were between 36 and 39 per cent. In the south, the incidence of physical inabilities was comparatively high in Calabria, particularly in the provinces of Catanzaro and Reggio Calabria (≈24 per cent), and in the Sicilian provinces of Catania (28.4 per cent) and Messina (26.4 per cent).
As shown in Figure 9, panel A, the incidence of physical frailty did not show a clear north-south divide. The highest incidence was recorded in some provinces of Veneto, namely Rovigo (37.6 per cent), Venice (35.4 per cent) and Treviso (34.6 per cent), followed by Milan (29.7 per cent). In the south, the highest rates of frailty were recorded in the provinces of Salerno, Cagliari and Cosenza, all with 25.5 per cent. Finally, panel B of Figure 9 shows the geographical distribution of the total rejection rates.
REJECTION RATES FOR FRAILTY (A) AND TOTAL REJECTION RATES (B), COHORTS 1843-1856
Note: Rejection for frailty as percentages of conscripts rejected for health reasons.
Source: Calculations on Sormani (Reference Sormani1881), and Ministero della Guerra, 1863-1876.

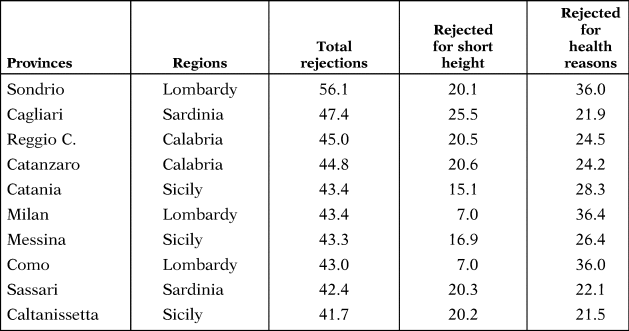
The highest rejection rate was in the province of Sondrio, in Lombardy, where more than half (56 per cent) of conscripts were unfit for military service, followed by Cagliari, in Sardinia (47.4 per cent), and by two Calabrian provinces, Catanzaro and Reggio Calabria (45 per cent), due to the very high incidence of rejections for insufficient height. These provinces were followed by those of Milan and Como, in Lombardy, where about 43% of conscripts who satisfied the height requirement were then found unfit for reason of infirmities (Table 4). In many provinces, spread across the country, the rejection rates ranged between 30 and 40 per cent. The lowest rates were recorded in some provinces of central Italy and Emilia, due to the relatively low number of rejections for insufficient height.
TOP 10 PROVINCES BY TOTAL REJECTION RATES—COHORTS 1843-1856 (%)

Note: Rejection rates are computed over the number of conscripts effectively examined. In the second column the regions to which the provinces belong are indicated.
Source: Calculations on Sormani (Reference Sormani1881).
5. REGIONAL DIFFERENCES IN HEIGHT
In the period examined, the shares of conscripts unfit due to short height were systematically higher in the southern regions than in the central-northern ones. These differences reflected those in average height, which in Italy has a clear latitudinal gradient. Since the north-south gradient in stature mirrors that in levels of economic development, it is interesting to wonder whether, indeed, regional differences in stature are reliable indicators of disparities in living standards.
Regional data on nutritional standards in Italy for 1843-1871 are not available. Recent estimates, however, indicate that in the decade 1860-1870, around 30 per cent of the Italian population was undernourished. In 1881, as far as we know, the incidence and severity of undernutrition were higher in the centre-north than in the Mezzogiorno (Vecchi and Coppola Reference Vecchi and Coppola2006). Fragmentary data, and the first social enquiries carried out in the 1870s, do not suggest substantial north-south differences in nutritional standards (Bodio Reference Bodio1879). An enquiry carried out in 1885, regarding the nutrition of workers, reports, instead, a lower consumption of fresh meat and milk, and a higher consumption of bread and pasta in the south, in comparison to the rest of Italy (Somogyi Reference Somogyi1973).
Given the lack of data on nutritional conditions in the period we are dealing with, a viable way to test whether north-south disparities in average height were, to some extent, due to disparities in living standards, is to examine their relationship with infant mortality. This indicator reflects, in fact, the nutritional and epidemiological standards (the «disease environment») prevailing in a society. Therefore, a reduction in infant mortality is one of the most important predictors of an increase in the average stature registered over time (Bozzoli et al. Reference Bozzoli, Deaton and Quintana-Domeque2009; Hatton Reference Hatton2014), and in cross-country comparisons, infant and child mortality are negatively and significantly related to the average height of populations (Grasgruber et al. Reference Grasgruber, Cacek, Kalina and Sebera2014). Research covering Britain in 1910-1950 and Italy in the 1970s shows how child mortality rates were associated with shorter height in adulthood, thus confirming the scarring effect that poor nutrition in childhood has on individuals' health (Hatton Reference Hatton2011; Peracchi and Arcaleni Reference Peracchi and Arcaleni2011). This effect was also found by studies using individual data. For example, Marco-Gracia and González-Esteban (Reference Marco-Gracia and González-Esteban2021), considering data on 2,783 individuals born between 1835 and 1977 in Spain, found a strong negative relationship between infant mortality within families and the average height of surviving male children.
For the Italian regions, infant mortality rates (<1-year-old) are available from 1863 onwards (Istat 1975). It is noteworthy how in the first decade after Italian unification, there were no relevant differences between northern and southern regions. On the contrary, as shown in Figure 10, in some southern regions infant mortality rates were below the national average.
INFANT MORTALITY RATES IN ITALIAN REGIONS 1863-1871 (×1,000).
Note: Infant deaths under the age of 1 year per 1,000 live births; for Veneto data refer to 1867-1877.
Source: Istat (1975).

Figure 11 plots the relationship between infant mortality and the average height of conscripts born in Italian regions in 1861 and 1911. For 1861, the two variables are positively, even though not significantly, related. The correlation turns out to be negative when data for 1911 are considered. In fact, by 1911, infant mortality had declined across the country, but to a greater extent in the northern regions (Istat 1975; Atella et al., Reference Atella, Francisci, Vecchi and Vecchi2017). A north-south gradient had taken place, explaining the negative (although very weak) correlation with average height.
INFANT MORTALITY RATES AND AVERAGE HEIGHT OF CONSCRIPTS BORN IN 1861 AND IN 1911 IN ITALIAN REGIONS.
Sources: Infant mortality rates from Istat (1975), average height from A'Hearn and Vecchi (Reference A'hearn, Vecchi and Vecchi2017a, Reference A'hearn, Vecchi and Vecchi2017b).

Historical data for different European countries, including Italy and Spain, show how the trend of average height of a population is ordinarily related to that of per capita income, a proxy of nutrition levels (A'Hearn Reference A'hearn2003; Federico Reference Federico2003; Peracchi Reference Peracchi2008; María-Dolores and Martínez-Carrión Reference María-Dolores and Martínez-Carrión2011). The link between height and income has also been found through cross-sectional data regarding developed countries, even though the magnitude of correlation depends on the considered countries' samples (Deaton Reference Deaton2007; Grasgruber et al. Reference Grasgruber, Cacek, Kalina and Sebera2014). Interestingly, a positive relationship between height has been noticed across Spanish regions over the period 1934-1973, and across Italian regions from the years after 1871 (Cámara and Garcia-Roman Reference Cámara and Garcia-Roman2015; A'Hearn and Vecchi Reference A'hearn, Vecchi and Vecchi2017a). For Italy, regional GDP per capita in 1871, estimated by Felice (Reference Felice2015), is significantly related to the average height of conscripts born in the same year (r = 0.62). However, due to the lack of data on production per sector, regional GDP estimates for the first post-unitarian decades present wide margins of uncertainty.
Another variable associated with the height trend in time series is real wage (Baten Reference Baten2000; Ericsson and Molinder Reference Ericsson and Molinder2020). In contrast to GDP estimates, data on wages are first-hand information, being available from coeval sources. For the Italian regions, data on real wages for the first decades after unification have been published by Daniele and Malanima (Reference Daniele and Malanima2017) and by Federico et al. (Reference Federico, Nuvolari and Vasta2019). Even though both studies rely on the same source (MAIC w.d.), they present some methodological differences. In particular, different baskets of goods were used to compute regional price indices, and thus there are some differences in real wages. Therefore, while Daniele and Malanima (Reference Daniele and Malanima2017) cover the period 1862-1878, Federico et al. (Reference Federico, Nuvolari and Vasta2019) extended their series up to 1913, thus showing the regional trends of wages during the first phase of Italian industrialisation.
Figure 12 plots the relationship between height and real wages in 1861 and 1878 from Daniele and Malanima (Reference Daniele and Malanima2017). In contrast to what we might expect, the two variables are negatively, even though weakly, related. The negative relationship depends on the relatively high wages of Sicily and, especially, those of Sardinia. In these two regions, wage rates were pushed up by the low activity rates of females (Daniele and Malanima Reference Daniele and Malanima2017). The low activity rate meant that wages were high but, at the same time, that their contribution to total income was relatively low; therefore, in Sicily and Sardinia, high wages did not necessarily translate into high living standards. However, even when these two regions are excluded from the sample, there is not a positive relationship—as one would expect—between real wages and average height across Italian regions.
REAL WAGES (DM) AND AVERAGE HEIGHT OF CONSCRIPTS BORN IN 1861 AND 1878 IN ITALIAN REGIONS.
Note: Real wage is computed by the number of baskets of goods purchasable per day given the nominal wage; real wages of unskilled workers are considered. DM stands for Daniele and Malanima (Reference Daniele and Malanima2017).
Sources: Wages from Daniele and Malanima (Reference Daniele and Malanima2017), average height from A'Hearn and Vecchi (Reference A'hearn, Vecchi and Vecchi2017a, Reference A'hearn, Vecchi and Vecchi2017b).

Figure 13 shows the relationship between average height and real wages in 1861 and 1911 based on data from Federico et al. (Reference Federico, Nuvolari and Vasta2019). It is interesting to notice the lack of a relationship between the two variables for 1861 data (R 2 = 0), while the relationship is positive and significant for 1911 (R 2 = 0.57). Summing up, in the aftermath of Italian unification, neither infant mortality rates, nor real wages explained regional disparities in height. Fifty years later, however, both variables, and especially wage levels, were related to regional height.
REAL WAGES (FNV) AND AVERAGE HEIGHT OF CONSCRIPTS BORN IN 1861 AND 1911 IN ITALIAN REGIONS.
Note: Real wage is computed by the number of baskets of goods purchasable per day given the nominal wage. FNV stands for Federico et al. (Reference Federico, Nuvolari and Vasta2019).
Sources: Real wages from Federico et al. (Reference Federico, Nuvolari and Vasta2019), average height from A'Hearn and Vecchi (Reference A'hearn, Vecchi and Vecchi2017a, Reference A'hearn, Vecchi and Vecchi2017b).

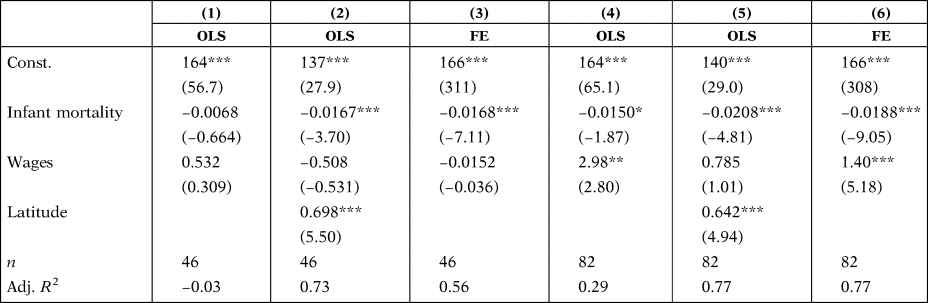
To test these relationships, we regressed regional average height on infant mortality rates and wage levels, by using a panel of data for the decades 1861-1911 (n = 16, t = 6)Footnote 8. To compare the results, the regressions were performed for the decades 1861-1881 and for the entire period, through the pooled ordinary least squares (OLS) and fixed-effects (FE) models. In the OLS regressions, regional latitude is included as a control variable, in order to capture regional-specific effects. Results are reported in Table 5.
REGRESSIONS FOR ITALIAN REGIONS—DEPENDENT VARIABLE: REGIONAL HEIGHT (1861-1911)

Note: For FE estimates, within R 2 is reported; t-statistics in parentheses; columns 1-3 refer to the period 1861-1881; columns 4-6 to the period 1861-1911.
*Significant at the 10% level; **significant at the 5% level; ***significant at the 1% level.
In the pooled OLS estimate for 1861-1881 (column 1), neither infant mortality nor wages are significant. Infant mortality is, instead, negatively and significantly related to height in the estimate that includes latitude and in that with regional FEs, which give similar coefficients (columns 2 and 3). The results change when regressions are performed for the period 1861-1911 (columns 4-6). In the OLS estimates, infant mortality and wages are both significant, even though they explain a small fraction of variance in height across regions (R 2 = 0.29). The explicative power of the model notably increases when latitude is included in the regression, even though wages are no longer significant (column 5). In the estimation with the FE model (column 6), controlling for time-invariant regional effects, both infant mortality and wages are positively and significantly correlated with regional height.
These results corroborate the hypothesis that the link between regional average heights and living standards became evident from the end of the 19th century. Furthermore, they show how other factors, captured by latitude, or included in the «unobserved heterogeneity», contribute to explaining regional differences in height in Italy. These results are in line with those presented by A'Hearn and Vecchi (Reference A'hearn, Vecchi and Vecchi2017a, p. 70), who showed how, over the period 1861-1980, income and infant mortality explained only a fraction of the differences in height among the Italian regions compared with the national average. The unexplained fraction (the regional «fixed effect») was particularly large in some regions, namely Veneto, Emilia Romagna, Tuscany and Sardinia.
Figure 14 shows the evolution of regional disparity in average height measured by standard deviation. Keeping in mind that the x-axis reports the birth years of conscripts, we see how disparities notably increased between 1891 and 1921 remaining stable at a relatively high level up to 1941. Since conscripts born in 1941-1971 were in their childhood and adolescence when Italy was experiencing a rapid and generalised rise in well-being levels, it is not surprising to find that period characterised by significant convergence in regional statures (Martínez-Carrión and María-Dolores Reference Martínez-Carrión and María-Dolores2017; Lanari et al. Reference Lanari, Crippa and Pieroni2022). In 1980, regional disparity in average height reached, approximately, the 1871 level.
REGIONAL DISPARITY IN AVERAGE HEIGHTS, COHORTS 1861-1980.
Note: Standard deviation of regional heights. Data for 1921 refer to 1920.
Source: Calculation on data from A'Hearn and Vecchi (Reference A'hearn, Vecchi and Vecchi2017a), and Istat, https://seriestoriche.istat.it/.

The trend of regional disparity in height is analogous to that of disparity in per capita GDP. In fact, the north-south gap in per capita income, modest at the date of unification, increased at the end of 19th century, in conjunction with the beginning of the modern industrialisation process in northern Italy. From then, up to the Second World War, a long phase of economic divergence between northern and southern regions occurred, followed by a phase of convergence over 1951-1975 (Daniele and Malanima Reference Daniele and Malanima2014, Reference Daniele and Malanima2011; Felice Reference Felice2019). In other words, over time, the north-south gradient in stature and the gradient in socioeconomic development overlap.
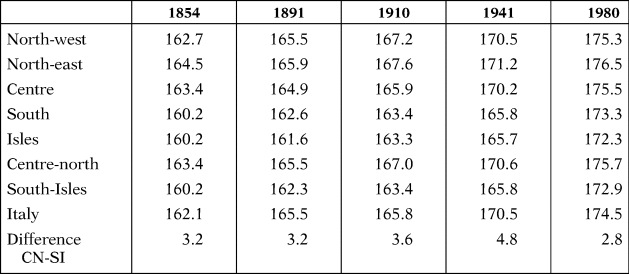
Table 6 reports the average height of conscripts of some selected cohorts between 1854 and 1980 in the Italian macro-regionsFootnote 9. Since the time of unification, the average height of Italians followed a secular trend of growth, similar to that of other European countries (Hatton and Bray, Reference Hatton and Bray2010). Conscripts born in 1980 were 12.4 cm taller than those born in 1854. Despite this, the regional differences existing at the date of unification still persist.
MEAN HEIGHT OF CONSCRIPTS IN ITALIAN MACRO-REGIONS, COHORTS 1854, 1891, 1910, 1941, AND 1980 (cm)

Note: Italy's coeval borders.
Source: For 1854, calculation on Ministero della Guerra (1876); for the other years, A'Hearn and Vecchi (Reference A'hearn, Vecchi and Vecchi2017a, p. 552).
The difference in average stature between the centre-north and the Mezzogiorno changed from 3.2 cm for the cohorts 1854-1891 to 3.6 cm in 1910, increasing further in the following years and reaching 4.8 cm for conscripts born in 1941; it then diminished to 2.8 cm for the cohorts born in 1980. Remarkably, the north-south difference in the height of youths born in 1980 (2.8 cm) was similar to that of those born in 1854 (3.2 cm).
Clearly, the regional differences in the mean height of conscripts born in 1980 cannot be explained by disparities in living standards. In 1980-1990, the average expenditure for foodstuffs in the south was 225 euros per month, in comparison to 220 euros in the north (Istat 2011) and, after all, territorial disparities in nutrition, capable of affecting the average height of population, would be inconceivable in a developed country. Moreover, data show how the regional hierarchy in height in 1980 was roughly the same as in 1854.
In Italy, the highest average stature has always been recorded in the northeast, particularly in Friuli Venetia Giulia and in Veneto, while the shortest were, and still are, in the south and in the islands, particularly in Sardinia (A'Hearn and Vecchi Reference A'hearn, Vecchi and Vecchi2017a). The persistency of a north-south gradient in height is confirmed by other evidence. For example, a study of a large sample of girls and boys aged 6-20 years, carried out during the period 1994-2000, showed how youths from the centre-north were systematically taller than their peers from the south: at the end of their growth period, the average differences were 2.4 cm for girls and 2.7 cm for boys (Cacciari et al. Reference Cacciari, Milani and Balsamo2002).
How can we explain the persistence of regional disparities in average height despite the equality of nutritional and health conditions? A possible answer is that these differences are related to genetic or epigenetic factors. There is evidence, in fact, that together with environment, genetic factors contribute to explain differences in height, not only between individuals within a given population, but also between different populations (Eveleth and Tanner Reference Eveleth and Tanner1990, pp. 191-207; Turchin et al. Reference Turchin, Chiang, Palmer, Sankararaman and Reich2012; Robinson et al. Reference Robinson, Hemani and Medina-Gomez2015). For example, the haplogroup J1-M267, found in populations of the Zagros mountains in Iran, and in the Arabian Peninsula (particularly in Yemen), is associated with short stature, while the combined frequencies of Y haplogroups I-M170 and R1b-U106 are positively correlated with average male stature across European countries (Grasgruber et al. Reference Grasgruber, Cacek, Kalina and Sebera2014, Reference Grasgruber, Sebera, Hrazdíra, Cacek and Kalina2016).
At the end of the 19th century, anthropologists already attributed differences in height between the Italian regions to «racial» or «ethnic factors» inherited from the different populations which, since ancient times, had settled in the north and south of the country (Lombroso Reference Lombroso1873; Livi Reference Livi1883, Reference Livi1886; Cappieri Reference Cappieri1971). Recent research, based on classic genetic markers and on genome-wide association studies, shows how the degree of internal genomic variability in the Italian population is greater than that in other European countries (Cavalli-Sforza et al. Reference Cavalli-Sforza, Menozzi and Piazza1994, pp. 277-280; Fiorito et al. Reference Fiorito, Di Gaetano and Guarrera2016). Northern Italians are genetically close to populations of northwestern Europe and the northern Balkans; southern Italians are more similar to Mediterranean and Middle East populations, while Sardinia is a genetic «outlier» in the European context (Di Gaetano et al. Reference Di Gaetano, Voglino, Guarrera and Fiorito2012; Fiorito et al. Reference Fiorito, Di Gaetano and Guarrera2016; Grugni et al. Reference Grugni, Raveane, Mattioli and Battaglia2018). It is documented that the frequencies of alleles associated with increased height are systematically more elevated in northern Europeans than in southern Europeans (Turchin et al. Reference Turchin, Chiang, Palmer, Sankararaman and Reich2012). It is, thus, entirely possible that the north-south gradient in height in Italy is related to population genetics.
In the period we considered, the highest stature and the lowest rejection rates due to height deficiency were recorded in the northeastern regions (Friuli and Veneto), which are close to other regions of the Balkan peninsula characterised by a relatively high average height. For example, in the drafts held in 1871-1873, the mean height of conscripts from Trieste (Friuli Venetia Giulia) was 166.3 cm, while in the nearby district of Zara (Dalmatia) it was 170.1 cm (Pagliani Reference Pagliani1877, p. 105). The populations of central Europe and the western Balkans (the area of the Dinaric Alps), typically have a higher average height than those of Mediterranean Europe (Coon Reference Coon1950; Grasgruber et al. Reference Grasgruber, Cacek, Kalina and Sebera2014). In 1895, the average height of Bosnian soldiers (aged 20-24) was 172.3 cm, thus significantly higher than in Italy and France (Mrehić et al. Reference Mrehić, Marjanović, Hadžiselimovi and Feri2016). Nowadays, together with the Dutch, Montenegrins and Dalmatians, men from Herzegovina (183.4 cm) are among the tallest in the world. The exceptionally high average height in Dalmatia, and in Bosnia and Herzegovina (in which living standards were, and still are, suboptimal) is likely influenced by a genetic factor associated with the Y haplogroup I-M170 (Grasgruber et al. Reference Grasgruber, Popović, Bokuvka, Davidović, Hřebíčková, Ingrová, Potpara, Prce and Stračárová2017; Grasgruber et al. Reference Grasgruber, Prce, Stračárová, Hrazdíra, Cacek, Popović, Hřebíčková, Potpara, Davidovič and Kalina2019).
For the soldiers born in 1859-1863, Livi (Reference Livi1886, p. 36) reported a mean height of 166.6 cm in Veneto and of 165.3 cm in Lombardy (Figure A.2 in the Appendix). Moreover, data on a sample of students between 3 and 16 years old attending schools in the 1870s in some northern cities show how the average stature, at all ages, of students in Venice (Veneto) was greater than that of their peers in Turin (Piedmont) and Milan (Lombardy) (Pagliani Reference Pagliani1878). It is worthy of note that, in the second half of the 19th century, Veneto was economically backwards in comparison to Lombardy and Piedmont (Meriggi Reference Meriggi1996; Daniele and Malanima Reference Daniele and Malanima2011). Moreover, in Veneto and in other northern regions, the diet of most of the population, being largely based on maize, was poor and unbalanced, as confirmed by the incidence of pellagra (Lombroso Reference Lombroso1877; De Bernardi Reference De Bernardi1984).
Even though, to our knowledge, the role of genetics in population height for mainland Italy and Sicily has not yet been investigated, there is some evidence regarding Sardinia. Already in prehistoric times, Sardinians were, on average, shorter than contemporary populations (Pes et al. Reference Pes, Tognotti, Poulain, Chambre and Dore2017), and a genome-wide association study identified, in the Sardinian population, two genetic variants (a stop codon in gene GHR and an allele in the KCNQ1 gene) with a penalty effect on height (Zoledziewska et al. Reference Zoledziewska, Sidore and Chiang2015). These findings are perfectly consistent with the exceptionally high rejection rates for short height of Sardinian conscripts in the considered period.
6. CONCLUSION
In this paper we presented the data on the causes of rejection of conscripts born in 1843-1871, and subject to medical examination prior to enrolment in the Italian army at the age of 20. Over the considered period, about 27 per cent of the youths examined were rejected due to insufficient height or for diseases and disabilities. The rejection rate declined over time, descending from 38 per cent for the conscript cohorts of 1843-1853, to 21 per cent for the cohorts of 1861-1871. Overall, in the peninsular south, the percentage of unfit conscripts was similar to that of the north, while it was lower in the regions of central Italy.
In the Mezzogiorno (south-Isles), the average height of the conscripts was lower than that of the centre-north. However, it would be erroneous to attribute regional differences in height entirely to disparities in health and nutritional conditions. First, regional differences in the average height of conscripts born in 1861 were not related to infant mortality rates and real wage levels. Second, there is no evidence that, at the time, nutritional conditions in the southern regions were poorer than in the northern regions. Indeed, the incidence of some diseases—such as pellagra and goitre—suggests that in many northern areas, the diet of a large part of population was poor and unbalanced. Finally, the differences in mean height between centre-north and the Mezzogiorno in 1854-1871 and in 1980 were roughly the same. Since in the 1980s nutritional standards were homogeneous throughout Italy, it is highly likely that the persistent north-south differences in average height reflect genetic (or epigenetic) factors, the role of which has been, however, ascertained for Sardinia. It is noteworthy that a persistent north-south gradient in height has also been observed within Germany (Lehmann et al. Reference Lehmann, Floris, Woitek, Rühli and Staub2016), which is consistent with the north-south gradient observed all over Europe, from Scandinavia to southern Italy (Turchin et al. Reference Turchin, Chiang, Palmer, Sankararaman and Reich2012; Mathieson et al. Reference Mathieson, Lazaridis and Rohland2015).
Undoubtedly, in mid-19th-century Italy, the isolation of many areas, and the poor population mobility (migrations were mainly temporary and took place between contiguous regions), meant that the genetic variability between north and south was greater than that which can be found today. Migrations from the south to the centre-north, on the other hand, became massive starting from the 1950s (Gallo Reference Gallo2012), and this may also have had an effect on average populations' height (Corsini Reference Corsini2008). The role of genetics does not imply, however, that regional differences in height were not affected at all by nutritional standards. Height, like other polygenic traits, depends on the interplay between environmental, epigenetic and genetic factors (Simeone and Alberti Reference Simeone and Alberti2014; Jelenkovic et al. Reference Jelenkovic, Sund and Hur2016). In fact, from the end of 19th century, in Italy, a significant link between regional heights, infant mortality and real wages can be found.
This paper has focused, in particular, on the health standards of the conscripts born in 1843-1856, before Italian national unification. For the considered cohorts, the total rejection rate was 34.8 per cent in the mainland south, 35.5 per cent in the north and reached 41 per cent in the islands. The lower rejection rates were recorded in some northeastern and central regions, while the highest were in southern regions of Calabria (43 per cent) and Sardinia (45.6 per cent). It is noteworthy that the share of conscripts rejected in Lombardy (41.5 per cent) was higher than in Sicily (40 per cent), and in Liguria (36.5 per cent) and Piedmont (35 per cent) it was higher than in the populous Campania (32 per cent). The case of Lombardy is striking, in comparison to the other northern regions. The high share of conscripts from Lombardy unfit due to infirmities contrasts with the fertility of the soil and the presence of productive agricultural and manufacturing activities in that region, as stressed by some historians (Cafagna Reference Cafagna1989; Zamagni Reference Zamagni1990). It is noteworthy that Lombardy, Piedmont and Liguria were the regions in which, at the end of 19th century, the process of Italian industrialisation first began.
The data on conscript rejections in the drafts between 1843 and 1856 support the idea that, at the time of national unification, health and social conditions across Italy were substantially similar. After all, at that time, Italy was still a backward country, in which modern industrialisation had not yet begun, and poverty and undernutrition were widespread, although there were local differences. By the beginning of the 20th century, Italy's economic geography had changed. The transformations were determined by the process of modern industrialisation, which began in the northwest of Italy at the end of the 19th century. With the progressive concentration of industry in the northern regions, the divide between north and south widened (Daniele et al. Reference Daniele, Malanima and Ostuni2018). As a result, the geographic gradient in average height and that in socioeconomic development levels overlapped.
In the first half of the 20th century, per capita GDP grew in Italy but, at the same time, a long phase of divergence between north and south occurred (Daniele and Malanima Reference Daniele and Malanima2014; Felice Reference Felice2019). As a consequence of the divergence in well-being levels, regional disparities in height increased; Italian males born in 1951 were, on average, 7 cm taller than those born in 1861, but the difference in mean height between central-northern and southern regions had increased from 3.2 to 4.8 cm. In the golden age of economic growth (1955-1971), a phase of convergence between Italian regions took place, and disparities in height progressively diminished. For the youth who grew up in the 1980s, the difference in height between the centre-north and the south had reduced to 2.8 cm, not unlike that found for the cohorts born in 1861. Overall, the data on the health conditions of conscripts tell us a story consistent with the dynamics of economic development and regional disparities in Italy.
SUPPLEMENTARY MATERIAL
The supplementary material for this article can be found at https://doi.org/10.1017/S021261092300006X.
ACKNOWLEDGEMENTS
The authors thank Paolo Malanima and three anonymous referees for their valuable comments.
SOURCES AND OFFICIAL PUBLICATIONS
ISTAT (1975): Tendenze evolutive della mortalità infantile in Italia, Annali di Statistica, serie VIII, vol. 29, Roma: Istat.
ISTAT (2011): L'Italia in 150 Anni. Sommario di statistiche storiche 1861-2010. Roma: Istat.
MAIC (w.d.): Ministero di Agricoltura, Industria e Commercio, Salari. Prezzi medi di un'ora di lavoro degli operai addetti alle opere di muratura ed ai trasporti di terra e mercedi medie giornaliere degli operai addetti alle miniere (1862-1878), Roma.
MAIC (1882): Atlante Statistico del Regno d'Italia. Diagrammi di demografia italiana, Roma.
MAIC (1884): Annuario Statistico Italiano. Anno 1884. Roma: Tipografia Eredi Botta.
MAIC (1887): Studio sulle endemie del cretinismo e del gozzo, in: Annali di Agricoltura, Roma: Tipografia Eredi Botta.
MAIC (1908): Annuario Statistico Italiano 1905-1907. Roma: Tipografia Nazionale C. Bertero e C.
Ministero della Guerra: Direzione Generale delle Leve e della Truppa, Della leva sui giovani nati nell'anno…, Reports published in 1865-1893.