1 Introduction
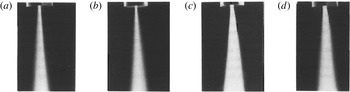
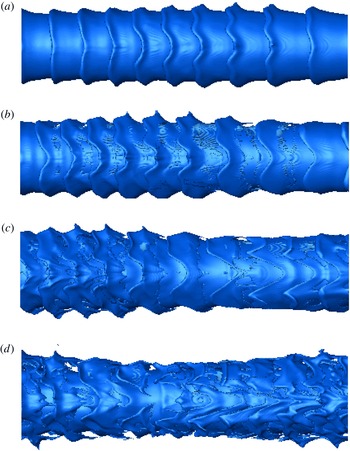
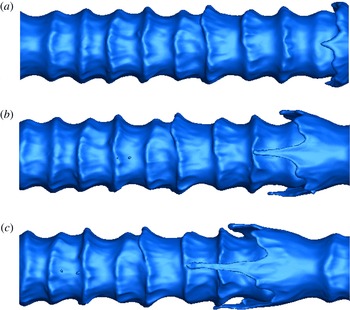
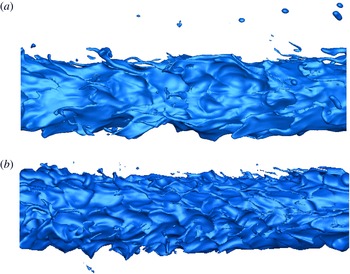
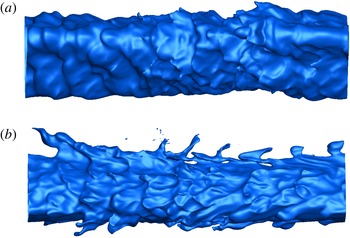
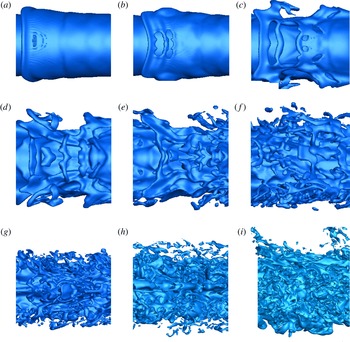
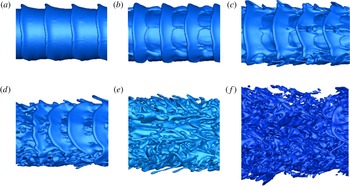
The small structures in early spray development, i.e. lobes, holes, ligaments and bridges, are crucial in determining the sizes of the droplets that break from these structures due to capillary action. While the literature has identified some interesting phenomena at the small structure level, the importance of these structures to the final spray, the fluid mechanical causal relations, and the limitations within the parameter domain to their appearances remain under explored. In fact, the major scientific questions have not been clearly identified. The goal is to resolve the size and velocity distributions of the droplets because they strongly affect the performances of various operations and machines, including especially combustion engines. Volume growth rate for the two-phase (liquid and entrained gas) mixture, or equivalently the ‘spray cone angle’, is also important. Figure 1 presents experimental images for a round liquid jet at various upstream injector pressures and displays cases with different spray cone angles. It will be shown that the time scales for the formation of the small structures during jet disintegration determine the spray cone angle, which in turn affects the distribution of droplets through the volume. Recent ballistic images, near the nozzle of diesel-like sprays at high pressure, high
 $Re$
and
 $We$
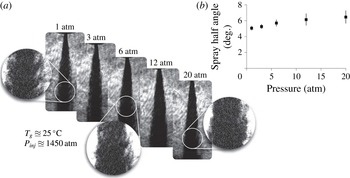
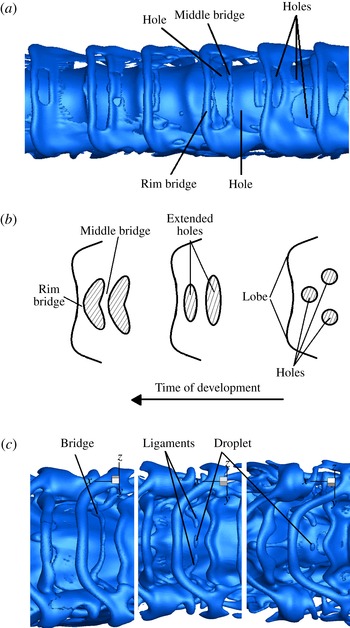
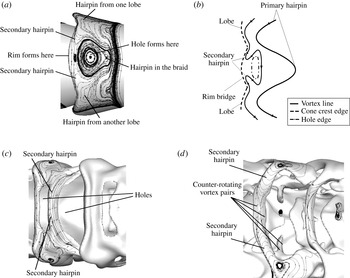
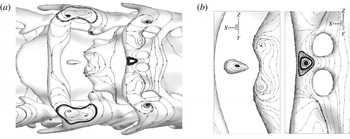
by Duran, Porter & Parker (Reference Duran, Porter and Parker2015) show that the cone angle increases with ambient pressure; see figure 2. They found resemblance between the sizes of their observed structures and the previous computational results of Jarrahbashi & Sirignano (Reference Jarrahbashi and Sirignano2014), hereinafter cited as JS. However, more studies are required to delineate the liquid structures before final break up into droplets. These needs motivate the study of the disintegration of the liquid core into bridges and ligaments with a goal to understand the differing behaviours and mechanisms in different parameter domains. Incompressible round jets or planar mixing layers without density gradients or interfacial tension have been studied, with attention to the vorticity and velocity fields but little attention to interface tracking and the Lagrangian flow description. Meanwhile, liquid streams flowing into a gaseous environment have been researched with great attention to developing surface deformation and eventual breaking of the liquid into smaller elements; however, little or no attention is paid to velocity and vorticity. This paper relates the flow field variables, interface tracking and the Lagrangian portrait to each other, thereby obtaining physical insights and explanations.
Photographs obtained for a sharp-edged inlet nozzle showing the increase of the spray cone angle with injection pressure: (a) 28.3, (b) 47.8, (c) 86.9, (d) 109 MPa, (Ohrn, Senser & Lefebvre Reference Ohrn, Senser and Lefebvre1991).

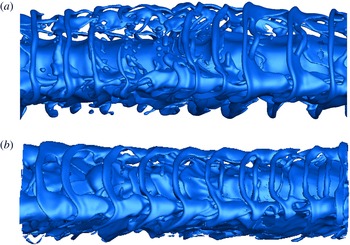
(a) Images of dodecane at room temperature and increasing pressures; magnification with additional contrasting highlights shedding phenomena; (b) spray cone angle increased with increasing charge pressure (Duran et al. Reference Duran, Porter and Parker2015).

Liquid jet experiments of Marmottant & Villermaux (Reference Marmottant and Villermaux2004) at low pressure with coaxial air flow showed that ligaments formed by elongation of the corrugations on the liquid cone-crest rims of the primary Kelvin–Helmholtz (KH) waves. They suggested that the cone-crest instability was caused by the Rayleigh–Taylor (RT) instability due to the high flow acceleration normal to the crests. On the contrary, the side jets, expelled as counter-rotating vortices for jet flow into a like-density fluid, show that density difference cannot explain fully the three-dimensional (3-D) instability.
Previous simulations by JS, of spatial instability of round liquid jets in high-pressure air, i.e. high gas-to-liquid density ratios, showed that RT, i.e. the baroclinic effect, was not responsible. Instead, vortex tilting and stretching created the streamwise vorticity and formed the lobes on the KH cone crests similar to the side jets of like-density jets. ‘High-pressure’ is a technical term denoting high gas density or, more specifically, high gas-to-liquid-density ratio. At atmospheric pressure for common liquids (e.g. water, kerosene, oil) injected into air, the density ratio is
 $O(10^{-3})$
. Here, capillary action and RT instability can be important but the KH instability is less so since the gas has little inertia and the strain near the liquid surface is not significant. As density increases to the
 $O(10^{-2}{-}10^{-1})$
range, the KH instability becomes important; vortex structure and vortex–strain interaction become key factors in the spray development. Like many phenomena, there are no precise thresholds; generally, we are interested in practical situations where, during the early instability, inertial effects are stronger than capillary effects in forming the smaller structures and vortex–strain interactions are more significant in generating vorticity than baroclinic effects.
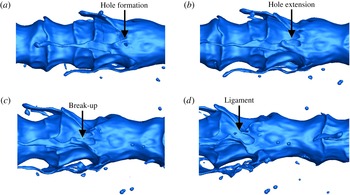
In addition, JS showed hole formation on the liquid lobes. These holes increase in size with time and reach the tip of the lobe, then tear, producing two ligaments from the rim bridge between the crest and the hole. Ligaments can also develop from elongation of the lobes themselves, as well as from tearing of the lobes. Lobe tearing became more prominent for high gas-to-liquid density ratios while lobe elongation was the dominant mechanism for lower gas-to-liquid density ratios and lower
 $Re$
. Simulations of a round liquid jet injected into air by Shinjo & Umemura (Reference Shinjo and Umemura2010) at relatively high gas-to-liquid density ratios indicated that ligaments formed when a hole in the jet core opened. They showed that the number of created ligaments depended on the initial crest shape, crest size and the local flow field. Simulations of turbulent liquid jets in quiescent air by Desjardins & Pitsch (Reference Desjardins and Pitsch2010) portrayed liquid protrusions that stretched out into ligaments and holes formed at the vicinity of these ligaments on the jet core. However, the mechanisms responsible for lobe perforation and the effects of surface tension and differences in density, velocity and viscosity between the two phases on lobe tearing were not well explained in those prior studies. Some connections between the surface wave dynamics and the vortex structures were studied for the first time by JS. Prior to that work, research on liquid stream disintegration focused solely on surface contours and ignored the vast literature for uniform-density jet flows dealing with vortex dynamics (Zaman & Hussain Reference Zaman and Hussain1980; Hussain & Clark Reference Hussain and Clark1981).
Although JS showed the varying qualitative behaviour over a range of
 $Re$
values, certain important details of these phenomena remain enigmatic. Several questions must be answered. The sequence of instability mechanisms and the time scales of hole, ligament, bridge and droplet formations must be resolved so that droplet sizes and volumetric growth rate for the two-phase mixture can be determined. Do ligaments first form from the indentations appearing on the lobes followed by holes forming on the cone crests at the roots of the ligaments? Or do ligaments form after lobe perforation occurs? What are the different behaviours in different parameter ranges, e.g. density and viscosity ratio, surface tension? The time scales of the hole, bridge and ligament formations and the roles of surface tension, densities and viscosities in determining these time scales are unknown. The cause of hole formation and the location of the holes in the lobes are not immediately obvious. Do holes form due to collision of the droplets with the jet core as suggested by Shinjo & Umemura (Reference Shinjo and Umemura2010) or do they form even before the droplets detach from the liquid core? What are the thickness scales for ligaments in the different parameter domains? Do droplet sizes relate to the ligament thicknesses? How rapid is the increase of the radial size of the two-phase mixture?
Answering the aforementioned questions is formidable experimentally due to limitations of optical access to the jet, especially at the high gas pressures and densities of interest, see § 2.2. For the computations, very high resolutions are required to obtain the details of ligament formation. A less computationally intensive case with a segment of the round liquid jet undergoing temporal instability allows for the required higher resolution. The three-dimensional instability, i.e. lobe formation for a wide range of gas-to-liquid density ratios, was discussed thoroughly, and vorticity dynamics associated with interface instability was also described previously (JS). Now, compared to that prior research, higher-resolution simulations have been performed for later times, after the initiation of the instability. The emphasis is on the formation of small-scale liquid protrusions at the liquid–gas interface, hole creation in the lobes and ligament break up for wider ranges of liquid viscosity and surface tension coefficient. Via post-processing, the vorticity dynamics and momentum balances responsible for formation of the holes and ligaments have been obtained for various flow conditions to identify the dominating mechanisms.
The present paper is organized as follows. Section 2 reviews relevant literature. Section 3 discusses the current research objectives. The computational methods and the 3-D liquid-segment model are discussed in § 4. The simulation results, including the specific effects of different flow parameters on ligament formation and associated vorticity dynamics, are described in § 5. Section 6 gives a final overview.
2 Literature review
In the following subsections, a brief review is given of computational and experimental research on liquid jets and sheets injected into a gas and the relevant vorticity dynamics. In §§ 2.1 and 2.2, it will be seen that a clear understanding does not generally exist for the particular parameter domain to which a particular behaviour is limited. Also, the relation between the liquid–gas interface development and the velocity and vorticity fields has generally not been explored in depth, although, as discussed in § 2.3, relevant knowledge exists from studies of uniform-density flows.
2.1 Computational studies on liquid jets and streams
Direct numerical simulation by Desjardins & Pitsch (Reference Desjardins and Pitsch2010) of turbulent planar liquid jets injected into air at a 0.025 gas-to-liquid density ratio revealed small-scale structures at the liquid–gas interface in great detail. Their work was limited to Weber numbers (
 $We$
) of
 $O(10^{2}{-}10^{3})$
, which for their
 $Re$
values, were low compared to our range of interest for common liquid fuels and high-pressure operations. They showed that by decreasing
 $Re$
, the size of the ligaments and the length scales of the liquid protrusions increased. In other words, the liquid deformations occurred at larger cross-sectional length scales since the eddies of low-
 $Re$
-flow contained less energy than high-
 $Re$
flows. Ligaments became thinner and more abundant by decreasing the surface tension. Some ‘bubble bursting’, leading to formation of ligaments, was observed in their simulations. They initiated the calculation with a turbulent liquid which quickly entrapped some surrounding gas forming bubbles. These bubbles broke the interface forming cavities which invert by blowing gas outward and forming liquid ligaments. The instantaneous liquid–gas interface from their computations showed some hole formation near the tips of a few of the liquid sheets expelled from the planar jet core, tearing of those sheets and formation of the ligaments due to tearing for
 $Re$
and
 $We$
equal to 2000 and 1000, respectively. However, they did not explain the mechanisms responsible for hole formation.
Computational studies of Shinjo & Umemura (Reference Shinjo and Umemura2010) on the primary atomization of a round liquid jet injected into high-pressure air, at higher
 $We$
(e.g.
 $O(10^{4}{-}10^{5})$
) and lower
 $Re$
(e.g.
 $O(10^{3}{-}10^{4})$
) than the simulations of Desjardins & Pitsch (Reference Desjardins and Pitsch2010), indicated the formation of the ligaments from the development of holes in the liquid crests. They claimed that the lobes on the liquid crests formed holes as a result of the collision of the droplets formed upstream in the gas flow (by break up of the ligaments created at the back of the mushroom-shaped cap) with the liquid jet core. However, as discussed earlier, the experimental studies of Marmottant & Villermaux (Reference Marmottant and Villermaux2004) showed that the liquid ligaments formed as a result of the elongation of the lobe indentations even before the ligaments break up and produce the droplets. Simulations of Shinjo & Umemura (Reference Shinjo and Umemura2010) showed that when the lobe surface area increased and its rims became thicker, the liquid surface of the lobe punctured and two or three ligaments formed as the hole extended to the tips of the lobe. Their results showed, at early times of injection associated with the development of the mushroom-shaped cap, large holes formed near the rims of the cap from which new ligaments were created from its torn rim. Lobe perforation leading to ligament formation similar to the mechanism observed by Shinjo & Umemura (Reference Shinjo and Umemura2010) was detected by JS for larger gas-to-liquid density ratios. However, unlike the claims of Shinjo & Umemura (Reference Shinjo and Umemura2010), holes were created on the lobes even before the ligaments form and break up to form droplets. Therefore, most probably, droplet collision with the liquid jet core is not the only factor, nor the major factor, promoting hole formation. This ambiguity about hole formation is addressed in this research work. Liquid, round jet, computational simulations of Herrmann (Reference Herrmann2011) showed the disintegration of the liquid core to ligaments and droplets, and predicted the droplet sizes that detached from the jet core. However, the details of the mechanisms that led to ligament formation were not discussed.
JS showed that three-dimensional instability developed through an azimuthal instability, creating streamwise vorticity, lobe shapes on the cone crests and liquid ligaments extending from the lobes. The azimuthal instability of the 3-D liquid jet was initiated with the deformation of the axisymmetric vortex rings into a wavy ring, first in the braid region, i.e. between two consecutive cone crests of the primary KH waves. The hairpin vortices formed in the braid region and wrapped around the vortex rings in the ring region, i.e. KH cone crests, in a similar fashion to the vortical mixing-layer structures visualized by Bernal & Roshko (Reference Bernal and Roshko1986). The azimuthal instability then developed on the cone crests and hairpin vortices extended streamwise on the cone crests, forming the lobes which aligned with the vortex pattern. The azimuthal mode number of the vortex ring waves was equivalent to the number of lobes of the deformed vortex rings. A natural mode number of lobes was identified for a given configuration with a clear monotonically increasing dependence on
 $Re$
. For the primary values of
 $Re$
and
 $We$
studied, four lobes was typical. However, a strong forcing of initial azimuthal waviness of the liquid surface could produce a different number of lobes. The number of hairpin vortices, i.e. counter-rotating vortex pairs, was equal to the azimuthal mode of perturbation. These lobes elongated later in time and produced the ligaments.
2.2 Experimental studies on liquid jets and streams
The literature is not rich with experiments that show the lobe perforation and ligament formation due to tearing of the lobes from the liquid jet core. Experimental studies of liquid jet injection into higher-pressure air, applicable to diesel engines, via ballistic imaging technique by Linne et al. (Reference Linne, Paciaroni, Hall and Parker2006) and Duran et al. (Reference Duran, Porter and Parker2015) showed snapshots of the liquid–gas interface with voids, i.e. holes close to the rims. These pictures did not reveal whether those voids were actually perforated lobes or air confined between the rolled-up liquid protrusions. Experiments of Marmottant & Villermaux (Reference Marmottant and Villermaux2004) for a low
 $Re$
, low
 $We$
water jet into atmospheric air were not relevant to high-pressure applications. Although lobe formation can be detected in their results, it is unclear whether small holes have formed at the root of the ligaments, i.e. where ligaments attached to the jet core and the lobes.
The tearing action was seen in earlier works, especially experimental and theoretical studies dealing with low density ratio situations (i.e. atmospheric pressure conditions) where capillary instabilities rather than KH, RT and vortex–strain induced instabilities prevail. Dombrowski & Fraser (Reference Dombrowski and Fraser1954) experimentally observed sheet disintegration through the formation of the holes for a wide range of flow parameters. The liquid sheet was seeded with oil droplets acting as nuclei for the formation of holes. The surface tension acted to minimize surface energy, causing the holes to expand and coalesce to form larger holes. This produced long threads that in turn broke up to form the droplets. A low-viscosity and low-surface-tension liquid easily disintegrated after perforation. More recently, Lhuissier & Villermaux (Reference Lhuissier and Villermaux2013) used bubble injection to initiate puncture. Thin liquid films may puncture spontaneously when suddenly accelerated perpendicular to their plane (Bremond & Villermaux Reference Bremond and Villermaux2005). Liquid sheet perforation was also detected by Mansour & Chigier (Reference Mansour and Chigier1990) for liquid sheets exposed to high-velocity air streams. The aerodynamic shear at the interface produced a sheet with varying thickness that was punctured due to surface tension effects at locations with minimum thickness. Growth of the hole size, formation of a liquid thread at the rim of the sheet and ligament detachment occurred regularly. The perforations of the sheets in the Dombrowski & Fraser (Reference Dombrowski and Fraser1954) experiment at very low gas densities will not explain the hole formation in the conical crests at higher gas densities. Theory has shown those sheet perforations in a wide variety of planar, annular and bell-shaped sheet configurations to be caused by thinning resulting from capillary waves. Relative motion between gas and liquid and subsequent vorticity fields are not very important in that low gas density range (Sirignano & Mehring Reference Sirignano and Mehring2000, Reference Sirignano, Mehring, Hulba, Yang, Habiballah and Popp2005).
Outline of vortex structure and diamond-shaped region in planar mixing layer (Nygaard & Glezer Reference Nygaard and Glezer1990).

2.3 Vorticity dynamics of planar mixing layers
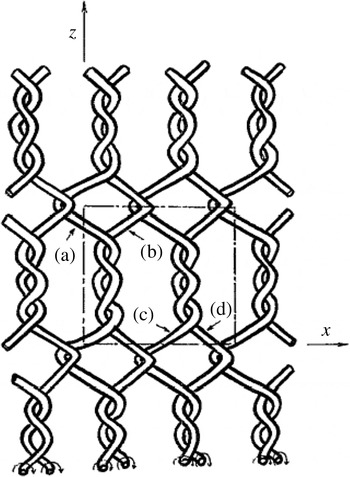
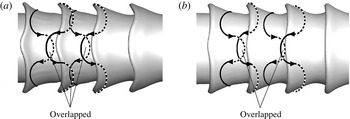
JS showed that there were similarities between the vorticity dynamics of planar mixing layers of the same density with two-phase round liquid jet injection due to formation of the hairpin vortices. The behaviour of a planar mixing layer excited by a time-harmonic wave with spanwise phase variation was visualized by means of Schlieren system by Nygaard & Glezer (Reference Nygaard and Glezer1990). The primary vortex rollers deformed in the spanwise direction and formed hairpin vortices in the braid region. The vortices on the crests, that were induced by the primary deformed vortices in the braid region, were
 $180^{\circ }$
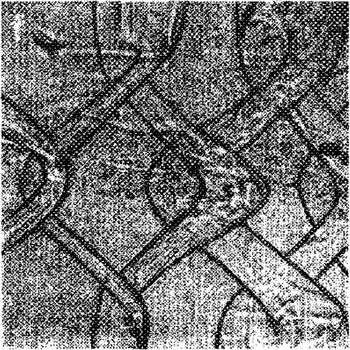
out of phase with respect to those in the braid. They finally developed into hairpin vortices extending with an orientation opposite to those in the braid. These two series of hairpin vortices overlapped and produced a diamond-shaped region arranged in a ‘chain-link fence’ pattern (Collis et al.
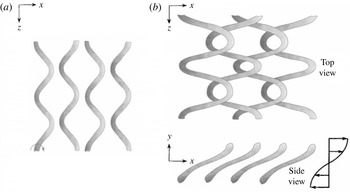
Reference Collis, Lele, Moser and Rogers1994) with smaller scales compared to the original coherent vortex structures, as figure 3 shows. As noted by Comte, Lesieur & Lamballais (Reference Comte, Lesieur and Lamballais1992), there is some controversy about the meaning of helical pairing versus true merger of vortex pairs. A true merger would involve a viscous connection of vortices which would require some time for development. The overlapping and intertwining was considered as localized pairing although there were no mergers involved between these vortices. This localized ‘helical pairing’ occurs when the spanwise wavelengths are extremely large, i.e. a factor of eight larger compared to the streamwise wavelength. For spanwise-to-streamwise wavelength ratios smaller than four, pairing does not happen and the crests of KH waves slightly tilt with respect to the streamwise direction (Schoppa, Hussain & Metcalfe Reference Schoppa, Hussain and Metcalfe1995). Therefore, they showed overlap from the top view as figure 4 illustrates. Numerical simulations of Collis et al. (Reference Collis, Lele, Moser and Rogers1994) with the same conditions of the Nygaard & Glezer (Reference Nygaard and Glezer1990) experiment showed that no merging occurred in the diamond-shaped region between the two hairpin vortices. Computations of Comte et al. (Reference Comte, Lesieur and Lamballais1992) demonstrated the ‘chain-link fence’ arrangement, i.e. ‘vortex lattice’ (see figure 5) for planar mixing layers forced by small Gaussian random perturbations. The core vortex lines wrapped around each other and formed hexagonal regions, as shown in figure 5, in agreement with results of Collis et al. (Reference Collis, Lele, Moser and Rogers1994). Comte et al. (Reference Comte, Lesieur and Lamballais1992) results suggested that the rollers did not coalesce into a single roller in the local pairing region. That is, self-induction acted in opposition to viscous effects that tended to form a single paired vortex in the overlap region. Forcing the mixing layer to create longer spanwise wavelengths might lead to actual merging of the vortices into a single pair (Collis et al.
Reference Collis, Lele, Moser and Rogers1994). The results in § 5 will have relatively short spanwise wavelengths so that coalescence is not expected. The hairpin vortex development and overlaps in figures 3–5 will be similar to those for liquid round jets. It will be seen that overlapping without merging can explain hole formation.
Schematic of helical pairing (a) earlier time, (b) later time for moderate spanwise wavelengths where ‘helical’ pairings do not occur (Schoppa et al. Reference Schoppa, Hussain and Metcalfe1995).

Schematic of vortex lattice in planar mixing layer (Comte et al. Reference Comte, Lesieur and Lamballais1992).

3 Specific research objectives
A main goal of this research is to identify mechanisms for ligament and bridge formation and lobe perforation processes as discussed in § 1. Again, these structures determine the final vital characteristics of the spray. Specifically, we analyse the lobes, holes, bridges, ligaments and droplets which appear in a consistent pattern for a given parameter domain. Of course, these are sequential, related to each other and relevant to the major global features. We discuss, in particular, the helical formation of hairpin vortices in the braid and ring region and compare to results for planar mixing layers. A study of the vortical structures connects the lobe perforation mechanism in jet flows with vortex lattice formation. However, unlike the single-phase planar mixing layers, density ratio, viscosity ratio and surface tension play significant roles in jet flow. The literature reveals no attempt to relate the liquid perforation with vortex pairing; however, we will show in § 5 that the ‘helical pairing’ mechanism is correlated with the formation of the holes in the liquid sheets. Furthermore, by inspecting the vortical structures of the jet flow, we can anticipate the locations of the holes in the lobes, bridges and ligaments. Different primary atomization regimes for a wide range of flow parameters will be illustrated. Finally, the break up of bridges to ligaments and droplets, and of ligaments to droplets, are analysed.
4 Computational method and 3-D liquid-segment model
The three-dimensional Navier–Stokes with level-set method yields computational results for the liquid-segment configuration which captures the liquid–gas interface deformations with time. The vorticity and the liquid–gas interface are obtained by post-processing. Unlike the previous liquid-segment research of JS, all the simulations have been performed with a
 $2.5~{\rm\mu}\text{m}$
mesh size distributed uniformly throughout the computational domain compared to the previous
 $5~{\rm\mu}\text{m}$
mesh. (Only a limited number of the previously published simulations had been performed with a
 $2.5~{\rm\mu}\text{m}$
mesh size.) The grid independency tests were performed previously by JS. They showed that the errors in the size of the ligaments, penetration length of the liquid jet and the magnitude of the velocity computed using different mesh resolutions were within an acceptable range. The effects of the mesh size, the thickness of the zone between the two phases, where properties have large gradients to approximate the discontinuities, and mass conservation of the level-set method have been previously addressed by JS. In addition, the accuracy tests and validation with experiments performed previously will not be repeated here.
The Navier–Stokes and continuity equations for an incompressible flow follow:
 $$\begin{eqnarray}\displaystyle & \boldsymbol{{\rm\nabla}}\boldsymbol{\cdot }\boldsymbol{u}=0, & \displaystyle\end{eqnarray}$$
 $$\begin{eqnarray}\displaystyle & \displaystyle {\it\rho}\frac{\text{D}\boldsymbol{u}}{\text{D}t}=-\boldsymbol{{\rm\nabla}}p+{\it\mu}{\rm\nabla}^{2}\boldsymbol{u}-{\it\sigma}{\bf\kappa}{\it\delta}(d)\boldsymbol{n}, & \displaystyle\end{eqnarray}$$
 $\boldsymbol{u}$
is the velocity field;
 $p$
,
 ${\it\rho}$
and
 ${\it\mu}$
are the pressure, density and dynamic viscosity of the fluid, respectively. In addition, the surface tension force applied on the interface is defined based on the level-set function and curvature of the interface, as is shown by the third term on the right-hand side of the Navier–Stokes equation (4.1b
), where
 ${\it\sigma}$
is the surface tension coefficient,
 ${\it\delta}$
is the Kronecker delta,
 $d$
represents the distance from the interface and
 $\boldsymbol{n}$
and
 ${\bf\kappa}$
are the normal vector directed toward the gas phase and the curvature of the interface, respectively. A finite-volume discretization on a staggered grid has been undertaken using the QUICK algorithm (Hayase, Humphrey & Greif Reference Hayase, Humphrey and Greif1992) and the Crank–Nicolson scheme for the unsteady term. The continuity and momentum equations are coupled through the SIMPLE algorithm (Patankar Reference Patankar1980). The level-set method developed by Sussman et al. (Reference Sussman, Fatemi, Smereka and Osher1998) and Osher (Reference Osher and Fedkiw2001) tracks the liquid–gas interface. The level set is a distance function with zero value at the liquid–gas interface; positive values in the gas phase and negative values in the liquid phase. It is denoted by
 ${\it\theta}$
and all the fluid properties for both phases in the Navier–Stokes equations are defined based on its value and the equations are solved for both phases simultaneously. Properties such as density and viscosity vary continuously but with a very large gradient near the liquid–gas interface. The level-set function
 ${\it\theta}$
is also advected by the unknown velocity field:
 $$\begin{eqnarray}\frac{\partial {\it\theta}}{\partial t}+\boldsymbol{u}\boldsymbol{\cdot }\boldsymbol{{\rm\nabla}}{\it\theta}=0.\end{eqnarray}$$
For detailed descriptions for this interface tracking see Dabiri, Sirignano & Joseph (Reference Dabiri, Sirignano and Joseph2007, Reference Dabiri, Sirignano and Joseph2008) and Dabiri (Reference Dabiri2009).
The computational domain consists of a Cartesian grid. The liquid segment has a circular cross-sectional area, a length of 1 mm and a
 $200~{\rm\mu}\text{m}$
diameter. It is centred in the computational domain and the axis of the liquid extends in the
 $x$
-direction. High-pressure air blows over the liquid segment. A piecewise initial velocity profile has been applied to both the liquid and gas phase with proper conditions at the interface (continuous velocity and shear stress) based on our previous axisymmetric simulation of the full transient jet that considered spatial instability of the liquid jet versus temporal instability in the current liquid segment with the same
 $Re$
and
 $We$
for the base case and with density ratio equal to 0.1. The velocity profile consists of an exponential profile;
 $u_{l}=c(1-\text{e}^{(r/R)^{2}})$
, where
 $c$
is a constant set to
 $-11~\text{m}~\text{s}^{-1}$
to ensure variation of the velocity from zero at the centreline to
 $70~\text{m}~\text{s}^{-1}$
at the interface and
 $R$
is the liquid jet radius. A hyperbolic–tangent profile has been implemented in the gas phase;
 $u_{g}=b\,\text{tanh}(ar)$
, where
 $a$
and
 $b$
are constants equal to
 $7500~\text{m}^{-1}$
and
 $100~\text{m}~\text{s}^{-1}$
, respectively. Therefore, the velocity increases from
 $70~\text{m}~\text{s}^{-1}$
at the interface, matching the liquid surface velocity to
 $100~\text{m}~\text{s}^{-1}$
in the far ambient gas. The boundary-layer thicknesses in the liquid and gas phase match the axisymmetric simulations of JS. Since the boundary-layer thickness can vary with time in those axisymmetric calculations of the starting jet, the velocity profiles obtained when the jet velocity reached
 $100~\text{m}~\text{s}^{-1}$
served as the initial condition in the liquid-segment calculations. Continuity of the velocity and shear stress applies across the interface and a pressure jump is related to surface tension and local surface curvature. The Navier–Stokes equations are solved in three dimensions and the level-set method is used to capture the interface topological changes.
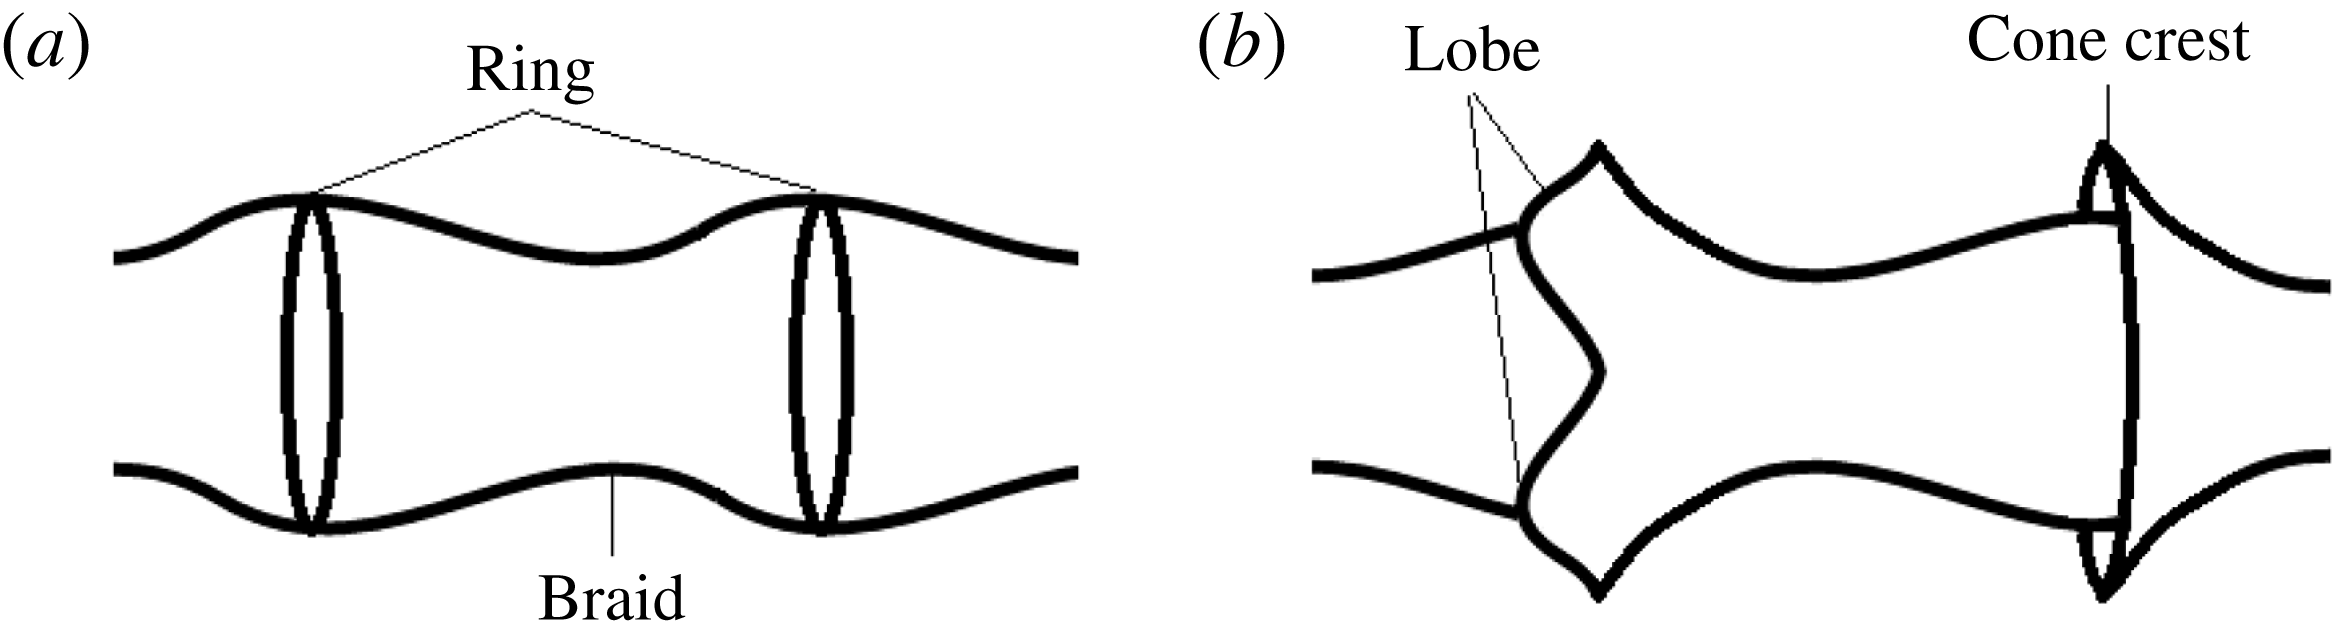
Schematic of different terminologies used for vorticity (a) and liquid–gas interface deformations (b).

There are four important non-dimensional groups with the following values in the base calculation set:
 $Re=320$
, 1600 and 5000 based on liquid properties, ambient gas velocity and segment mean diameter
 $D$
;
 $We=230\,000$
with similar bases; viscosity ratio
 ${\it\mu}_{g}/{\it\mu}_{l}=0.0022$
, 0.011 and 0.034; and density ratio
 ${\it\rho}_{g}/{\it\rho}_{l}=0.05$
, 0.10, 0.50 and 0.90. These parameter values were obtained by varying gas density, liquid viscosity and the surface tension coefficient
 ${\it\sigma}$
. Some cases with
 $We$
reduced by one or two orders of magnitude and
 $Re$
increased to 8000 and 16 000 are studied. For a given liquid material, segment mean diameter and liquid temperature, the Ohnesorge number
 $Oh\equiv {\it\mu}_{l}/\sqrt{{\it\sigma}{\it\rho}_{l}D}=W\text{e}^{1/2}/Re$
is fixed, providing a scaling relation between
 $We$
and
 $Re$
.
 $Oh$
has not been fixed as
 $Re$
and
 $We$
are varied through the base set of parameters. Generally, the
 $Oh$
value is high for normal liquids (e.g. water and kerosene) at standard conditions because we are especially interested in high-pressure situations where near-critical conditions are approached and surface tension is reduced. Nevertheless, some cases are calculated with an
 $Oh$
value representative of kerosene at standard conditions. A
 $Re$
based on gas properties would be roughly an order of magnitude greater than our liquid-based value. In our base calculations, the length of the initial axisymmetric sinusoidal wave was 100
 ${\rm\mu}$
m, its mean-to-peak surface amplitude was 10
 ${\rm\mu}$
m and the mean liquid-segment diameter was 200
 ${\rm\mu}$
m. For a few cases, wavelength and initial amplitude were increased. For more details on the initial and boundary conditions, see JS.
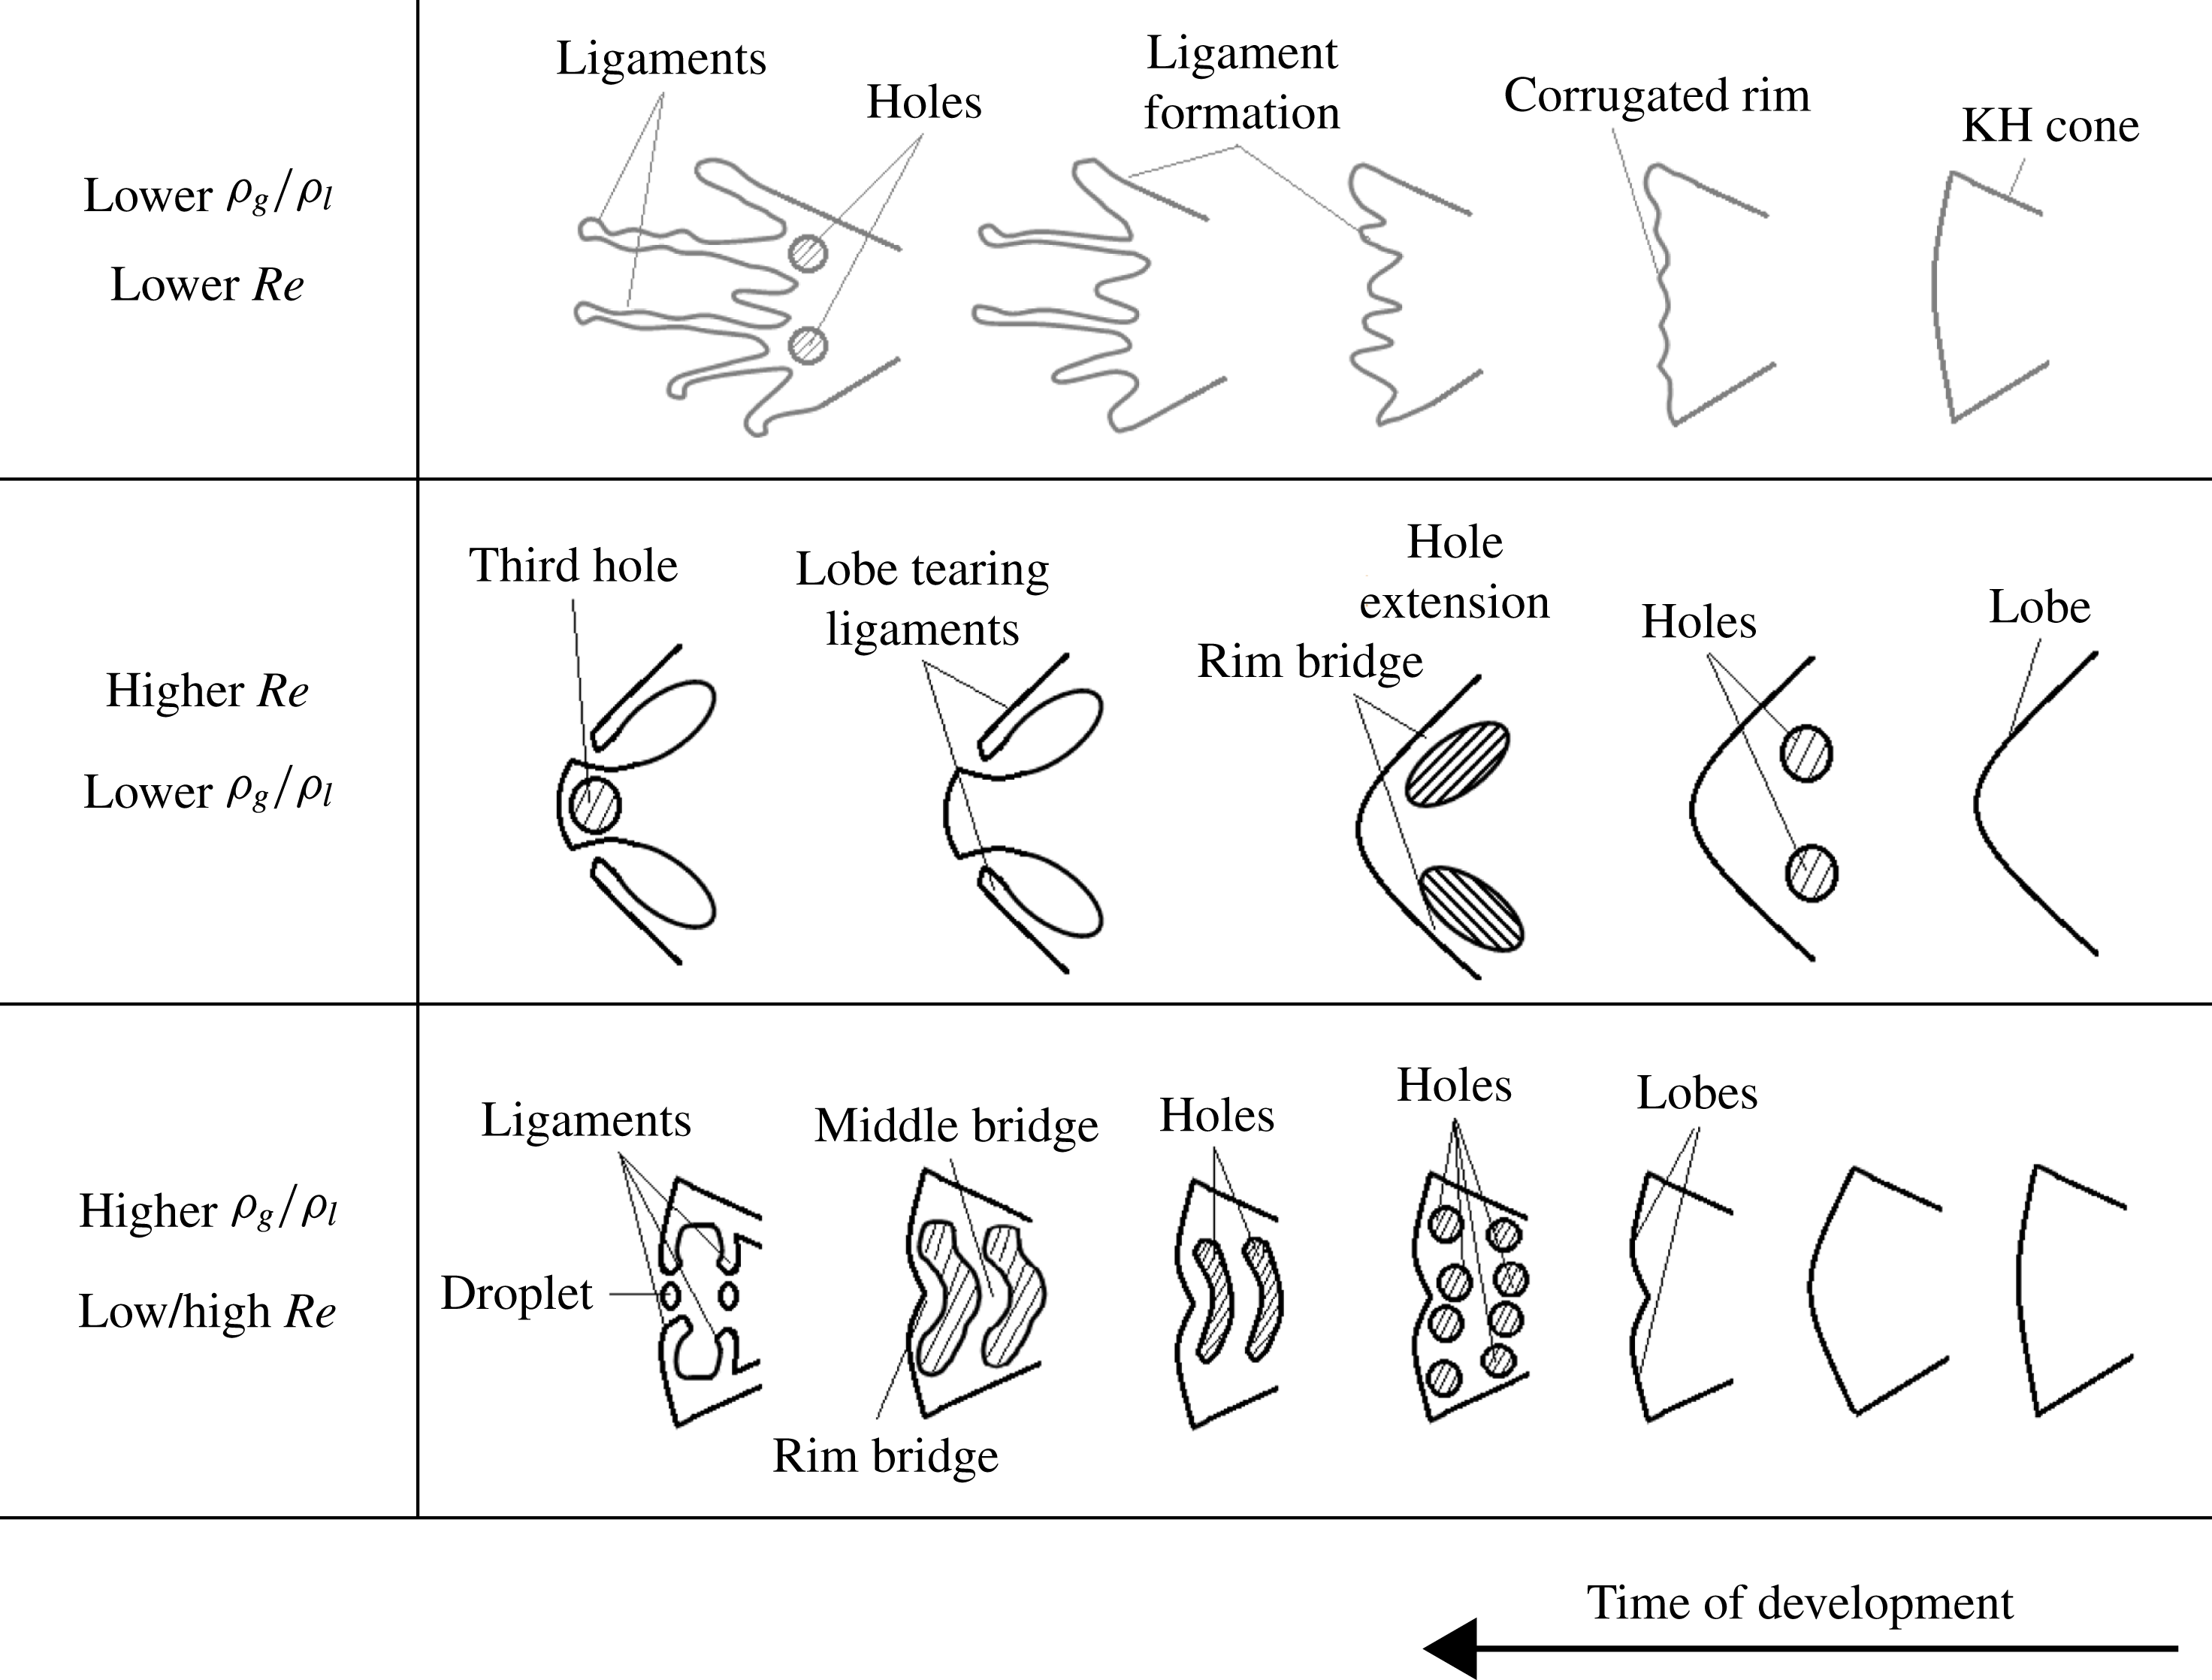
Schematic of different ligament formation mechanisms and the effects of density ratio
 ${\it\rho}_{g}/{\it\rho}_{l}$
and
 $Re$
.

5 Results
Several types of temporal development of the instability at the liquid–gas interface and formation of the ligaments for low and high density ratios and
 $Re$
are shown schematically in figure 7. We employ and relate the dual approaches of vortex dynamics and surface wave dynamics to more clearly delineate the complex 3-D flow physics. For this purpose, the language of wave dynamics is used to focus on crests, troughs and lobes and vortex dynamics terminology refers to rings, braids and hairpins. The instability starts from the initially axisymmetric KH waves. The crest of the KH waves, when amplified and slightly stretched in the axial direction, is referred to as the ‘cone crest’ or ‘KH cone crest’. As the 3-D character of the instability develops, the ‘cone crest’ divides into distinct rounded ‘lobes’. Now, in terms of the vorticity dynamics, the ‘KH cone crest’ and ‘KH troughs’ are equivalent to ‘rings’ and ‘braids’, respectively, as shown in figure 6. Time is shown increasing from right to left because, in later figures, the KH cone crests move to the left in the direction of the coaxial gas flow; thus, we see the temporal development on a KH cone crest as it moves to the left. For lower gas-to-liquid density ratios and low
 $Re$
, a three-dimensional instability deforms the interface by creating small-scale ‘corrugations’ at the rim of the KH cone crests. We refer to them as ‘corrugations’ to differentiate them from the higher gas-to-liquid density ratios and higher-
 $Re$
surface structures where distinct ‘lobes’ form. Two mechanisms for ligament formation are shown in this cartoon: in the top row, by elongation of the corrugations on the rims; and in the two lower rows, by formation of the holes in the lobe followed by hole extension and tearing of the rim. For low gas-to-liquid density ratios and low
 $Re$
(top row), a three-dimensional instability deforms the interface by creating small-scale corrugations at the rim of the KH cone crests. For this first scenario, the holes form after the first ligaments are created via extension from the lobe without relation to hole formation. Then, new ligaments form after these holes tear the rim. For higher
 $Re$
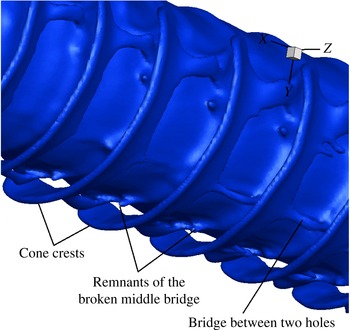
(second row), four lobes are formed without forcing (while more would form with the proper initial flow perturbations (see JS)). Two holes form off centre on both sides of each lobe. For very high gas-to-liquid density ratios (bottom row), the lobe formation is delayed and the lobe edge is less curved and less pronounced. This allows holes from neighbouring lobes to merge and create larger holes. The liquid entrapped between the rim and the large hole creates a narrow pipe-shaped liquid structure named here a ‘rim bridge’. Capillary instability of the rim bridge develops later and each bridge on the lobe sides breaks into a ligament. When two large holes form on the lobe at higher density, a middle bridge as well as the rim bridge is seen. The middle bridge also breaks into two ligaments and a droplet with the same mechanism as the rim bridge. This bridge break-up mechanism is not significantly affected by
 $Re$
for higher gas-to-liquid density ratios. The details of the bridge break up will be discussed in § 5.4. Modifications in behaviour due to increased surface tension will be described in § 5.3. The details of the sequence of bridge formation and break up followed by ligament formation and break up to droplets are essential to the spray character.
Detailed information concerning length scales associated with the structures sketched in figure 7 are relevant to the determination of droplet size. The time scales for the formations of the structures affect the growth rate of the two-phase mixture volume which relates to spray cone angle in the practical spatial development of a spray. The thicknesses of bridges and ligaments relate to droplet sizes.
In the following subsections, temporal instability is demonstrated for wide ranges of density ratios,
 $Re$
and
 $We$
. In several figures, vortex lines projected onto the interface, together with streamwise vorticity contours and streamline projections, show the relationships between the surface deformation and the vorticity dynamics.
5.1 Temporal development
The initial liquid–gas interface consists of an axisymmetric KH wave with a
 $100~{\rm\mu}\text{m}$
wavelength. This initial wavelength is selected based on previous axisymmetric calculations of a liquid jet injected at
 $100~\text{m}~\text{s}^{-1}$
through a 200
 ${\rm\mu}$
m-diameter orifice into an air chamber at 30 atm pressure. The 100-
 ${\rm\mu}$
m wavelength is dominant for a wide range of density ratios,
 $We$
and
 $Re$
. However, for a special case where the
 $We$
is one order of magnitude smaller (see figure 31), a longer wavelength dominates since the higher surface tension impedes the growth of smaller wavelengths. So, for the three-dimensional liquid-segment model, a 1 mm segment of the jet was considered with initial sinusoidal KH surface waves. Thus, a series of axisymmetric vortex rings were applied initially. The temporal instability of the liquid segment was studied by applying periodic boundary conditions in the streamwise direction. One cannot exactly correlate the starting time (e.g. orifice valve opening) of the spatially developing jet with the start of the current temporal development of the instabilities. However, our previous axisymmetric simulation (JS) of the full jet showed that the liquid jet penetration length reached 1 mm (the same as the length of our segment) after 50
 ${\rm\mu}$
s for the same flow conditions. Therefore, one can estimate that the reported calculation times of 30
 ${\rm\mu}$
s in the segment analysis is roughly equivalent to 80
 ${\rm\mu}$
s in the starting jet time. Although the calculation was initiated with a periodic temporal instability, the preferred direction of the gas flow causes some nonlinear spatial development of the instability. Thereby, unlike the classical linear KH instability results, some variations in behaviour occur from wave to wave.
The three-dimensional instability, i.e. deviation from axisymmetric behaviour, started with the formation of hairpin vortices, i.e. counter-rotating streamwise vortices in the braid region between two adjacent KH cone crests. Soon after, the KH cone crests also deform and, for the
 $Re$
in the base calculations, develop naturally into four lobes. The number of lobes can be affected by
 $Re$
and/or forced perturbation of air velocity. (No forcing is applied in this research.) The lobe locations on the cone crests correlated with locations of the hairpin vortices in the ring (crest) region. A phase difference in the azimuthal variable exists relative to the hairpin vortices that formed earlier in the braid region. Therefore, two pairs of counter-rotating streamwise vortices form on each lobe.
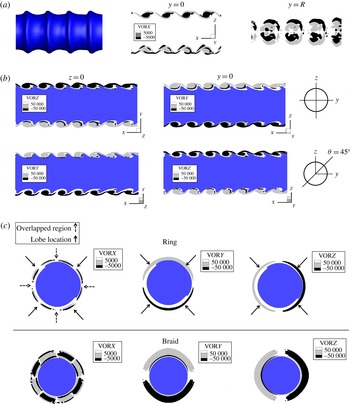
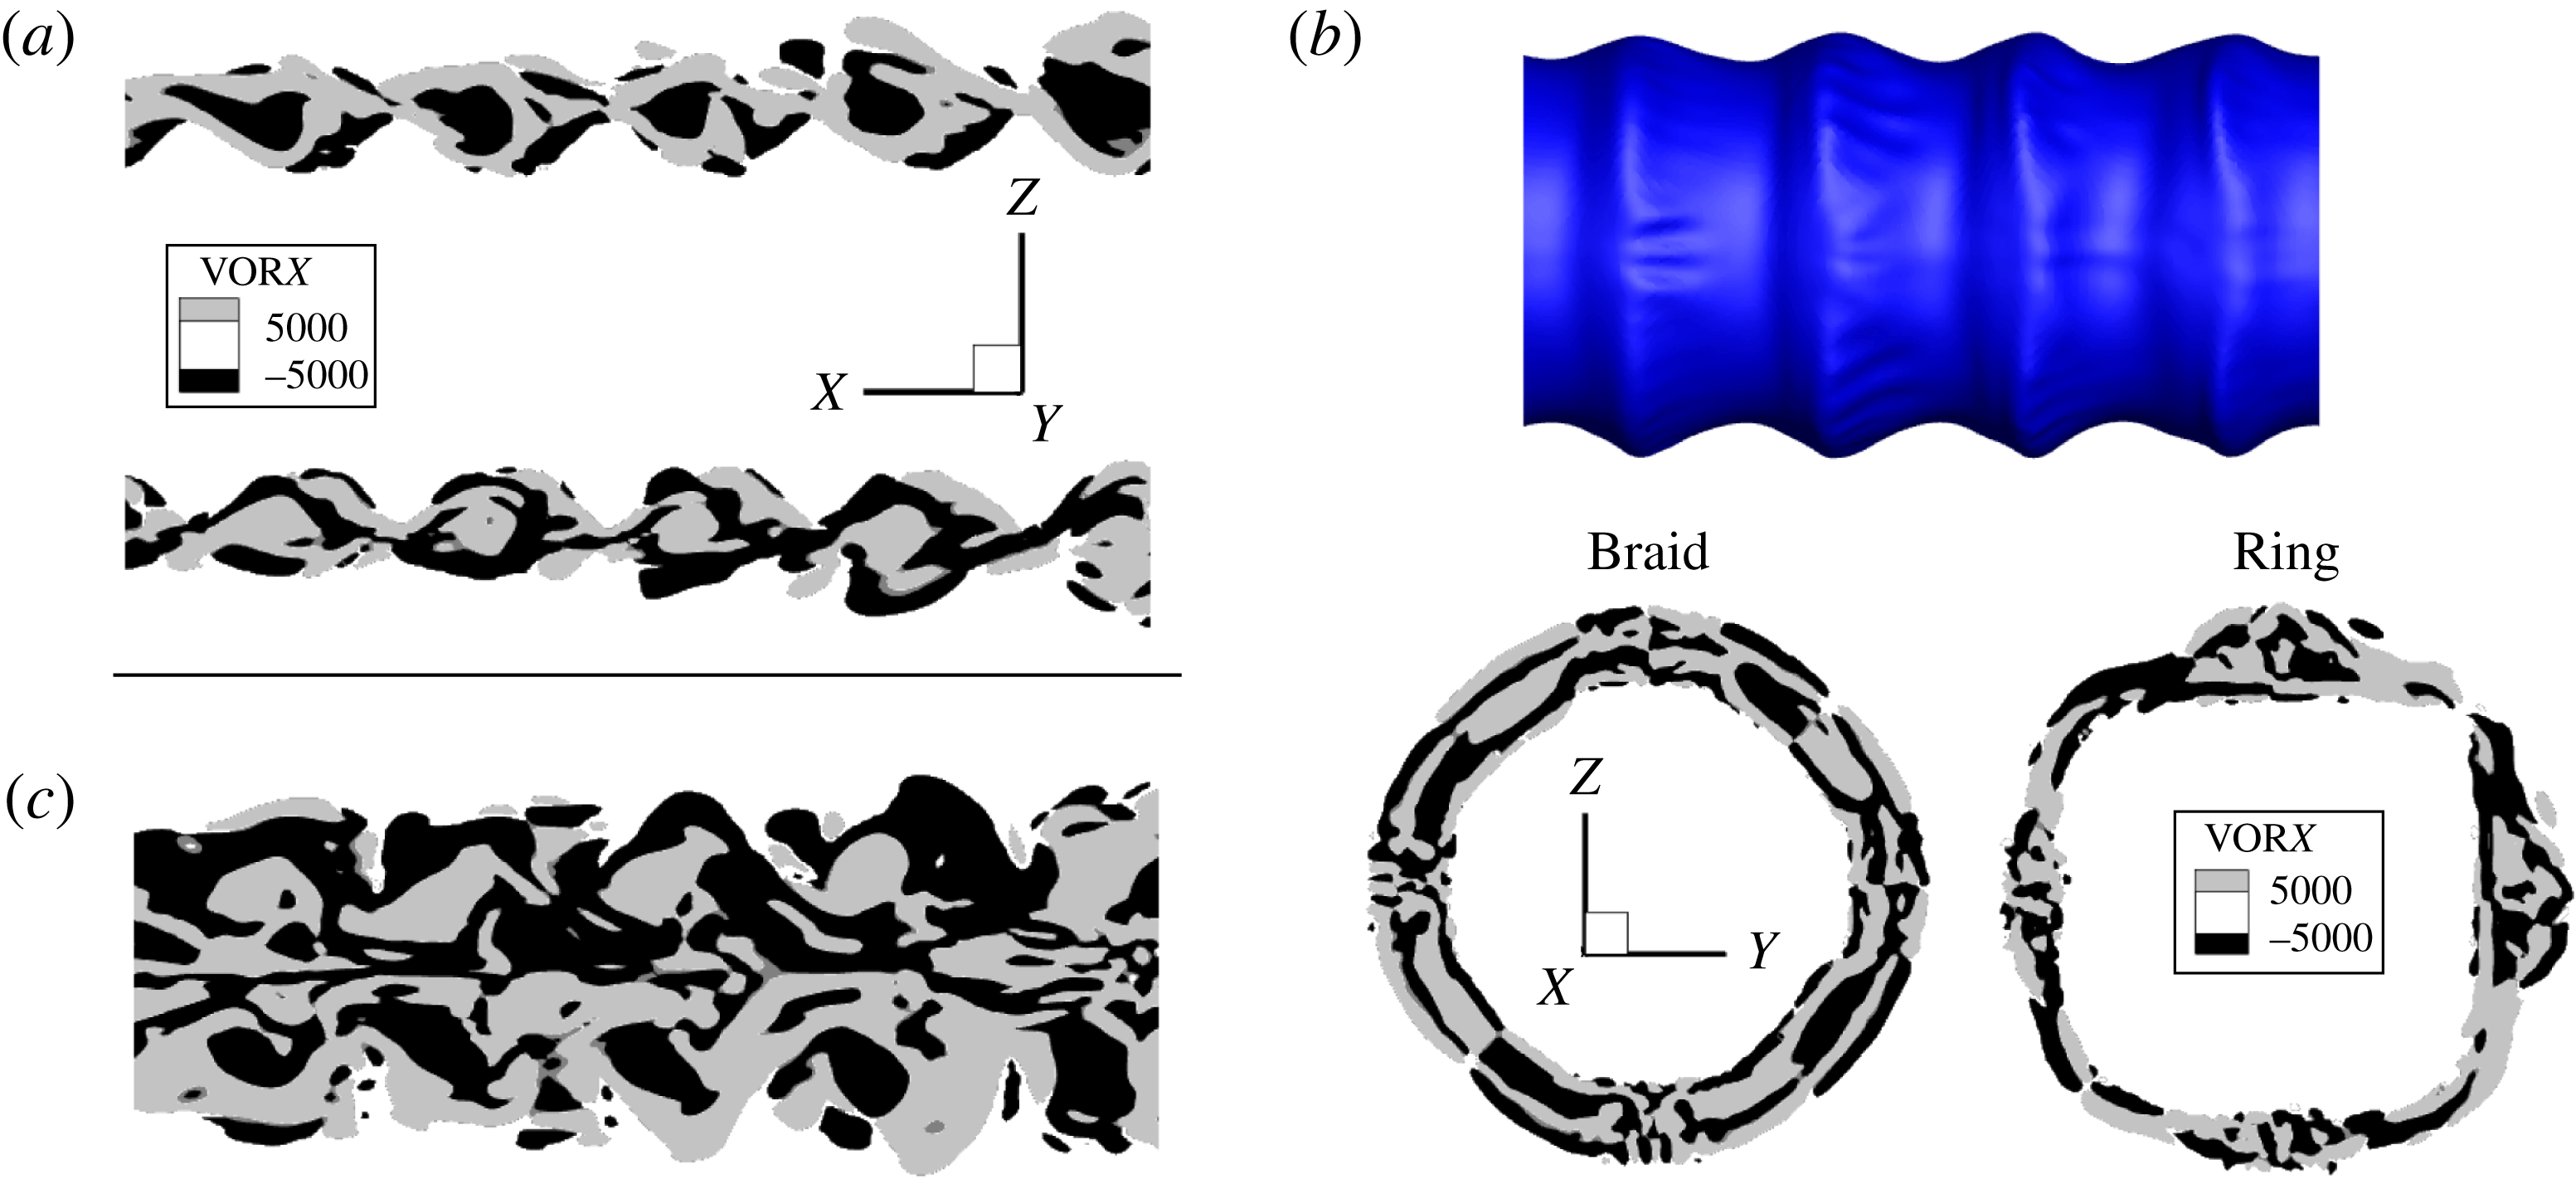
(a) Contours of streamwise vorticity in
 $xz$
plane through
 $y=0$
and
 $y=R$
; (b) contours of azimuthal vorticity in
 $xz$
and
 $xy$
meridian planes through
 $y=0$
and
 $z=0$
, respectively, (first row) and contours of two vorticity components for
 ${\it\theta}=45^{\circ }$
meridian plane (second row); and (c) contours of streamwise and azimuthal vorticity in
 $yz$
-plane on the ring and braid regions indicating the overlapped regions and lobe locations with arrows:
 $t=30~{\rm\mu}$
s,
 $Re=1600$
,
 $We=230\,000$
and gas-to-liquid density ratio is 0.1. (The unit of vorticity in the contour plot is
 $\text{s}^{-1}$
and gas flows from right to left.)

Figure 8(a) defines the
 $xyz$
-coordinate system and displays, at 30
 ${\rm\mu}$
s, the liquid–gas interface and the contours of streamwise vorticity magnitude in
 $xz$
planes for gas-to-liquid density ratio equal to 0.1,
 $Re=1600$
and
 $We=230\,000$
; showing clearly evidence of hairpin vortex structures. The pattern is similar to the findings for the planar mixing layer displayed in figures 3 and 4. However, the spanwise measure is replaced by the azimuthal angle for liquid round jets. The contours are shown in figure 8(a) in two planes, viz., the
 $y=0$
meridian plane and the
 $y=R$
offset plane. The alternating sign of streamwise vorticity is shown from several views in this figure, clearly identifying the streamwise overlapping of the hairpin vortices with a
 $180^{\circ }$
azimuthal phase difference. Ring hairpins oriented downstream come above braid hairpins extended upstream, causing the phase difference of the type sketched in figure 4(b). Streamline projections confirm that vortical structures of the type identified by Liepmann & Gharib (Reference Liepmann and Gharib1992) for uniform-density flows as ‘side jets’ with counter-rotating pairs appear; see figure 14.
Figure 8(b) shows, in the top row, the
 $y$
and
 $z$
components of vorticity in the
 $xy$
and
 $xz$
meridian planes through
 $z=0$
and
 $y=0$
planes, respectively. In the second row, these vorticity components are shown on the meridian plane crossing
 ${\it\theta}=45^{\circ }$
. The liquid phase is shown in dark colour. Near anti-symmetry about both the
 $y$
and
 $z$
axes can be seen. The views from the downstream side looking upstream (i.e. in the negative
 $x$
-direction) presented in figure 8(c) show the arrangement of the hairpin vortices, i.e. alternating positive (light) and negative (dark) streamwise vortex pairs around the circumference of the liquid jet (shown in the dark colour) in the braid and downstream ring region. The overlapping layer structures in the braid and ring are
 $180^{\circ }$
out of phase. For the higher
 $Re$
, a clear correlation of four locations for later lobe formation with hairpins is shown with solid arrows around the jet while vorticity overlapped regions have been shown with dashed arrows on the same figure. The contours of
 $y$
and
 $z$
-components of vorticity show that the azimuthal vorticity does not change sign passing the ring regions toward the downstream braid. The locations where both components of vorticity concentrate, shown with arrows, correspond to the location of the future lobes through
 ${\it\theta}=45^{\circ }$
and
 ${\it\theta}=135^{\circ }$
planes consistent with (b). The absolute value of the streamwise vorticity is one order of magnitude smaller than the azimuthal vorticity since the deviation from axisymmetric behaviour is still not very significant at 30
 ${\rm\mu}$
s.
Isosurface of the liquid–gas interface accompanied by schematic of hairpin vortices on the ring and braid region at
 $t=30~{\rm\mu}$
s (b) and
 $t=35~{\rm\mu}$
s (a); gas-to-liquid density ratio is 0.1,
 $Re=1600$
,
 $We=230\,000$
. The solid and dashed lines show hairpin portions stretching downstream and upstream, respectively. Gas flows from right to left.

Figure 9 shows a sketch of the hairpin vortices in the braid and ring regions superimposed on the computed interface for 30 and 35
 ${\rm\mu}$
s. One can see the orientation and the stretching pattern of the hairpin vortices and the overlapped region with respect to the lobe locations. The solid lines correspond to the portions of the hairpin being stretched in the flow direction while the dashed lines refer to the hairpin portions being stretched in the opposite direction to the flow. Note that, for the high
 $Re$
of interest here, inertial effects dominate and vortex lines and material lines are almost identical. Thus, the hairpins are being stretched because the fluid in the braid is being stretched while the fluid at the front of the crest is being curled.
This two-phase round jet configuration has qualitative similarity with the topology of the streamwise vortices in the single-phase plane mixing layers described by Bernal & Roshko (Reference Bernal and Roshko1986). In the vicinity of the lobe, the downstream stretching hairpin from the ring passes over the upstream stretching hairpin from the braid as the curling action occurs. As is seen, the streamwise components of vorticity are
 $180^{\circ }$
out of phase in the overlapped regions and the location of the lobes is consistent with figure 8(a,c).
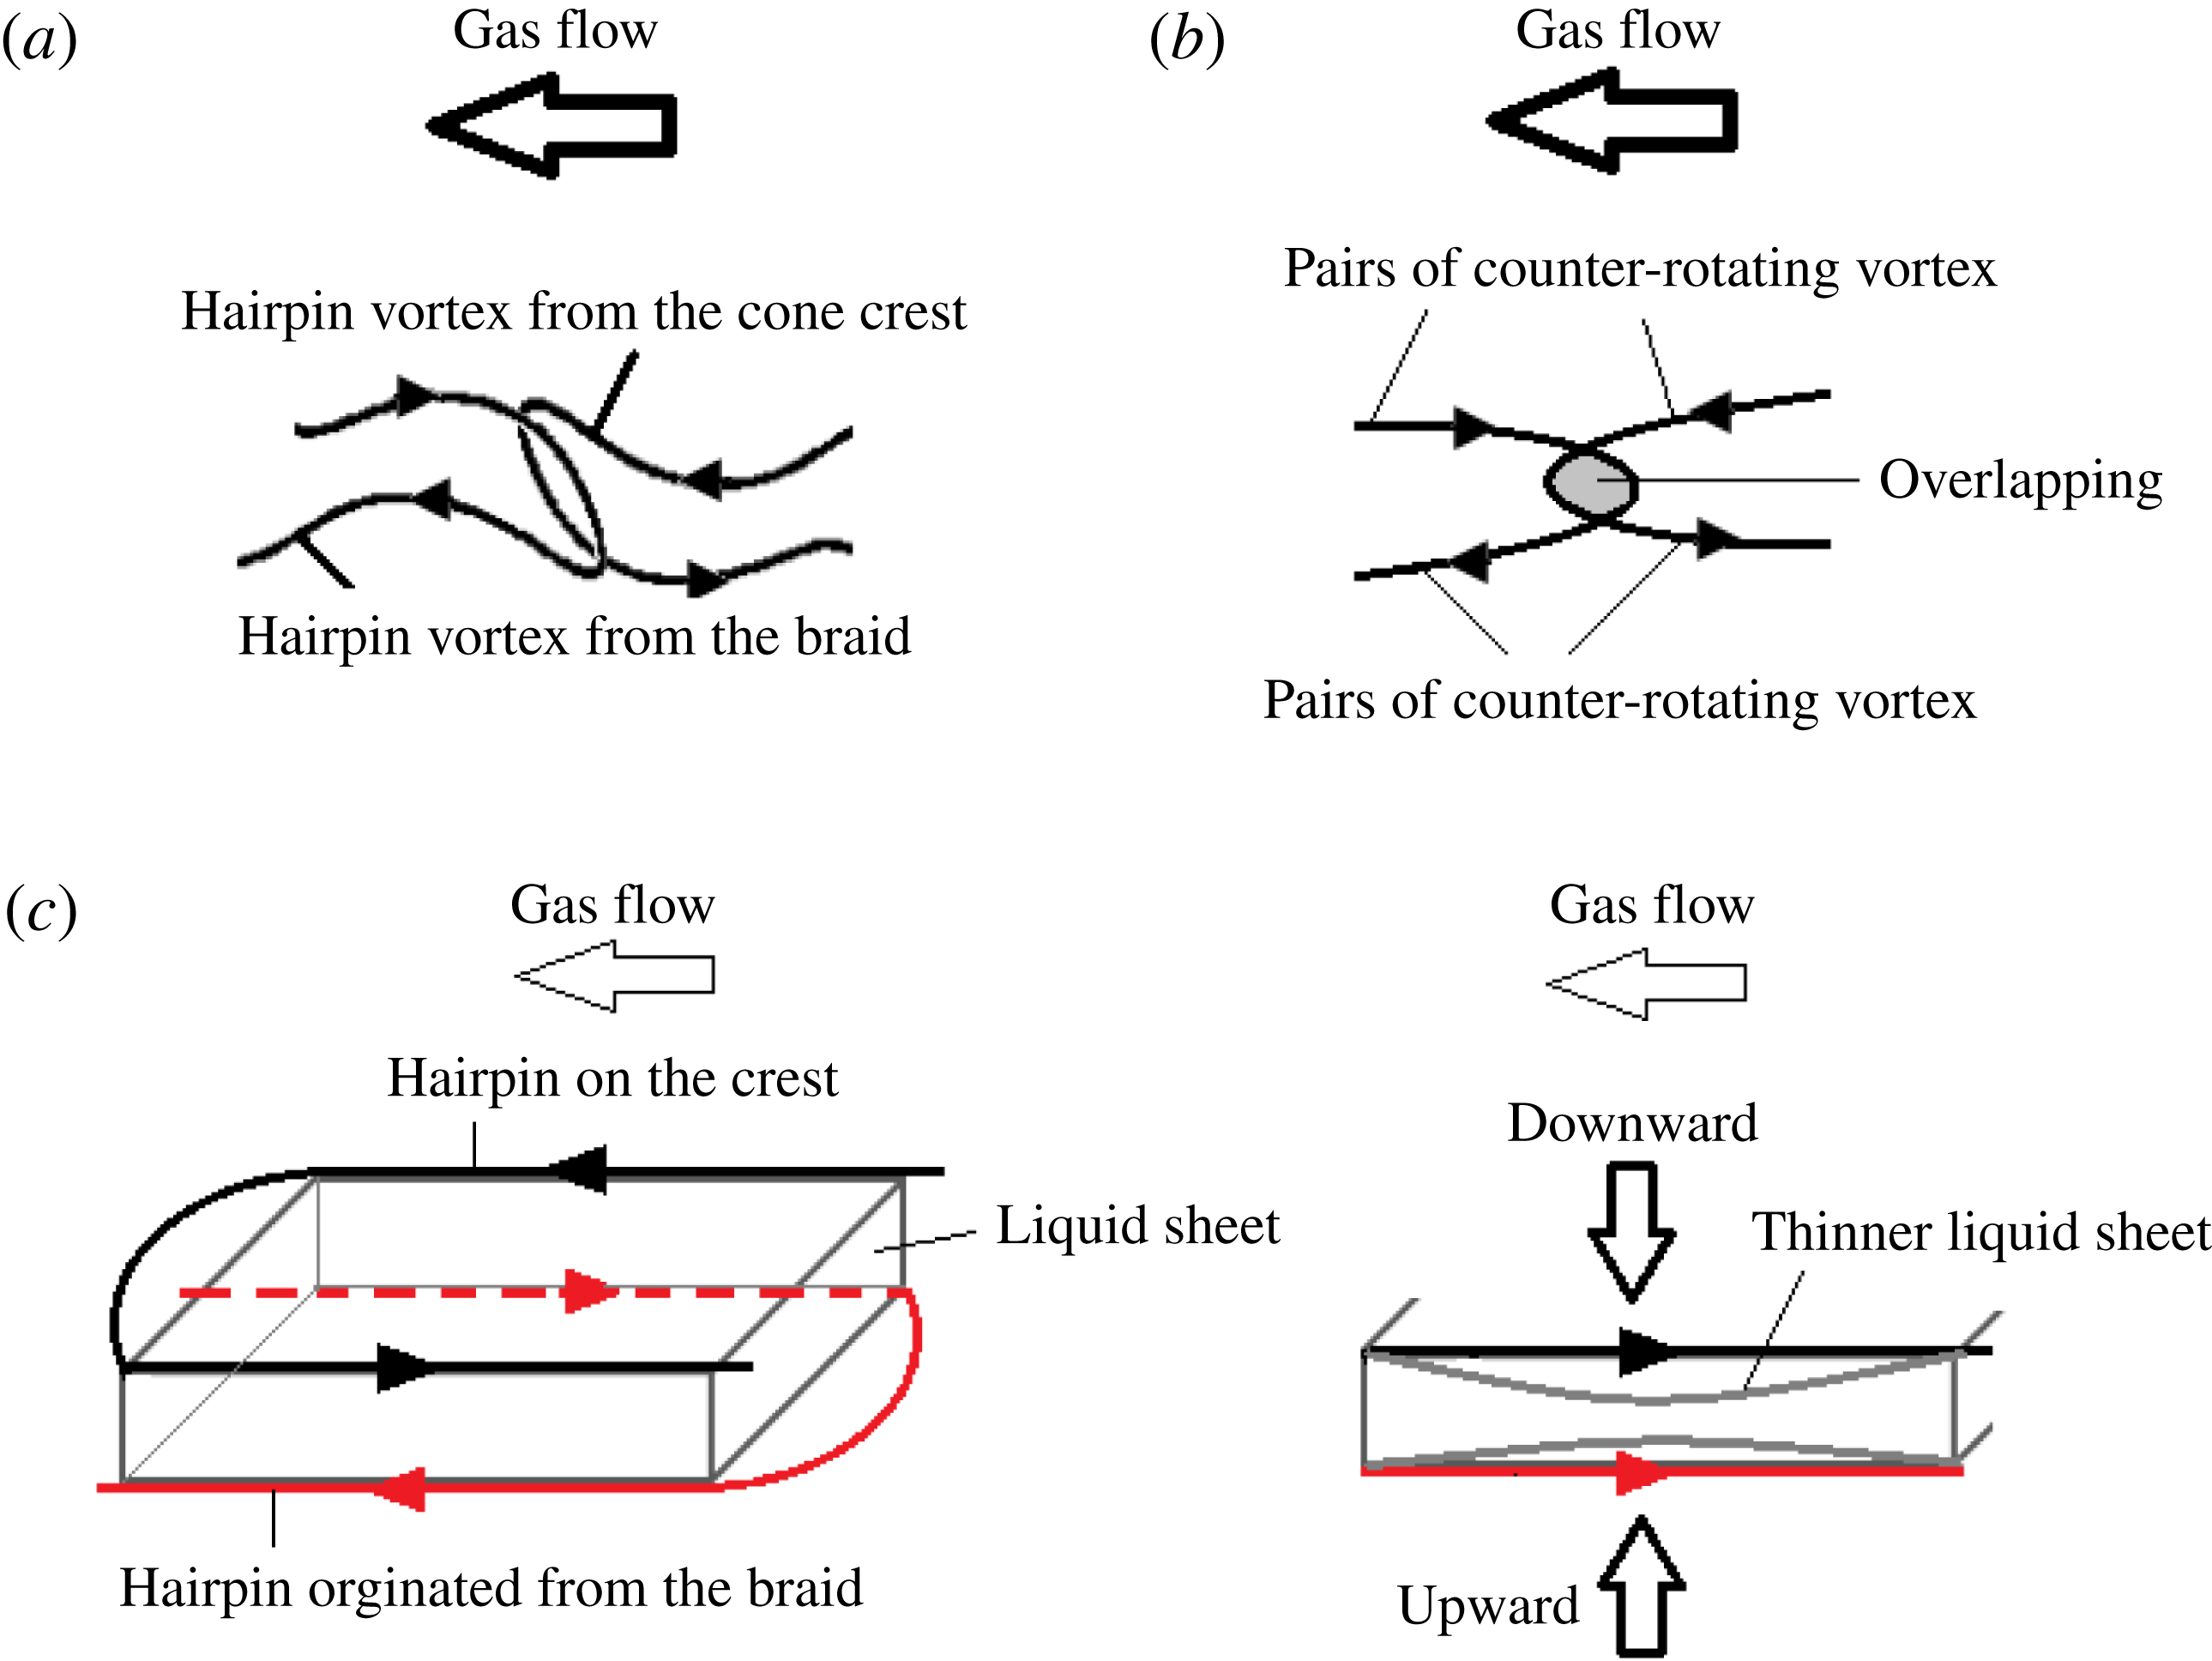
Schematic of overlapping of the two hairpin vortices from the crest and the braid; (a) side view; (b) top view; (c) thinning of the liquid on the crest due to the fluid motion with view towards the negative
 $x$
-direction, (gas flows from right to left in a–c).

Figure 10(a,b) schematically depict two neighbouring hairpin vortices in the liquid–gas interface region, one originating from the cone crest and the other from the braid, with views from the side and top, respectively. The orientation of counter-rotating vortex pairs and region of vortex overlapping are also shown. Now, if we consider the interaction between these two like-signed vortices near the hairpin overlap, figure 10(c) shows a side view of the vortex structure with the liquid sheet located between the two hairpin vortices. So, following the direction of the swirl for the two vortex lines, the mutual rotation of the vortex lines (which are approximately material lines at our high
 $Re$
) pushes the top surface of the liquid sheet downward and the bottom sheet surface upward. This causes the liquid sheet to become thinner and vulnerable to puncture at that region. This will be quantitatively shown later in this section. Generally, a liquid sheet subjected to these conditions may or may not puncture; it could recover instead. However, its behaviour is greatly dependent on other flow conditions, e.g. the circulation and surface tension. Our simulations show that, for all the punctured sheets with higher gas-to-liquid density ratio and low- or high-
 $Re$
conditions, where the vortical structures are more orderly and defined by the vortex lattice, the above mentioned mechanism for hole formation prevails.
Further calculations were done to demonstrate that the azimuthal orientation of the lobes was not a consequence of the numerical error due to mesh alignment in the Cartesian grid. Simulations with an initial weak perturbation of gas velocity with mode number equal to four with a small phase shift, viz.,
 $u_{g}=1+0.05\sin (4{\it\theta}+{\rm\pi}/8)$
showed that firstly, four lobes appeared in both cases; however, with a weak forcing they appeared earlier in time compared to the unperturbed case, as was expected. Secondly, the orientation of the four lobes coincided with a
 ${\rm\pi}/8$
degrees rotation of the coordinate system. This confirms that the orientation of the lobes in these numerical simulations is strongly dependent on the initial conditions, i.e. mode number, amplitude and phase shift of the perturbation. Therefore, it can be concluded that the case with mode number four is actually one of the natural modes for lower
 $Re$
, as already indicated in JS. Furthermore, it was shown in JS that perturbation of the gas with a mode number equal to five created five lobes with no alignment of the lobes according to the Cartesian grid.
Simulations with a 50 % coarser mesh compared to the results presented here demonstrated that the hole formation occurred at the same azimuthal location as for the finer grid. However, hole formation occurred earlier in time with the finer grid. Small-scale structures, i.e. smaller droplets and bridge formation were resolved with the finer grid. So, regardless of the size of the mesh, the holes form due to the same vorticity structures that lead to the thinning of the sheets, formation of the holes and finally break up.
The liquid–gas interface and the contours of streamwise vorticity magnitude in the
 $xz$
and
 $yz$
planes for gas-to-liquid density ratio equal to 0.1 and for
 $Re=320$
for the ring and braid regions are shown in figure 11. The alternating streamwise vorticity regions are smaller and less orderly for lower
 $Re$
compared to figure 8(a) which leads to formation of small-scale corrugations on the rims of the cone crests for low
 $Re$
at later times, which will be discussed in § 5.2. The hairpin vortex formations are more orderly for higher
 $Re$
, as was discussed in figure 8.
(a,c) Streamwise counter-rotating vortex pairs in
 $xz$
plane: (a)
 $y=0$
meridian plane and (c)
 $y=R$
plane; (b)
 $yz$
-plane and interface in
 $xz$
-plane:
 $t=30~{\rm\mu}$
s,
 $Re=320$
,
 $We=230\,000$
and gas-to-liquid density ratio is 0.1. (The unit of vorticity in the contour plot is
 $\text{s}^{-1}$
and gas flows from right to left.)

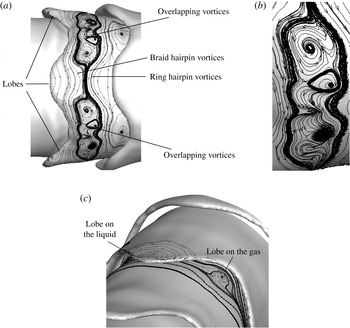
(a) Isosurface of liquid–gas interface with projected vortex lines indicating the hairpin vortices and two regions of overlapping vortices between the lobes, (b) a magnified picture of the overlapping vortex region at
 $t=38~{\rm\mu}$
s, (c) vortex structures on the liquid lobe and on the gas sheet between the lobe and jet core: at
 $t=40~{\rm\mu}$
s, gas-to-liquid density ratio is 0.1,
 $Re=1600$
,
 $We=230\,000$
. (Gas flows from right to left.)

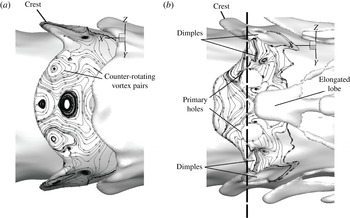
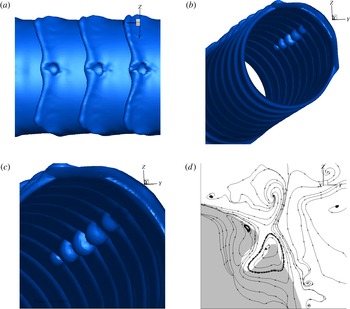
Figure 12(a) shows one complete lobe and partially shows the sides of two other lobes for gas-to-liquid density ratio equal to 0.1 and
 $Re$
and
 $We$
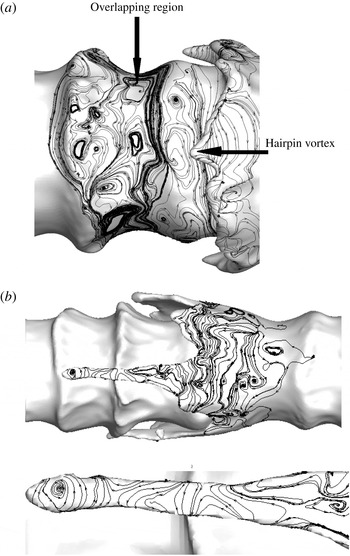
equal to 1600 and 230 000, respectively. The projected vortex lines on the interface, together with the streamwise vorticity contours of figure 8, illustrate the hairpin vortices coming onto the lobe from the braid, orienting in the opposite direction to the flow, i.e. to the right. Also seen are the hairpin vortices coming from the upstream lobes, i.e. pointing to the left. These interpretations follow from comparisons of figure 12 with 8 and 9. Later, examination of the streamline projections on the
 $yz$
-plane will confirm the presence of counter-rotating axial vortex structures. In figure 12(b), the overlapping vortex region between two neighbouring lobes has been magnified; later, holes will form in this region. These vortices, including the hairpin vortices, approach each other and form the diamond-shaped region of the type shown in figure 3. That is, this overlapping region is very similar to the vortex lattice observed experimentally for single-phase planar mixing layers, as shown there. Each projected vortex line in the overlapping region expresses a spirally converging vortex line about a centreline perpendicular to the projected surface element as shown in the magnified figure. Although it might seem from figure 12 that these vortices are merging, no merger occurs. The hairpin vortices in the cone crests are above the hairpin vortices in the braid region. This can be explained by comparing the wavelengths in the azimuthal direction with the streamwise wavelength, i.e. that of the KH waves. As discussed in § 2.3, for small spanwise-to-streamwise ratio of wavelengths, i.e. with four lobes or more, merging is not expected. However, the liquid located between these two vortices in the overlapping region will be displaced by the opposing rotational directions from two neighbouring vortices. The strands of the hairpin vortices of opposite orientation stand slightly apart at a distance similar to the schematic of figure 4. From another perspective, shown in figure 12(c), the vortex lines projected on the gas between the liquid sheet and the main liquid body could be viewed as a sheet of gas formed from a crest of a wave on the gas surface instead of the liquid surface. It can be seen that lobes form on this gas sheet, i.e. the gas penetrates further into the liquid at some azimuthal positions. Actually, these opposite facing gas lobes (upstream oriented for gas flow) are a half cycle out of phase azimuthally with the liquid lobes.
(a) Isosurface of liquid–gas interface with projected vortex lines indicates the hairpin vortices have approached the rims of the lobe at
 $t=44~{\rm\mu}$
s; (b) two holes and four dimples at
 $t=46~{\rm\mu}$
s: gas-to-liquid density ratio is 0.1,
 $Re=1600$
,
 $We=230\,000$
. (Gas flows from right to left.)

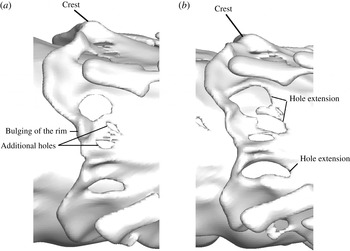
Figure 13(a) demonstrates the later development of the lobes of figure 12(a). The overlapping vortices have advected downstream with the flow and have moved above the lobe. The lobe has been extended and its surface area has increased compared to figure 12(a). Two microseconds later, as shown in figure 13(b), two holes and four dimples form on the lobe. Holes form first near the regions of lattice formation identified in figure 12 and thereby away from the central azimuthal position where the lobe extension in the downstream direction is greatest. The dimples then become punctures, creating new holes as shown in figure 16, where the view has been slightly rotated in the azimuthal direction to illustrate better the new holes formed from the dimples in figure 13(b) and additional small holes. The overlapping vortical structures near the tip of the cone produces counter-rotating vortex pairs near the rim that cause the formation of a small bulge, i.e. pinch. Therefore, the counter-rotating vortex pairs that form in the overlapping region can create dimples if the liquid between the opposite sign vortical structures is pushed downward and pinches when it is pushed outward. These surface deformations have been observed without mechanistic explanation in computational simulations of Desjardins & Pitsch (Reference Desjardins and Pitsch2010) for a planar jet.
(a) Streamlines projected on the cross-sectional
 $yz$
plane crossing the lobe and the holes at
 $t=46~{\rm\mu}$
s and the path of integration with respect to the lobe for figure 15: gas-to-liquid density ratio is 0.1,
 $Re=1600$
,
 $We=230\,000$
; (b) velocity profiles through the hole and through the lobe between the two holes of (a).
 $v$
and
 $w$
are the
 $y$
and
 $z$
components of velocity, respectively.

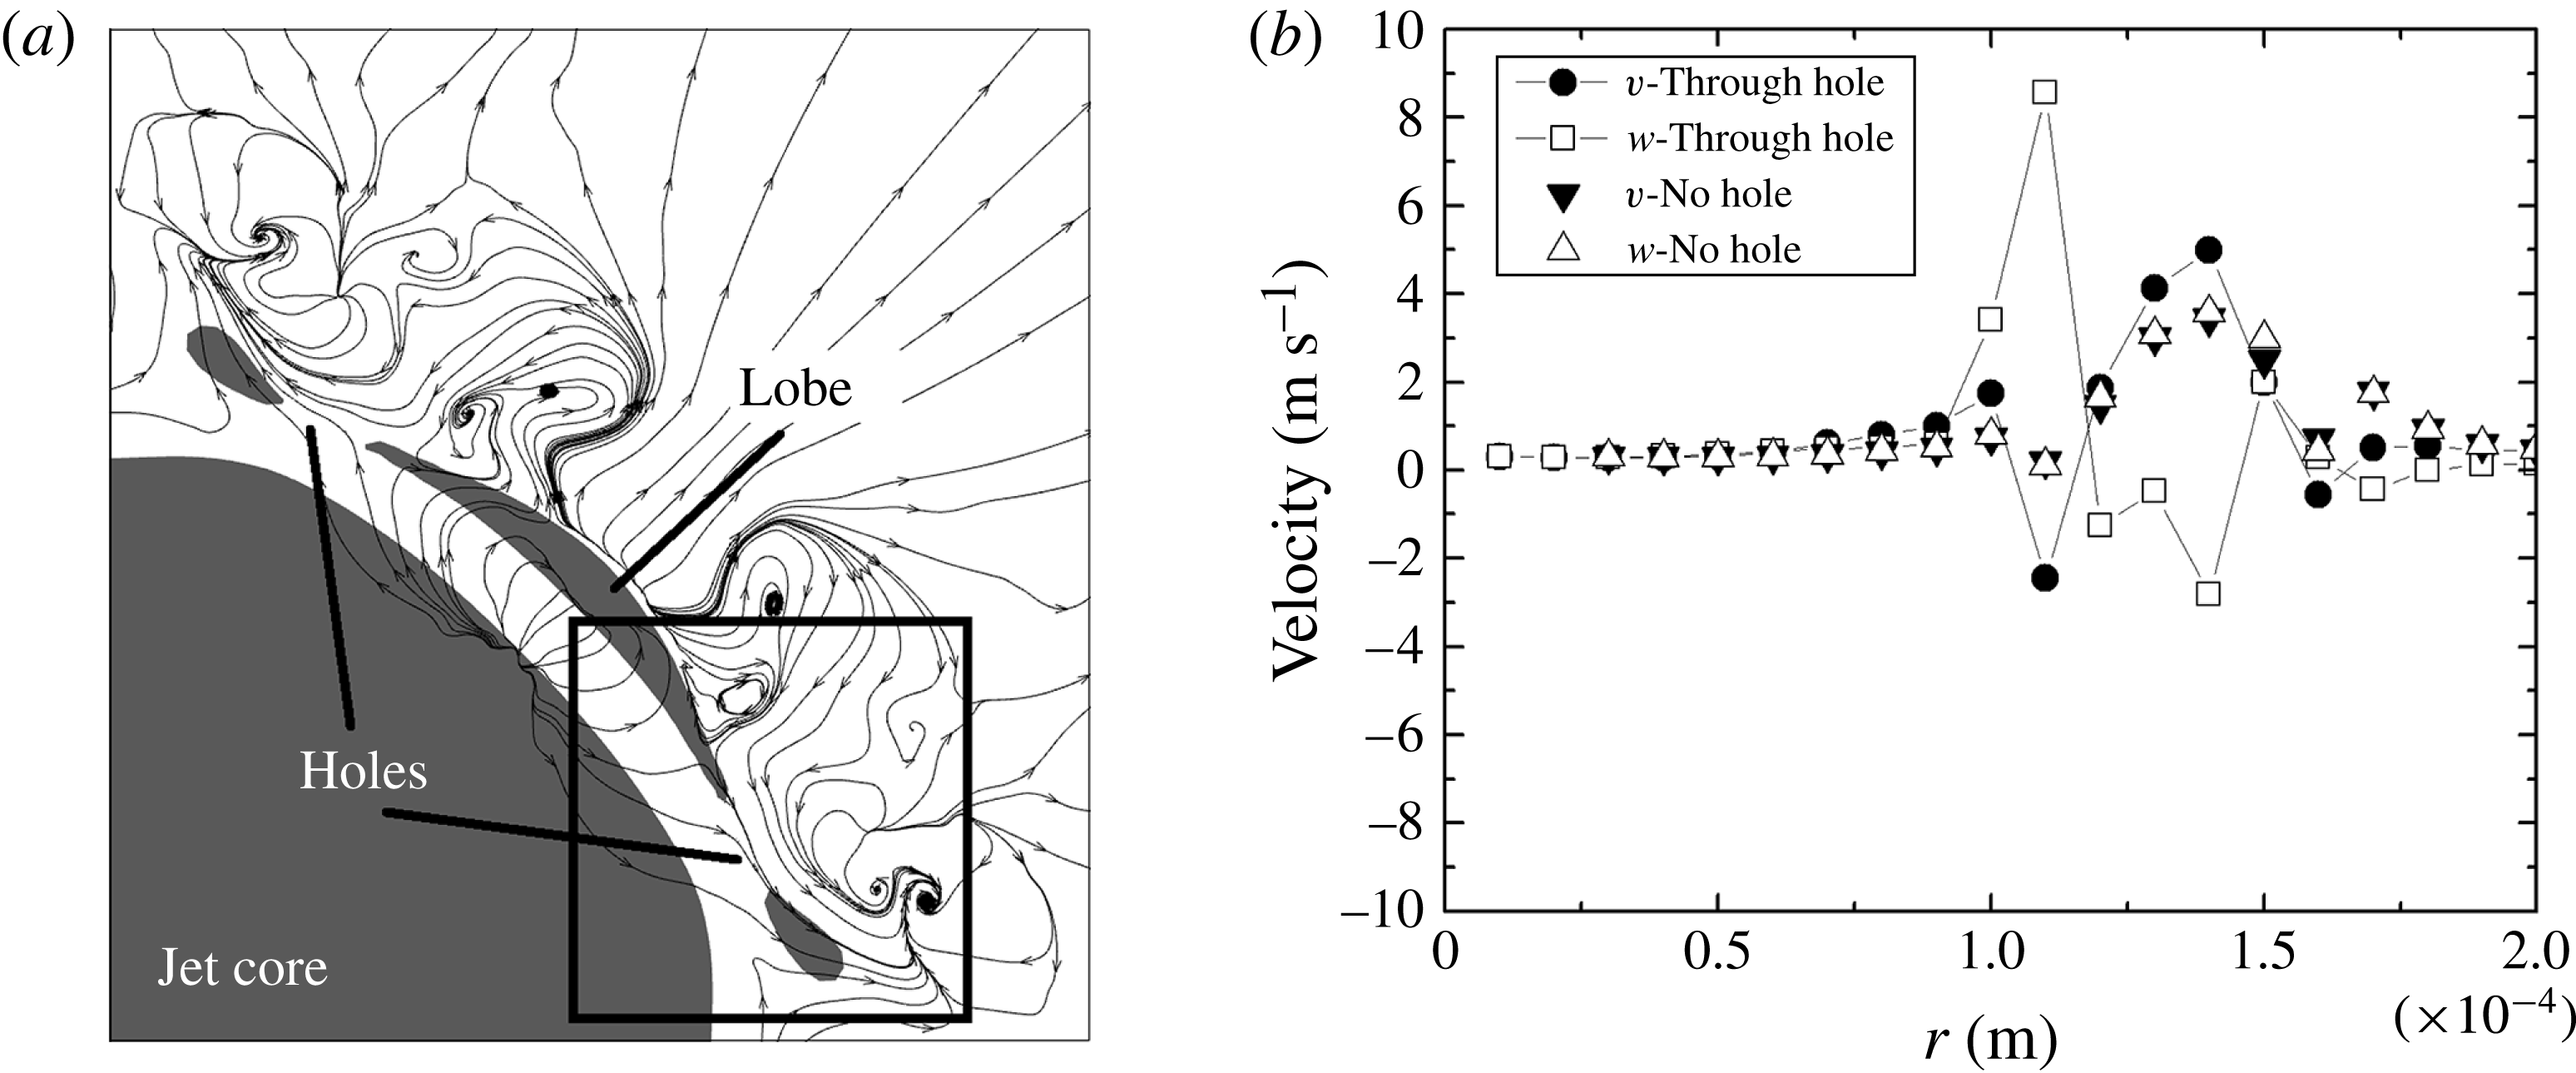
Projected streamlines on the
 $yz$
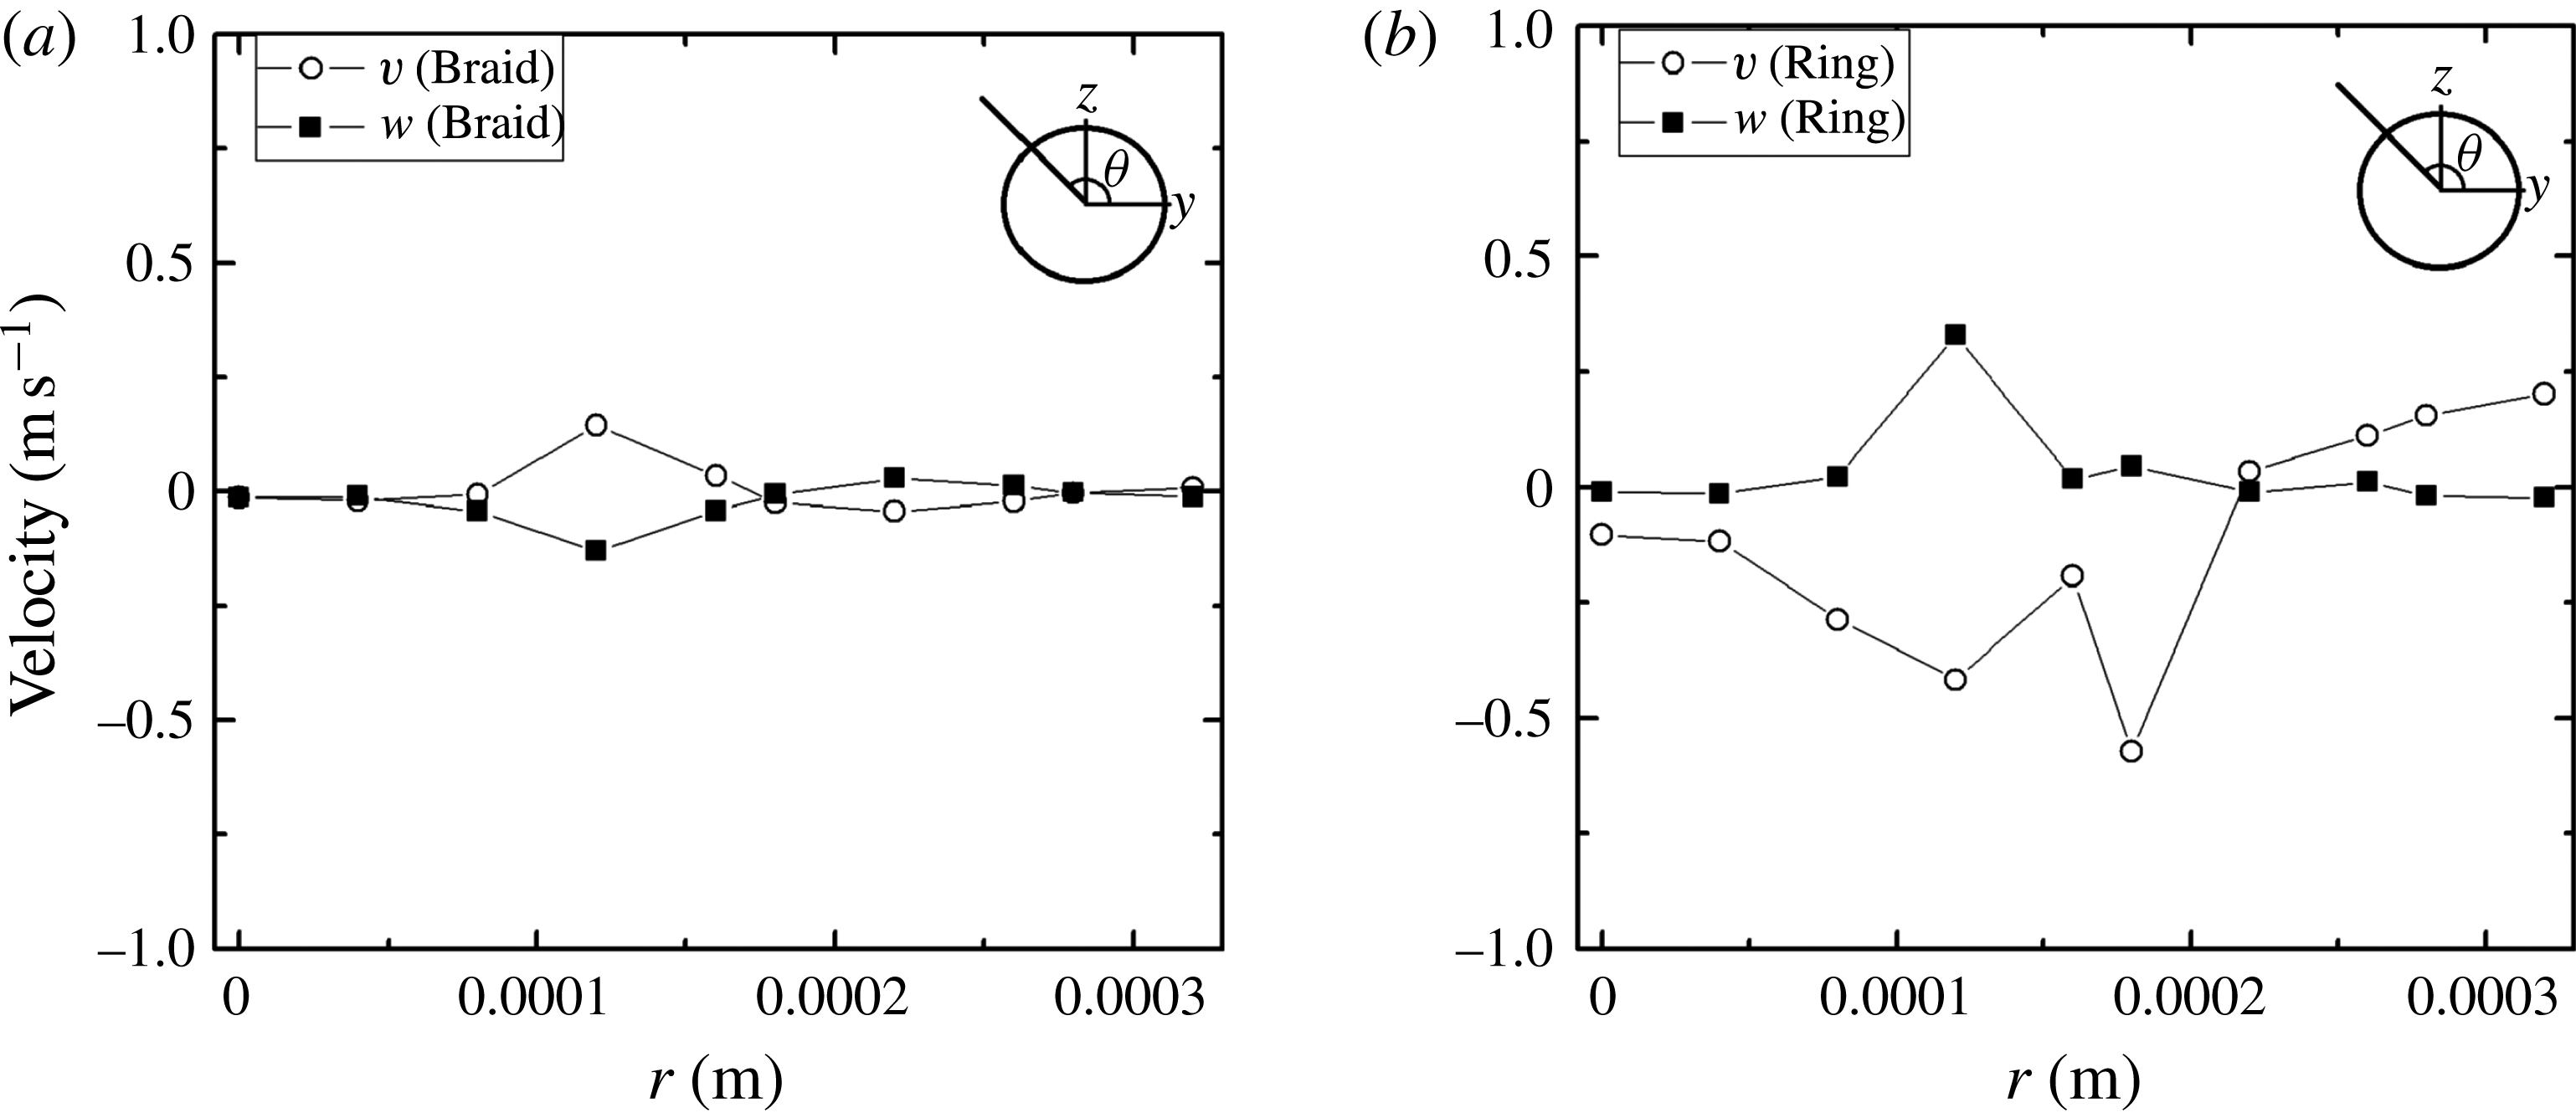
-plane crossing the lobe and the two holes, shown by a dashed line in figure 13(b), are demonstrated in figure 14(a). The dark colour indicates the lobe and the jet core. The graph is at a fixed
 $x$
-position; however, the cone crest moves at a sufficiently slow speed to give a meaningful portrayal of transverse velocity relative to the crest. Thereby, useful descriptions of counter-rotating structures and radially outward flow are given. Streamlines show two pairs of counter-rotating streamwise vortex pairs, i.e. hairpin vortices, adjacent to the lobe near the holes. This figure indicates vortical centres off the interface in the gas, showing that the baroclinic effect is not dominant and surface topology changes are surface tension and inertia dominated. The gas flows into the hole from below the lobe in accordance with the direction of the flow circulation at the edge of the lobe. The holes form because the fluid rotation indicated in the sketch of figure 10 is superimposed upon the stretching and subsequent thinning of the sheet in the lobe. The 3-D vorticity development is shown to lead in time the 3-D interface dynamics. The vortex line deformations, i.e. formations of two series of hairpin vortices with
 $180^{\circ }$
phase difference, occurred much earlier than the formation of holes. Thus hole formation follows rather than leads the vortex line deformation near the interface. This figure also illustrates that hairpin vortices overlap without merging. The radial outward flow by the lobes is consistent with the results of JS. They also showed a simultaneous radially inward flow in the braid position. Figure 14(b) shows the
 $y$
and
 $z$
components of velocity versus radius at two locations: through the hole shown in (a) and through the lobe exactly midway from the two holes shown in (a). The velocity profile through the hole oscillates close to the interface, i.e.
 $r=0.0001~\text{m}$
, where the hairpin vortices form close to the hole. In addition, the components of velocity change sign, indicating the circulation close to the hole. However, away form the hole, less oscillation occurs and both components of the velocity have the same sign. Obviously, away from the interface at larger
 $r$
values the velocity matches for both cases.
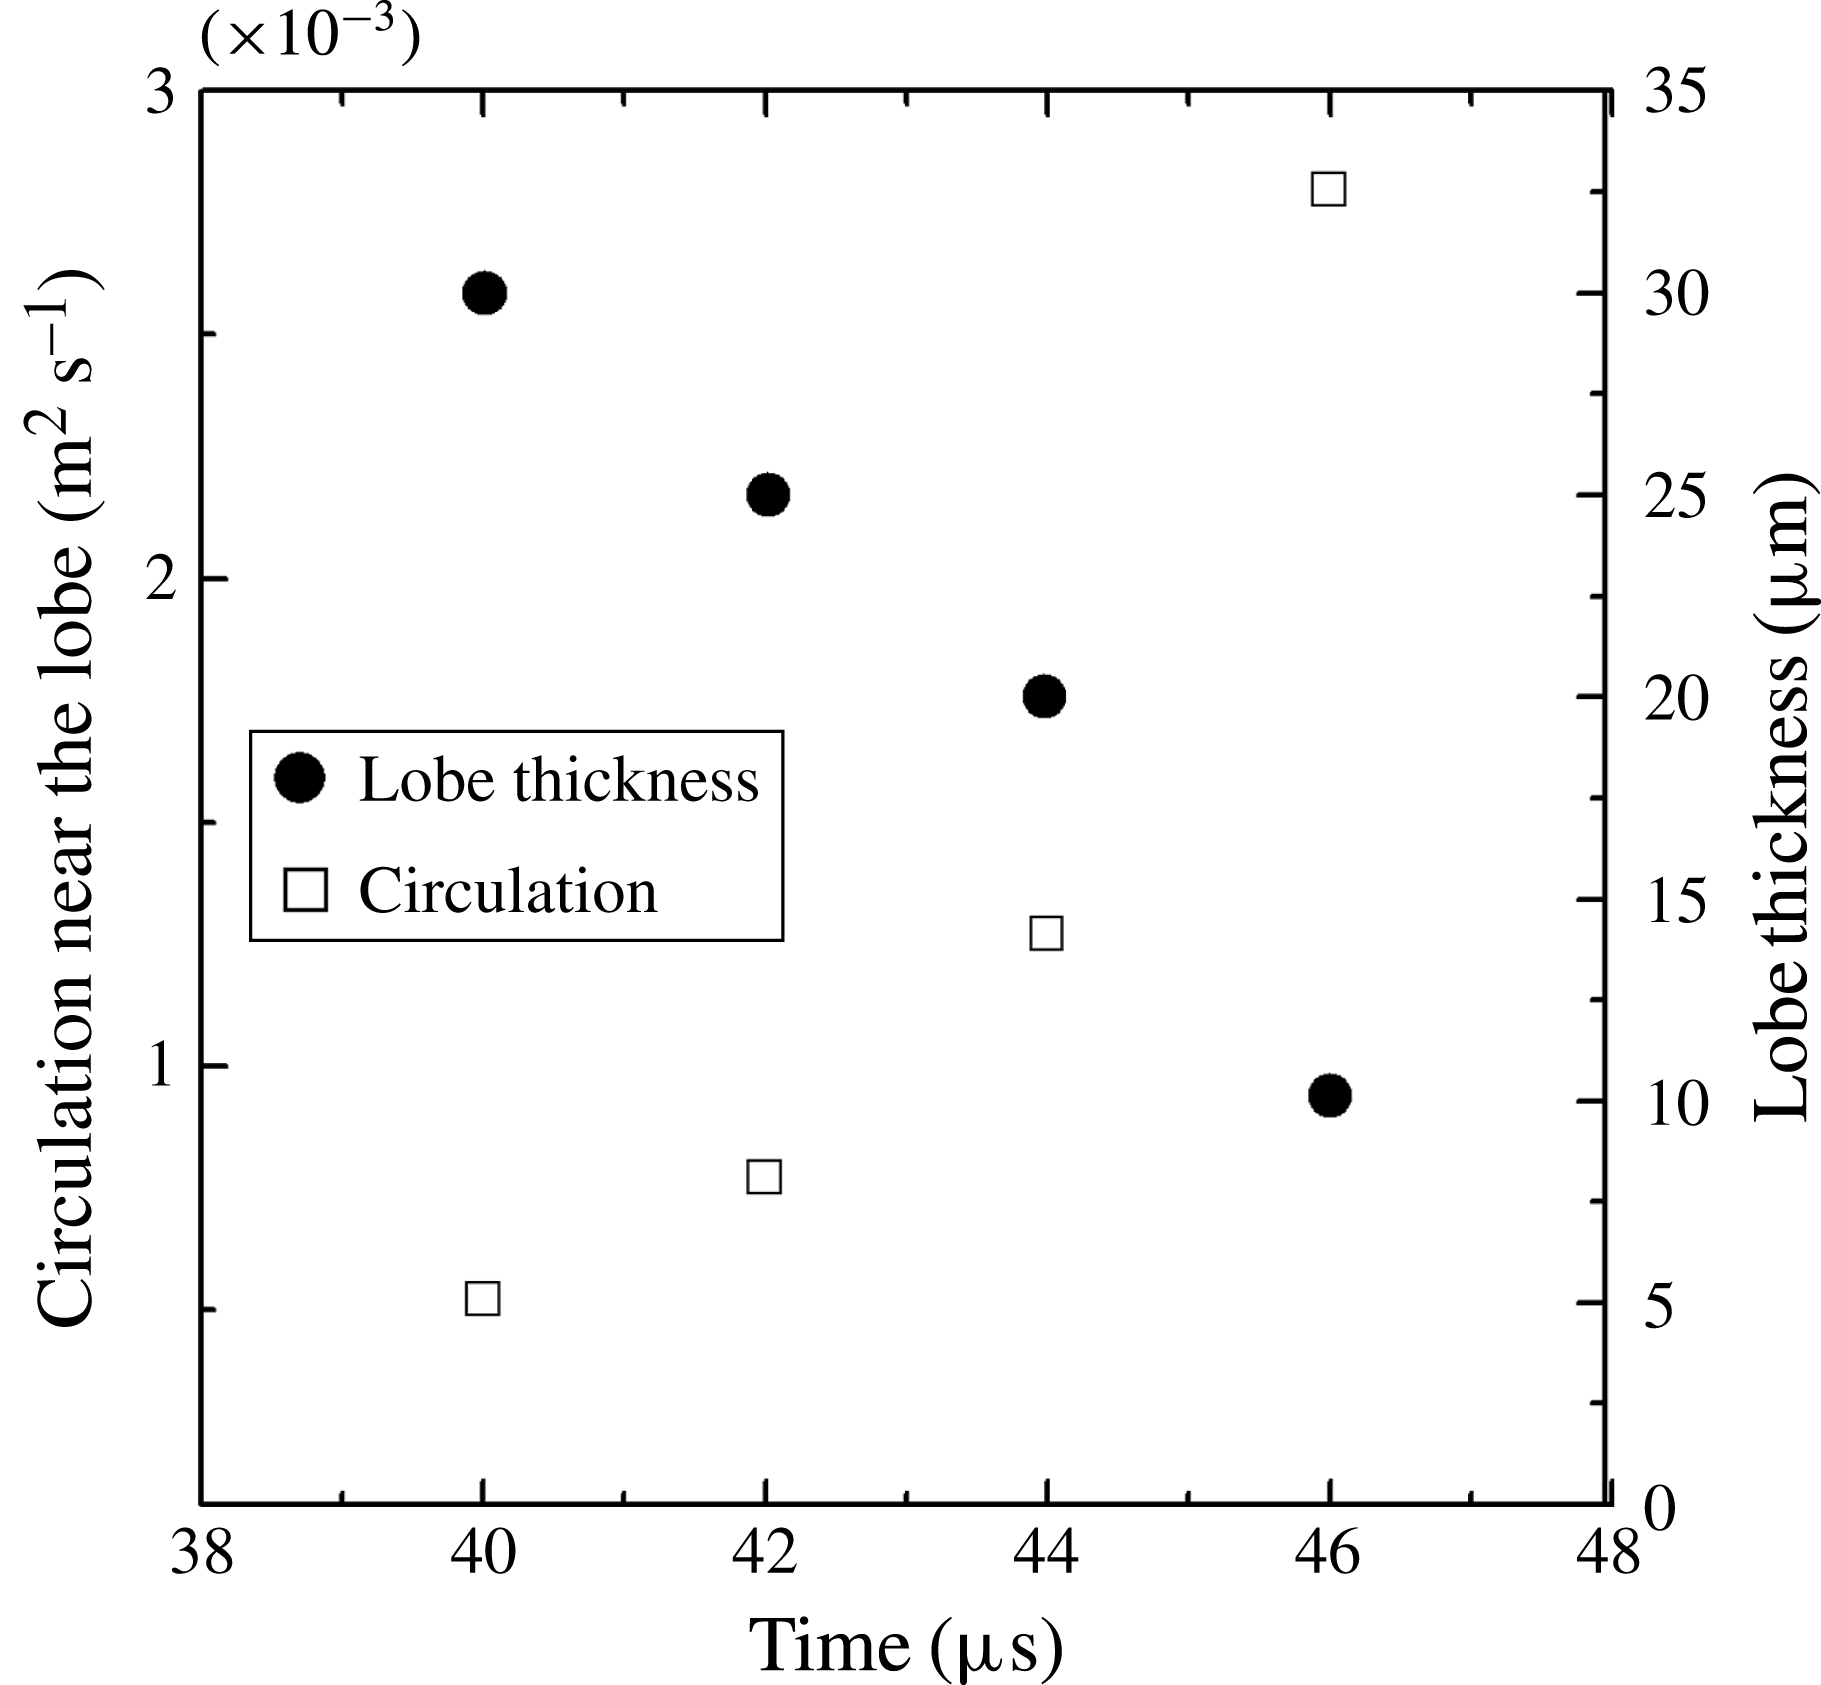
Circulation on a small square box of width
 $0.2D$
near the lobe and the lobe thickness with time for gas-to-liquid density ratio equal to 0.1,
 $Re=1600$
,
 $We=230\,000$
.

In figure 15, the circulation in the transverse
 $yz$
plane around a small square box of width
 $0.2D$
close to the hole location shown in figure 14(a) is plotted versus time from 40 to 46
 ${\rm\mu}$
s. On the same figure, the lobe thickness during that time span is also shown. As can be seen in this figure, the circulation increases with time while the lobe thickness decreases; finally, at 46
 ${\rm\mu}$
s the circulation reaches a maximum value and a hole forms, as is shown in figure 13(b). Therefore, the hole formation process relates to the increase in circulation originated from the hairpin vortices that envelope the lobe and make it thinner with time, as was explained qualitatively earlier. Hole formation begins on a lobe sheet where the
 $We$
, based on lobe thickness and relative gas–liquid velocity, is too large for capillary action to be the initiating mechanism. In particular, it is of the order of
 $10^{2}$
. The large
 $We$
implies that the inertial time scale is much shorter than a capillary time scale. Of course, surface tension can be expected to have a role in the final puncture stage but it does not determine the location and size of the hole or the time to puncture.
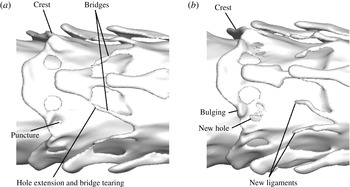
Figure 16 illustrates the extension and merging of the holes observed in figure 13(b) and creation of new holes at a later time. Figure 17(a) compares the changes in two cone crests at a 2-
 ${\rm\mu}\text{s}$
interval. The cone crest on the right side of the picture has developed more than the left crest. The holes have extended towards the rim, forming two liquid bridges which experience capillary tears where the cross-sectional area is a minimum. Figure 17(b) demonstrates two newly created ligaments from the two torn bridges on each lobe. Also, the three other lobes each create two ligaments after tearing. Capillary waves develop in the created ligaments, as can be seen in the figure. The detached ligaments are convected downstream farther from the liquid jet interface by the gas flow until they reach the end of the computational domain, i.e. 1 mm. Not all the detached ligaments are visible in this figure showing a zoomed view of the jet to reflect the new topology features. In figure 18(a), small remnants of the detached liquid ligaments from figure 17(b) are indicated with circles. Calculations presented in JS showed that the mass loss due to the numerical method was below 2 % for the same conditions – hence not excessive.
Figures 16 and 17 show that the extension of the lobe centre in the downstream direction, with its resulting azimuthal curvature of the crest, separates the holes in neighbouring lobes. Consequently, those holes from neighbouring lobes do not merge here; however, mergers occur at higher densities as explained in § 5.4.
(a) Isosurface of liquid–gas interface indicating the formation of additional holes at
 $t=48~{\rm\mu}$
s; (b) extension of the holes at
 $t=50~{\rm\mu}$
s: gas-to-liquid density ratio is 0.1,
 $Re=1600$
,
 $We=230\,000$
. (Gas flows from right to left.)

(a) Isosurface of liquid–gas interface indicating small bridges at the rim of the lobe at
 $t=52~{\rm\mu}$
s; (b) ligaments form after bridge detachment at
 $t=54~{\rm\mu}$
s: gas-to-liquid density ratio is 0.1,
 $Re=1600$
,
 $We=230\,000$
. (Gas flows from right to left.)

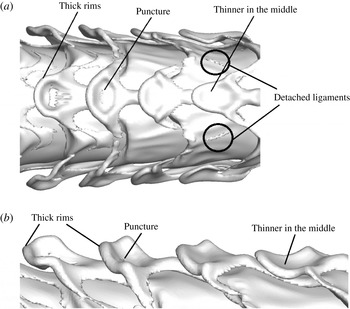
(a) Top view of the liquid–gas interface; showing three of the total four lobes around the circular jet and the extension of the lobes in the flow direction, curving of the lobe, thinning in the middle, thickening of the rims and tearing of the lobe from the middle. (b) Side view.
 $t=60~{\rm\mu}$
s, gas-to-liquid density ratio is 0.1,
 $Re=1600$
,
 $We=230\,000$
. (Gas flows from right to left.)

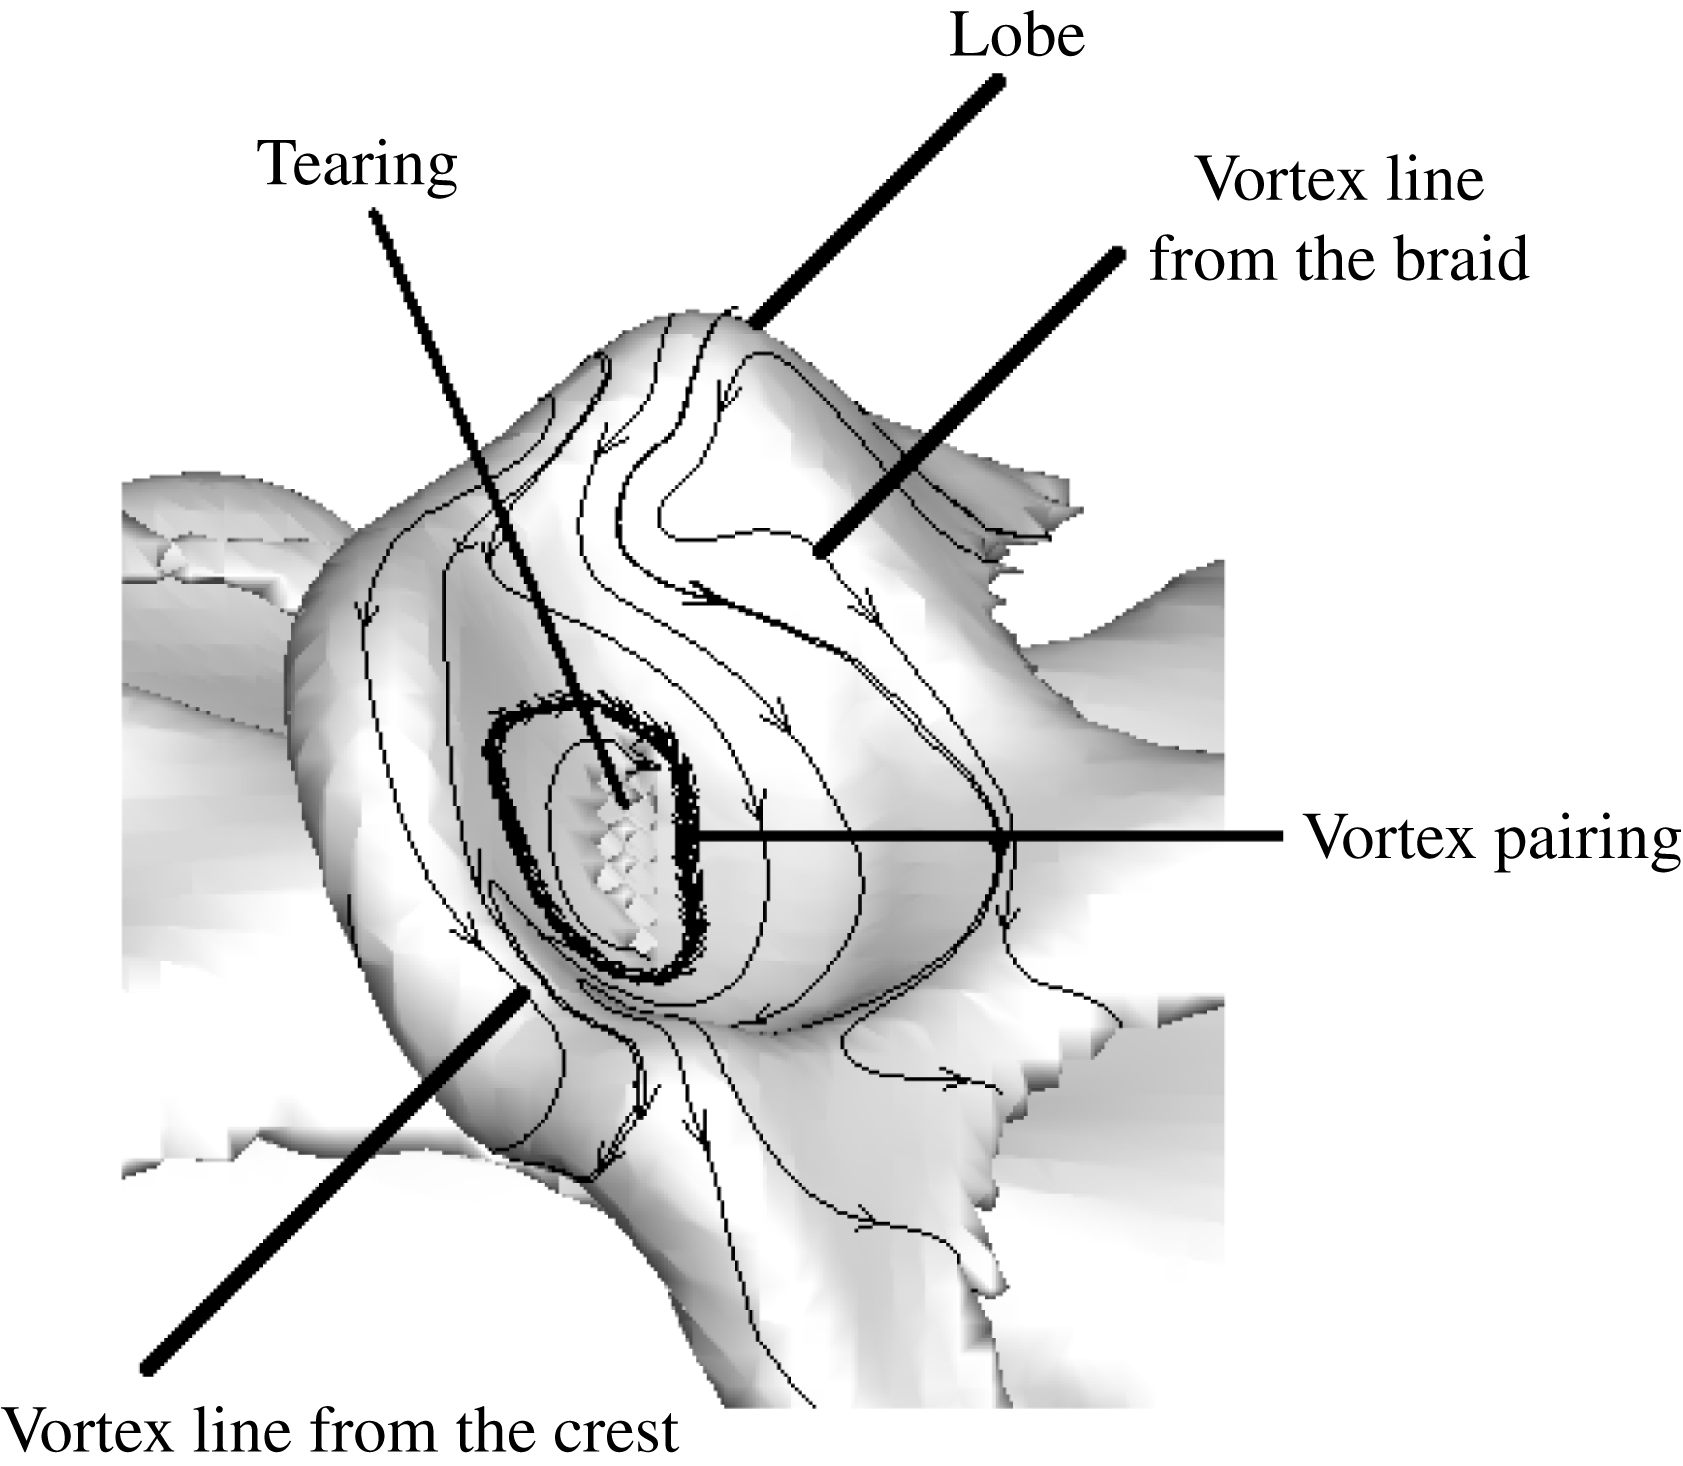
Magnified lobe with projected vortex lines, showing two families of hairpin vortices from the braid and crest and their pairing at the centre of the lobe that leads to the lobe puncture and tearing: gas-to-liquid density ratio is 0.1 at
 $t=60~{\rm\mu}$
s,
 $Re=1600$
,
 $We=230\,000$
. (Gas flows from right to left.)

The surface area of the remaining part of the lobe tip increases after tearing and formation of the ligaments; a crater forms on the centre of its surface as figure 18 indicates. The central portion of the lobe takes a ‘spoon’ shape after the two off centre holes have opened. The crater is punctured where the sheet thickness at the crater decreases and the rims become thicker, as shown by figure 18(b). The location of the hole is predictable using the vortex lines projected at the liquid interface at the lobe tip as shown in figure 19. In the fashion of the figure 4 sketch, hairpin vortices from the braid overlap with the hairpin vortices at the crest, each with the same direction for azimuthal vorticity components but opposing streamwise components. As discussed earlier, where two hairpin vortices with same-sign circulation overlap, the liquid sheet becomes thinner because mutual rotation of the vortex lines moves those vortex (material) lines closer to the same radial position and a hole can form. In summary, the vortex lattice structure (of the type proposed for planar mixing layers in figure 5) portrayed through the projected vorticity structures in figures 12, 13 and 19 identifies the hole locations on the cone crests of the jet.
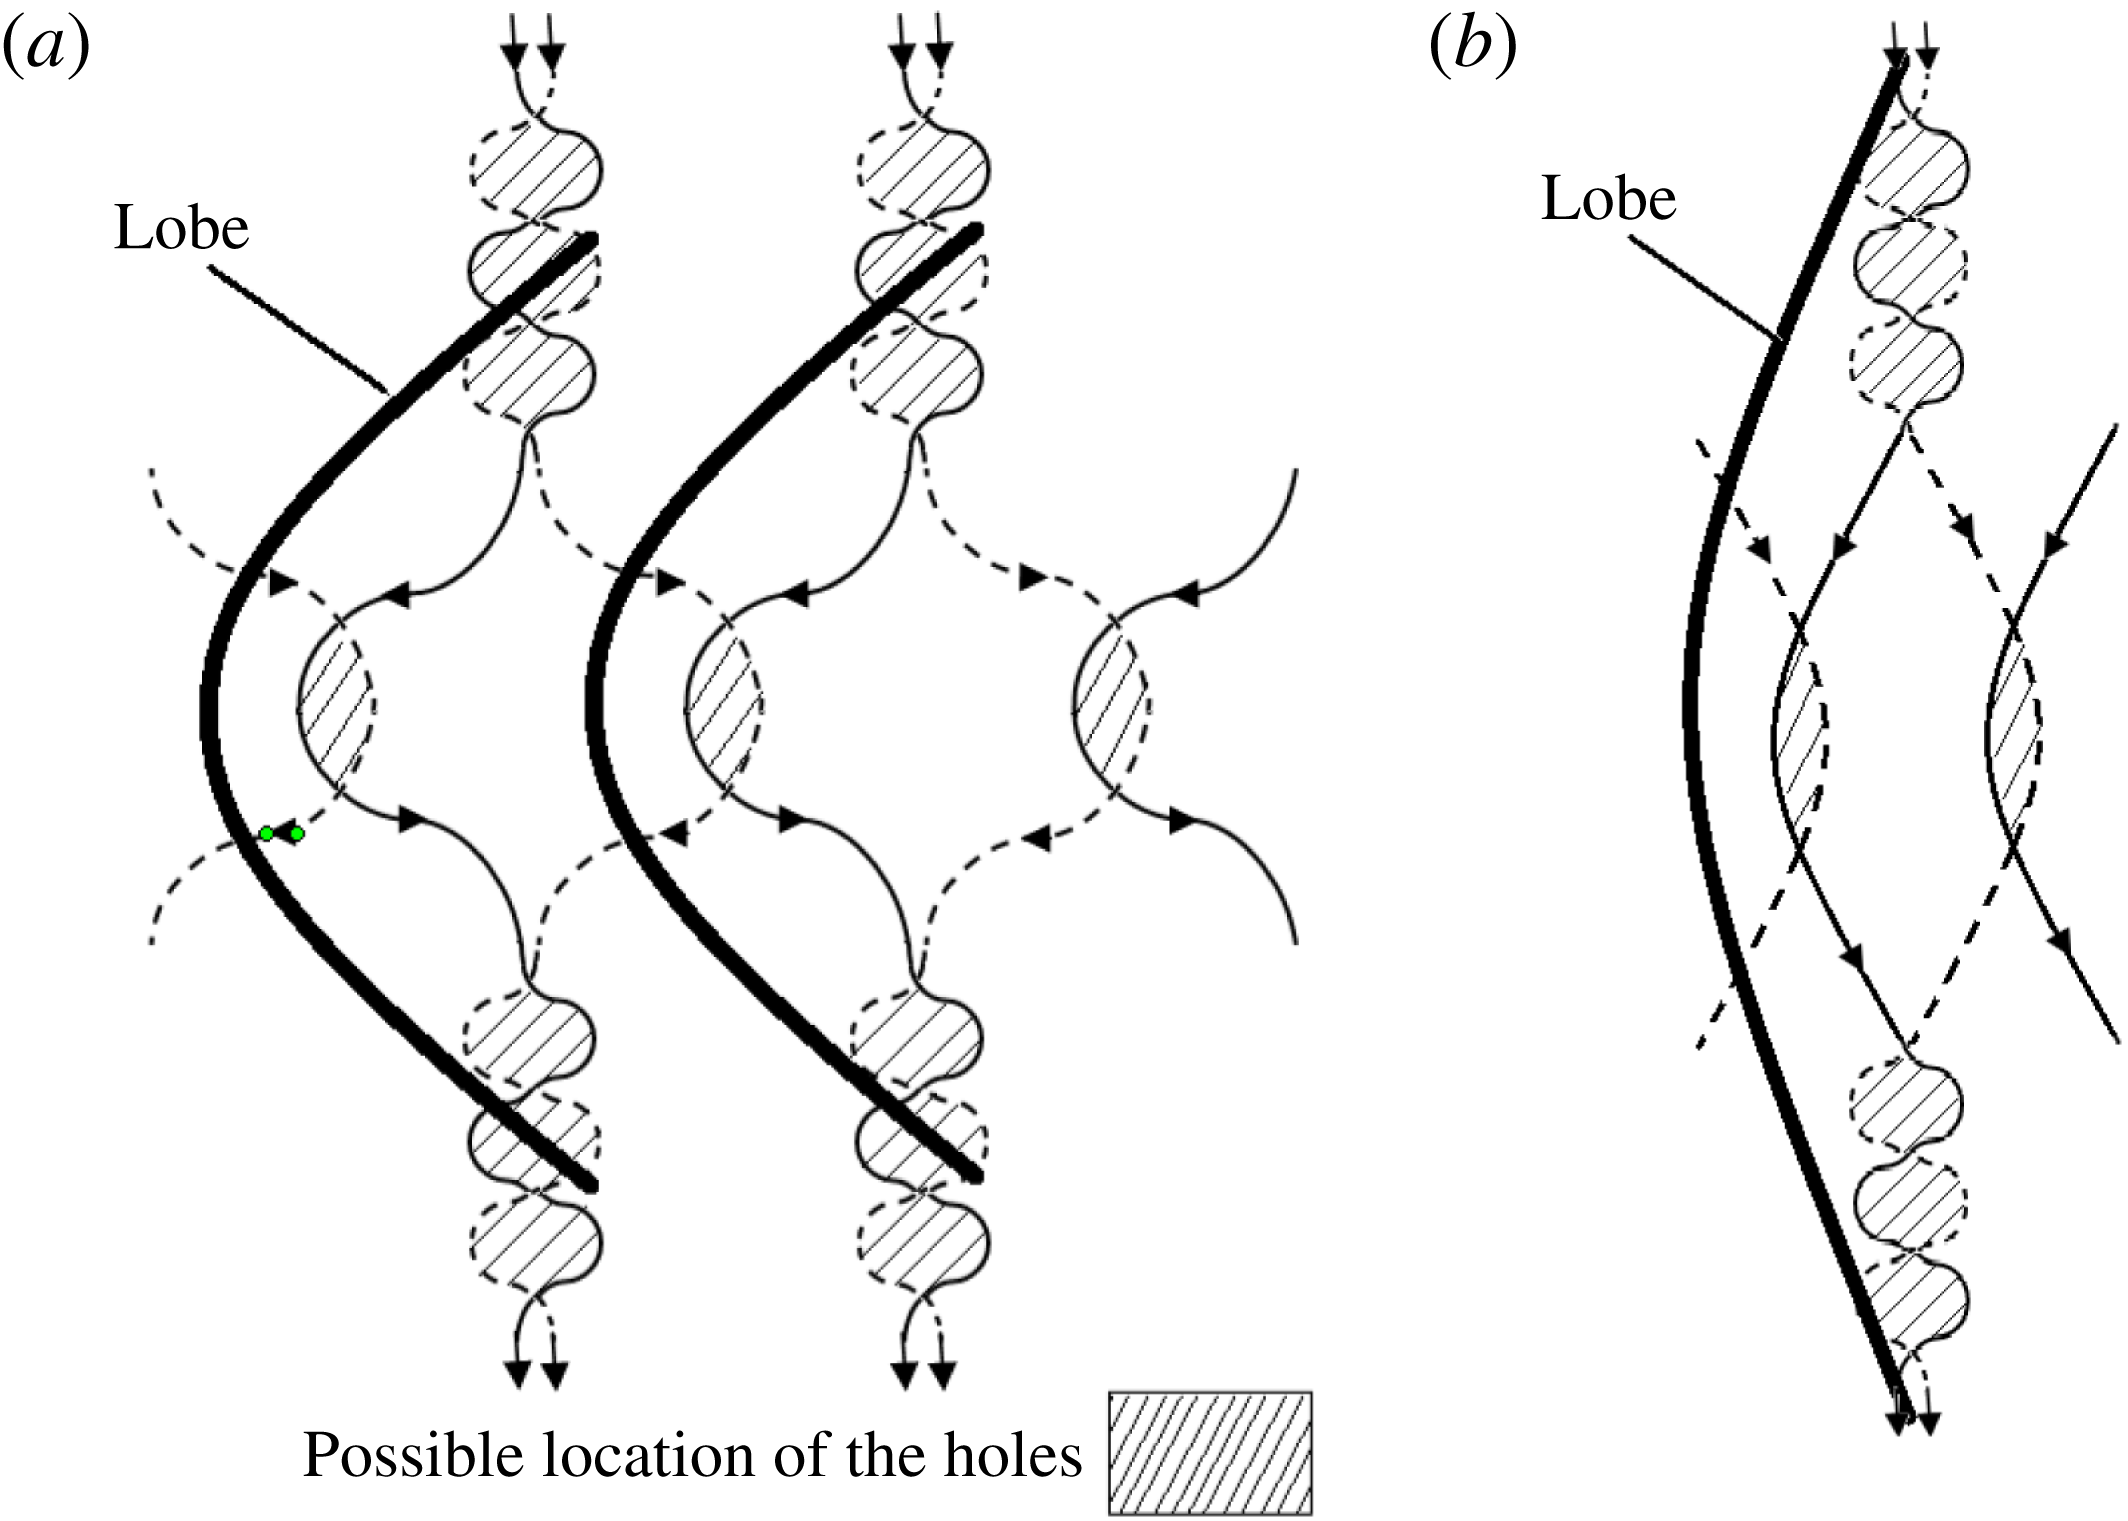
Schematic view of the vortex lattice showing pairing of the vortices and possible locations of the holes in lobes. (Gas flows from right to left.) (a) Lower gas density for the same flow condition of figure 19; (b) higher gas density.

Figure 20 schematically shows the vorticity structure, including the overlapping regions of hairpin vortices between the lobes. The liquid sheet becomes thinner at the overlapping hairpin region, as explained in previous discussion related to figure 10, and the holes form there as indicated by the hatched areas. Comparisons of figures 12 through 19 demonstrate a correlation between vortex location and hole formation. Although the hole location can be predicted by hairpin overlap, other flow parameters, e.g. density ratio, viscosity ratio and surface tension, play a role in changing the flow regime and the hole formation process, as will be discussed in the following subsections. For example, when the surface area of the lobe increases and its edge curvature decreases, the locations of the holes in neighbouring lobes will be closer to each other, as shown in figure 20(b). This happens when the gas density ratio increases and the liquid deformation is delayed. Therefore, instead of three distinct holes in a lobe, i.e. two close to the sides and one near the tip of the lobe, holes merge and create one or two large holes on the lobe.
The hole formation and ligament creation from the extension of the holes and tearing of the rim were observed in the computations of Shinjo & Umemura (Reference Shinjo and Umemura2010) for
 $Re$
and
 $We$
numbers of the same order of magnitudes as our results. However, they stated that the lobe punctured due to the impact of the droplets that formed earlier from the break up of the mushroom-shaped cap with the jet core. Our results show that the lobes developed holes before the formation of the droplets since the mushroom-shaped cap is not considered in the liquid-segment model. Although the disintegration of the mushroom-shaped cap might have an effect on the early jet core instability, the hole formation process occurs irrespective of the droplet collision with the jet; the cap is only a transitional structure appearing during jet start. For many practical pulsed injectors, the cap is many wavelengths downstream for most of the pulse duration. After the start-up transient, the constant-mass-flow liquid jet breaks into a spray at a distance of approximately 80–150 nozzle diameters (12.5 to 30 mm). Our axisymmetric simulations showed that the penetration length of the jet was 4.1 mm (20 orifice diameters) at 100
 ${\rm\mu}$
s, where the mushroom-shaped cap was significantly deformed and KH waves developed on the jet core without interaction with the cap.
5.2 Effects of liquid viscosity and
 $Re$

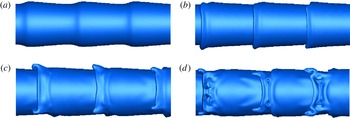
Figure 21 shows the development of the lobes and holes for gas-to-liquid density ratio equal to 0.1 for
 $Re=5000$
and
 $We=230\,000$
. Decrease of the liquid viscosity with density and velocity kept the same as for figures 8, 12 and 13, causes the number of lobes to increase from four to five, consistent with the experiments of water injected into water by Liepmann & Gharib (Reference Liepmann and Gharib1992) as discussed previously (JS). In general, by lowering the liquid viscosity, smaller scales are allowed and the mode number of azimuthal Widnall instability, which develops into hairpin vortices later, increases. Now, with the higher
 $Re$
calculations, qualitative differences do not appear. The same mechanisms of lobe formation, lobe surface extension and hole formation in the lobes are repeated for this higher-
 $Re$
case. With the same gas-to-liquid density, the only major difference is the formation of the five lobes instead of four.
Isosurface of liquid–gas interface indicating the formation of five lobes and later development of the holes for gas-to-liquid density ratio 0.1;
 $Re=5000$
and
 $t=36~{\rm\mu}\text{s}$
(a),
 $38~{\rm\mu}\text{s}$
(b),
 $40~{\rm\mu}\text{s}$
(c),
 $42~{\rm\mu}\text{s}$
(d). (Gas flows from right to left.)

Surface deformation showing cone and ligament formation: gas-to-liquid density ratio is 0.05,
 $Re=320$
,
 $We=230\,000$
. (Gas flows from right to left.) (a)
 $t=90~{\rm\mu}\text{s}$
, (b)
 $t=92~{\rm\mu}\text{s}$
, (c)
 $t=94~{\rm\mu}\text{s}$
.

Formation of a hole at the base of the ligaments: gas-to-liquid density ratio is 0.05,
 $Re=320$
,
 $We=230\,000$
. (Gas flows from right to left.) (a)
 $t=98~{\rm\mu}\text{s}$
, (b)
 $t=100~{\rm\mu}\text{s}$
, (c)
 $t=102~{\rm\mu}\text{s}$
, (d)
 $t=104~{\rm\mu}\text{s}$
.

With an increase of the liquid viscosity, the rims of the primary KH cone crests become thicker and small-scale azimuthal corrugations form on the crest as figure 22(a) illustrates for gas-to-liquid density ratio equal to 0.05. Due to thicker rims, i.e. 55
 ${\rm\mu}$
m compared to 30
 ${\rm\mu}$
m thickness of the rim for
 $Re=1600$
with the same gas-to-liquid density ratio, hole formation is delayed and ligaments form from the extension of these corrugations on the rims and elongate later in time as shown in figure 22(b,c). This agrees with the low-pressure (Marmottant & Villermaux Reference Marmottant and Villermaux2004) experiment. Since ligaments formed by this mechanism are thicker, they are expected to yield larger droplets upon break up. For the same case at later times, figure 23 demonstrates the elongation of the ligaments, development of capillary waves and formation of the holes at the base of the ligaments, i.e. where the ligament is attached to the wave crest. By decreasing
 $Re$
, ligaments become longer before they break into droplets. This is consistent with the experimental investigations of Marmottant & Villermaux (Reference Marmottant and Villermaux2004) for lower gas-to-liquid density ratios.
Comparing the streamwise pressure gradient magnitude induced in the ligament by the external gas flow, i.e.
 $O(10^{7})~\text{kg}~\text{m}^{-2}~\text{s}^{-2}$
against the local transverse gradient magnitude for viscous shear stress based on the gas viscosity, i.e.
 $O(10^{5}{-}10^{6})$
 $\text{kg}~\text{m}^{-2}~\text{s}^{-2}$
, reveals that the pressure gradient dominates in determining the acceleration associated with the ligament stretch. Of course, we expect surface tension to resist the elongation.
Projected vortex lines at the interface showing the overlapping region and formation of hairpin vortices after ligaments form: gas-to-liquid density ratio is 0.05,
 $Re=320$
,
 $We=230\,000$
: (a)
 $t=90~{\rm\mu}$
s; (b)
 $t=94~{\rm\mu}$
s. (Gas flows from right to left.)

Figure 23 also shows the extension of the hole with time and tearing of the rim and formation of small-diameter ligaments after the break up of the rim. Therefore, the mechanism that leads to formation of the hole and then its tearing to form new ligaments in this lower-
 $Re$
case is qualitatively similar to the findings for higher
 $Re$
. However, the major difference is that the more viscous liquid sheet will thin more slowly and require more time to reach the small thickness and to puncture. This happens after the formation of the extended ligaments for high liquid viscosity.
Figure 24(a,b) show the projected vortex lines at the interface for figure 22(a) and (c), respectively. Unlike the higher-
 $Re$
cases where four hairpin vortices formed and four lobes were created in accordance with them, for low
 $Re$
, as demonstrated in figure 24(a), a hairpin vortex forms in less orderly fashion. Simultaneously, a ligament grows from the same part of the cone crest. The overlapping vortex region is spread in the braid and cone crests. The magnitudes of the vorticity variations for the lines in this figure indicate that the numerical noise threshold is exceeded and thereby a more chaotic behaviour appears at lower-
 $Re$
values. Therefore, although a vortex lattice similar to the structure in the single-phase 3-D planar mixing layer is formed in multiphase jet flow for lower liquid viscosities, it does not occur in such an orderly manner at lower
 $Re$
.
Effects of liquid viscosity on lobe and ligament formation at
 $t=50~{\rm\mu}$
s; gas-to-liquid density ratio is 0.1,
 $We=230\,000$
: (a)
 $Re=320$
; (b)
 $Re=1600$
. (Gas flows from right to left.)

Effects of liquid viscosity on lobe and ligament formation; gas-to-liquid density ratio is 0.5 at
 $t=50~{\rm\mu}$
s,
 $We=230\,000$
: (a)
 $Re=320$
; (b)
 $Re=1600$
. (Gas flows from right to left.)

Figures 25 and 26 show the effects of density ratio and liquid viscosity on formation of the ligaments and holes for gas-to-liquid density ratios equal to 0.1 and 0.5, respectively. By increasing the gas density compared to that of figure 22 with the same
 $Re=320$
in figure 25(a), ligaments form from both elongation of the corrugations on the cone crests and from the tearing of the rims after hole formation. In general, the liquid protrusions for
 $Re=320$
have larger scales compared to those of figure 25(b) for
 $Re=1600$
and break into larger droplets. Ligaments observed in figure 25(b) have smaller diameters and they break at shorter lengths. By increasing the gas density to half of the liquid density, as shown in figure 26, the hole and ligament formation is not significantly affected by the liquid viscosity compared to flows at lower gas-to-liquid density ratio, i.e. figure 22. For both low and high
 $Re$
at higher density ratio, holes form and create a bridge after merging; then, the bridge breaks to produce the ligaments and a droplet. A difference is seen between figure 26(a,b) for the rim of the lobe, which is less curved and thicker for low
 $Re$
, as expected, and larger droplets will break from the bridge.
 $Re$
based on gas density and viscosity might be more important than our liquid-based
 $Re$
in determining the bifurcation in ligament formation. While viscosity was not important in determining the momentum balance for the ligament, it does affect the velocity field near the interface and the ligament. In conclusion, the mechanism that was observed by Marmottant & Villermaux (Reference Marmottant and Villermaux2004) dominates at low gas-to-liquid density ratio (i.e. lower pressure gas) and lower
 $Re$
and matches qualitatively with the conditions of figure 22. Other effects of density ratio will be discussed in § 5.4.
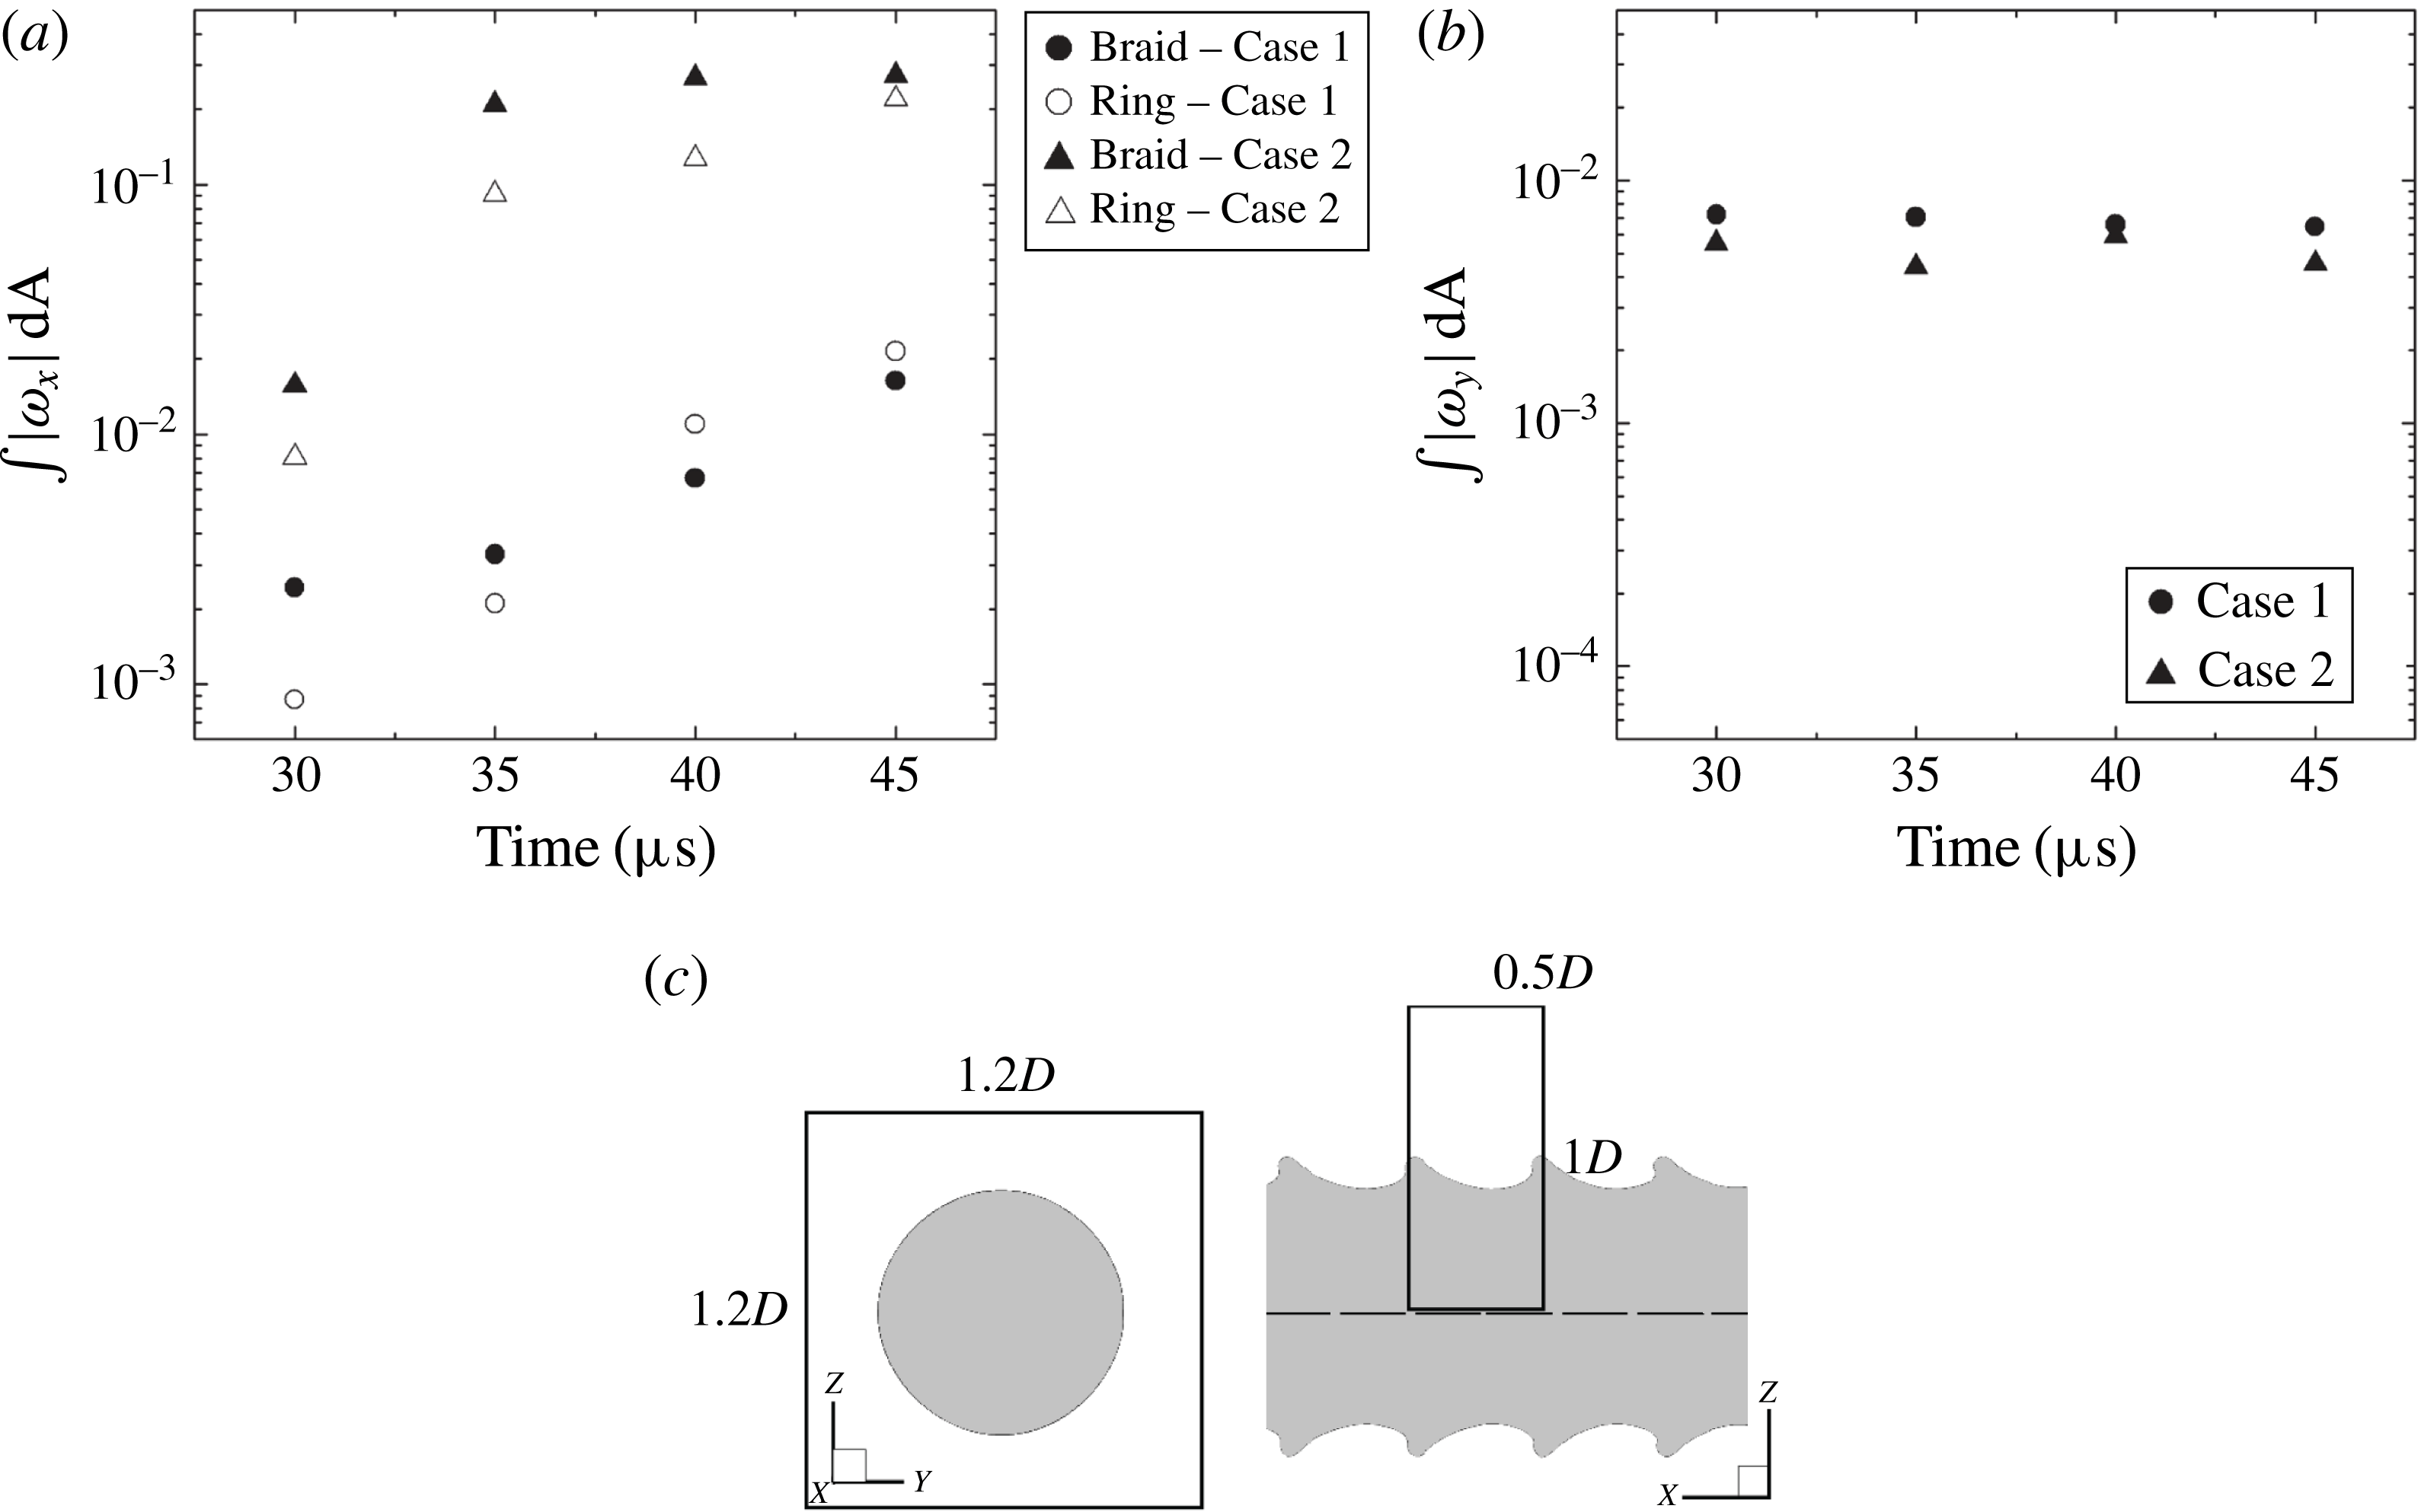
Figure 27(a) gives the integral of the absolute value of the streamwise component of vorticity versus time on the transverse
 $yz$
plane over a square of width
 $1.2D$
surrounding the liquid jet, illustrated in (c). Two different axial locations namely, the ring region (i.e. cone crests) and braid region (i.e. the troughs) of the initial KH waves have been studied;
 $Re=1600$
and 320 for Cases 1 and 2, respectively. However, they both have the gas-to-liquid density ratio and
 $We$
equal to 0.1 and 230 000, respectively. For both cases, the integral of the streamwise vorticity, in the braid region is larger primarily since the 3-D vortex instability, i.e. streamwise vorticity, originates in the braid region while the interface is still nearly axisymmetric. The two cases do not behave similarly at later times. The integral of the streamwise vorticity in the ring region surpasses that in the braid for Case 1; however, for Case 2, the integral of the streamwise vorticity remains larger in the braid region. This can be explained by the interface deformations in these two cases. As mentioned earlier, the interface deforms in a more orderly manner for larger
 $Re$
, i.e. four equidistant lobes form at certain azimuthal locations following the vortex lattice pattern, then puncture and produce the holes and ligaments. So the streamwise vortices become magnified adjacent to the lobes where hairpin vortices have developed. However, for Case 2, the 3-D interface deformation on the cone crests originates with formation of small-scale corrugations, in contrast to the well-formed lobes of Case 1, as shown in figure 24. Finally, the discrepancies between the integral of the streamwise vorticity magnitude over the surface for both ring and braid regions decrease for both cases when surface deformation intensifies in both regions. Figure 27(a) shows that the integral of the streamwise vorticity over the transverse area increases drastically from 30 to 35
 ${\rm\mu}$
s for Case 2 and remains larger in the magnitude compared to that of Case 1. This is due to the fact that for higher liquid viscosity, initially larger streamwise vorticity is required to initiate the 3-D deformation. Once initiated, the streamwise vorticity grows gradually with time. The integral of the streamwise vorticity vector component over the
 $yz$
plane must be zero since the hairpin vortices create streamwise vorticity normal to that plane in both directions. The integral of the axial vorticity over the
 $yz$
plane is very small (
 $O(10^{-6}~\text{s}^{-1})$
), of the order of the expected numerical integration errors; thus, these calculations show that this zero-value requirement has been satisfied.
(a) Integral of the streamwise vorticity absolute magnitude on the
 $yz$
plane versus time for both the ring and braid regions for gas-to-liquid density ratio
 $=$
0.1, (b) circulation at a fixed axial location with time: Case 1:
 $Re=1600$
and
 $We=230\,000$
and Case 2:
 $Re=320$
and
 $We=230\,000$
; (c) schematic of the integrated areas with respect to the interface for (a,b).

Figure 27(b) shows the circulation in the
 $xz$
plane, i.e. the integral of the azimuthal vorticity versus time for Cases 1 and 2. The integration has been performed over a rectangle in the
 $xz$
plane that extends a wavelength in the
 $x$
-direction centred at the same axial location over time; it extends from the axis to
 $1D$
in the
 $z$
-direction, as shown in (c). In contrast to the streamwise vorticity, the circulation slightly decreases with time and does not differ drastically for Cases 1 and 2. Comparing figure 27(a,b) indicates that the azimuthal vortices lose their energy faster than the streamwise vortices; therefore, streamwise vortex structures quickly dominate the flow field. This is consistent with the findings of Liepmann & Gharib (Reference Liepmann and Gharib1992) for a homogenous jet. The calculation showed periodicity over adjacent rectangles of the same size in the
 $x$
-direction (less than 0.2 % error).
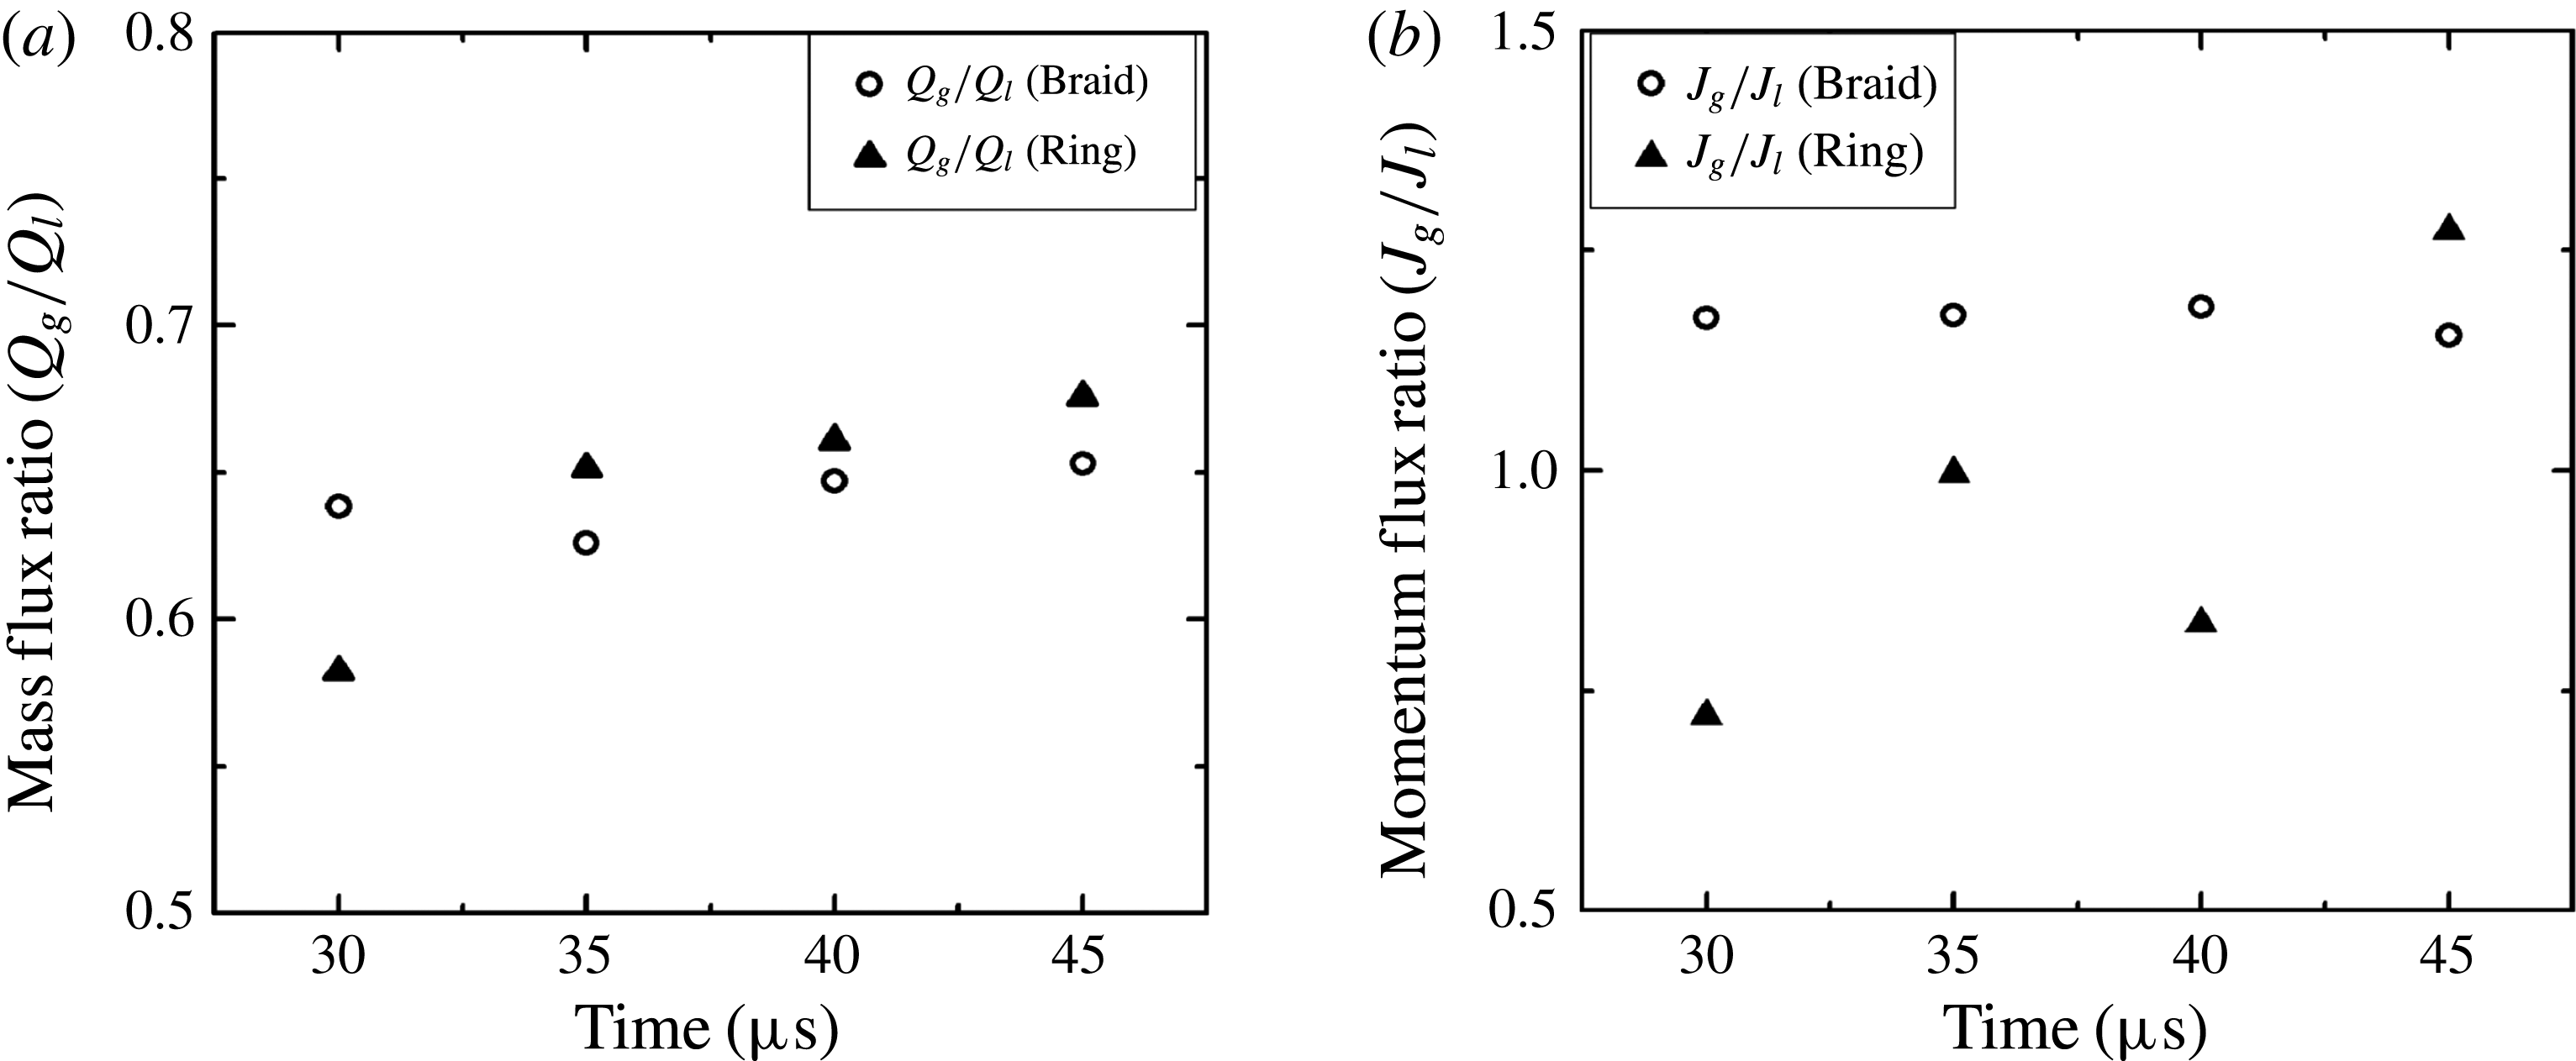
Figure 28 demonstrates the gas-to-liquid mass flux ratio,
 $Q_{g}/Q_{l}$
, where
 $Q_{i}=\iint _{A}{\it\rho}_{i}u\,\text{d}y\,\text{d}z$
and momentum flux ratio,
 $J_{g}/J_{l}$
where
 $J_{i}=\iint _{A}{\it\rho}_{i}u^{2}\,\text{d}y\,\text{d}z$
and
 $i=g,l$
indicate the gas and liquid, respectively, and
 $u$
is the streamwise velocity. The area integral has been calculated on a square box of width
 $2D$
for Case 1 and the same time span of figure 27 for both the braid and ring regions.
(a) Gas-to-liquid mass flux ratio; (b) gas-to-liquid momentum flux ratio in the braid and ring regions versus time for Case 1: gas-to-liquid density ratio
 $=$
0.1,
 $Re=1600$
, and
 $We=230\,000$
.

Transverse velocity profiles versus radial direction at the same azimuthal angle (
 ${\it\theta}=135^{\circ }$
) at 30
 ${\rm\mu}$
s for Case 1 in the: (a) braid, (b) ring; gas-to-liquid density ratio
 $=$
0.1,
 $Re=1600$
, and
 $We=230\,000$
.

Calculations show that the mass flux of the liquid remains constant for both the ring and the braid region as it must. However, as figure 28(a) shows, the mass flux of the gas increases with time for the braid and ring regions and remains higher in the ring region, i.e. downstream of the braid, except at
 $t=30~{\rm\mu}$
s. This can be explained by examining the profiles of the transverse components of velocity, i.e.
 $v$
and
 $w$
versus radius, at a constant azimuthal angle (
 ${\it\theta}=135^{\circ }$
) illustrated in figure 29 for 30
 ${\rm\mu}$
s for Case 1 in both the braid and ring regions. As is shown, from the jet centre to the vicinity of the interface, i.e.
 $0<r<0.00018~\text{m}$
, the transverse velocity components have opposite signs – flow is inward in the braid region and outward in the ring region. However, they follow the same sign at a distance from the interface (
 $r>0.00018~\text{m}$
) where the flow is outward. At early times, the interface is still nearly axisymmetric; the streamwise vorticity is weak and the lobes have not been formed. Therefore, more gas is entrained in the braid following the inward direction of the flow. At later times, lobes form on the cone crests due to the amplification of the streamwise vorticity and attenuation of the azimuthal instability, as was shown in figure 27; thus, the gas entrainment increases with time in both the ring and braid region. It increases sharply for the ring region since the gas is trapped between the lobes and the jet core. Additional calculations not presented here show that periodic conditions in the streamwise direction kept
 $\text{d}Q/\text{d}x$
close to zero and zero when averaged over the segment length. The gas-to-liquid momentum flux ratio remains approximately constant with time in the braid region as shown in figure 28(b); however, it fluctuates in the ring region due to the complex unsteady interface structures with varying density. The curling in the crest region with the different densities for the two fluids creates a more variable flux in time.
5.3 Effect of surface tension and
$We$

In figure 30, the effects of increasing surface tension (decreasing
 $We$
) by one and two orders of magnitude while maintaining
 $Re=1600$
is shown. At the
 $We=2000$
,
 $Oh$
has a value comparable to kerosene at standard conditions with the 200
 ${\rm\mu}$
m diameter. The previous trend of developing four well-ordered lobes is not followed. Rather, smaller lobes form around the cone crest in a random manner. For the duration of the calculations, the ligaments do not get very long and do not tear to produce the droplets. Calculations at lower density ratio, i.e. 0.05 and 0.02, with the same
 $Re$
and
 $We$
, behaved similarly, with no early signs of lobe tearing. Calculations at longer durations were inhibited by numerical difficulties. In a general qualitative sense, increase of surface tension at lower density ratio has a similar effect to increasing liquid viscosity. However, it will be shown that velocity will be a factor in bifurcation of behaviour; it is not simply dependent on liquid properties and length scale through a factor such as
 $Oh$
.
Effects of surface tension on lobe and ligament formation with 0.05 density ratio. (a)
 $Re=1600$
;
 $We=2000$
at
 $t=22~{\rm\mu}$
s, (b)
 $Re=1600$
;
 $We=20\,000$
at
 $t=60~{\rm\mu}$
s. (Gas flows from right to left.)

Figure 31 shows a case where
 $Re$
and
 $We$
are increased compared to the prior case, with
 $Oh$
remaining roughly the same and the same density-ratio value. The 100
 ${\rm\mu}$
m wavelength led to decay here, so a 333
 ${\rm\mu}$
m wavelength with a larger initial amplitude was used. An orderly formation with four lobes occurs; however, this has fewer lobes than the five appearing for the higher-
 $Oh$
case with a lower
 $Re=5000$
and a higher
 $We=230\,000$
. So, within the high-
 $Re$
range, while a decrease in liquid viscosity can lead to more lobes, the increase of surface tension can reduce the number of lobes. Ligaments formed from the extension of the lobes. Holes formed close to the root of the ligaments.
Lobe development, density ratio is 0.05,
 $Re=8000$
,
 $We=57\,500$
. (Gas flows from right to left.) (a)
 $t=20~{\rm\mu}\text{s}$
, (b)
 $t=60~{\rm\mu}\text{s}$
, (c)
 $t=80~{\rm\mu}\text{s}$
, (d)
 $t=90~{\rm\mu}\text{s}$
.

Figure 32 shows a case where
 $Re$
and
 $We$
are increased further, by one and two orders of magnitude, to 16 000 and 230 000, respectively, compared to the first case in this subsection. Again,
 $Oh$
and the density-ratio values are maintained. The hole formation begins between the lobes near the crest in figure 32(a), as has been seen before in other cases. However, at this larger surface tension, the crest has not formed a thin liquid sheet extending downstream above the liquid core. Thus, as shown by views of the liquid–gas interface from the liquid interior in figure 32(b,c), rather than a perforation through a sheet, we find cavities form, similar to the findings of Desjardins & Pitsch (Reference Desjardins and Pitsch2010) at a similar value of
 $Oh$
. They referred to the cavity as a ‘bubble’ and explained its origin based on the engulfment of gas due to counter-rotating vortices. We agree with that conclusion but note further that the mechanism for cavity (or bubble) formation is essentially the same as for hole (perforation) formation. Furthermore, the cavity formation becomes less likely than the perforation at the higher-
 $Oh$
values expected at higher pressures with approach towards the thermodynamic critical point and subsequent surface tension reduction. Our calculations have not gone sufficiently far in time to show the ‘inversion’ or bursting of the cavity and formation of a ligament as discussed by Desjardins & Pitsch (Reference Desjardins and Pitsch2010). Figure 32(d) shows in the
 $yz$
cross-section the projected streamlines. The shaded region is the liquid domain. Counter-rotation with flow into the cavity is indicated.
(a,b) Cavity development at
 $t=70~{\rm\mu}$
s from different angles, (c) magnified view of the cavities, (d) streamlines projected in the
 $yz$
cross-section: gas-to-liquid density ratio is 0.05,
 $Re=16\,000$
,
 $We=230\,000$
.

5.4 Effects of density ratio
The effects of gas-to-liquid density ratio on hole, bridge and ligament formation are discussed in this section. By increasing the gas density, i.e. higher pressure, the lobe formation is delayed, as was discussed previously (JS). If we define a non-dimensional time based on the gas viscosity and density as
 $t_{gg}={\it\mu}_{g}t/{\it\rho}_{g}D^{2}$
, where
 $t_{gg}$
is the non-dimensional time, it is evident that the dimensional time varies proportional to the gas density assuming that other parameters are constant, i.e.
 $t_{2}/t_{1}\sim {\it\rho}_{g2}/{\it\rho}_{g1}$
. The inviscid portions of the gas flow also respond more slowly because of increased inertia at higher density for our inherently unsteady flow. Nevertheless, although lobe formation does not occur as rapidly at higher gas density, new results show other rates increase with gas density: growth rate for a two-phase mixture volume and rate of early droplet formation. The sizes of early formed droplets also increase with gas density.
Lobe development, hole formation and hole extension: gas-to-liquid density ratio is 0.5,
 $Re=1600$
,
 $We=230\,000$
. (a) Formation at
 $t=40~{\rm\mu}$
s. (b) Schematic of the sequence of bridge formation on the lobe at higher gas-to-liquid density ratios. (c) Sequence of bridge formation and its break up to form an elliptical droplet, and hole extension at
 $t=50$
, 52 and
 $54~{\rm\mu}$
s. (Gas flows from right to left.)

Figure 33(a) shows the development of the lobes at the interface for gas-to-liquid density ratio equal to 0.5 at 40
 ${\rm\mu}$
s. Initially, three holes form on the lobe; two close to the right and left sides of the lobe and one close to the tip. The location of these holes is similar to the case of lower gas-to-liquid density ratio shown in figure 20(b). For the downstream cone on the same figure, the two holes from neighbouring lobes merge and create a larger hole between the centres of the two lobes. This merger is allowed in this high-density case because lobe extension is slower. At lower density, the extension of the central part of each lobe causes the curving crest to separate holes from neighbouring lobes. The third hole close to the crest of the lobe extends simultaneously and the liquid between these two large holes forms a narrow liquid bridge. Capillary waves develop on this small-diameter cylinder-shaped liquid in the middle bridge as figure 33(a) indicates. Figure 33(b) schematically shows the progress of hole and bridge formation on a lobe. Figure 33(c) demonstrates the steps that lead to the break up of the liquid bridge and formation of two ligaments, and a droplet that detaches from the middle bridge. The middle bridge breaks due to capillary action at the two smallest cross-sectional areas and creates a droplet and two ligaments. Therefore, by increasing the gas density, the middle bridge formation is enhanced and new ligaments and a droplet form after its break up. Later, the remaining part of the lobe, which is the rim bridge, breaks and forms new ligaments (not shown here) with the same mechanism that was discussed for the bridge break up at lower gas density. It is seen in figure 33(c) that, although the holes merge between lobe centres, the rim bridge moves farther downstream than the lobe centre after hole merging. This indicates stretching of the bridge which will affect ligament and droplet thicknesses. The case reported in figure 31 was also presented in JS but with a larger mesh size. The resolution here is finer and the bridge and ligament formation are well clarified. However, the JS results had the same number of lobes, wavelength, hole location and time of hole formation. If the hole formation were driven by capillary effects, the mesh size would play a much more significant role.
Projected vortex lines at the interface at (a)
 $t=20~{\rm\mu}$
s, (b) schematic of vortex line deformation in the rim bridge, (c)
 $t=40~{\rm\mu}$
s, (d)
 $t=42~{\rm\mu}$
s: gas-to-liquid density ratio is 0.5,
 $Re=1600$
,
 $We=230\,000$
. (Gas flows from right to left.)

Figure 34(a) shows the projection of vortex lines at the interface for the same flow conditions as figure 33 at an earlier time, i.e. 20
 ${\rm\mu}$
s. The primary hairpin vortices on the lobes deform to create secondary hairpin vortices in a small region between two neighbouring lobes that extend on the edge of the cone. The rim bridge and pairs of counter-rotating vortices form, as schematically shown in figure 34(b). The rim later tears where the two secondary hairpin vortices meet in the middle of the rim bridge. The projected vortex lines at the interface shown in figure 34(c) indicate the extension of secondary hairpin vortices on the middle bridge, as well as the rim bridge, after formation of the holes. The vortex lines on the middle bridge show that the middle bridge forms in a similar fashion to the sketch in figure 34(a). The directions of the projected vortex vectors on the surface are consistent with the radially outward movement of the lobe and bridges; shear from the relative gas flow would cause this type of rotation. Figure 34(d) demonstrates when the middle bridge breaks and forms a droplet in the centre of the rim bridge. The secondary hairpin vortices that coincided with the middle bridge at early stages remain in the ligaments created from the tearing of that bridge.
(a) Interface deformation and the projected vortex lines at the interface
 $t=50~{\rm\mu}$
s, gas-to-liquid density ratio is 0.9,
 $Re=1600$
,
 $We=230\,000$
. (Gas flows from right to left.) (b) Magnified picture showing the vortex lines near the hole and the detached droplet for the same conditions as for (a).

For the 0.9 gas-to-liquid density ratio, the lobe development occurs later than in figure 33 and the lobe edge is less curved, continuing the trend with increasing gas density. Therefore, the arrangement of the holes is slightly different compared to that of figure 33, i.e. the holes are aligned closer to the rim of the lobe. Initially, four holes are evident on the lobe of the upstream cone crest as figure 35(a) shows. The cone, as it moves downstream, develops into one large hole and a tear-shaped droplet. Therefore, a middle bridge does not form for higher gas density. Figure 35(b) shows a magnified view of the two adjacent holes in one lobe and the tear-shaped droplet that formed as a result of merging of the four holes. Figure 35(a) also shows that the vortical structures near the rim for the 0.9 gas-to-liquid density ratio are comparable to results in figure 34(b) and pairs of counter-rotating vortices are evident on the rim.
The radially outward velocity at the lobes, as portrayed in figure 14, increased with increasing gas density, causing an increased outward velocity aft (determined by wave direction) of the surface wave crest through the holes in the lobe, resulting in more rapid growth of the two-phase mixture volume. Increased velocity radially inward, forward of the crest, simultaneously occurs. The effect on radial velocity can qualitatively be explained by the 2-D, inviscid analysis of Rangel & Sirignano (Reference Rangel and Sirignano1991) which treated concentrated vorticity at the two-phase interface. In particular, see their equation (24); the second term on the right-hand side causes a reduction in circulation magnitude aft of the crest and therefore a reduction in the radially outward draft there. As the density difference between the two phases increases, this reduction becomes greater. Other consistent evidence of the gas density impact on the strength of transverse motion comes from JS; after some delay, the magnitude of streamwise vorticity in the ring region increases faster with increasing gas density due to vortex tilting and stretching. For a lower density ratio than considered here, Desjardins & Pitsch (Reference Desjardins and Pitsch2010) obtained ligament formation that extended radially outward, implying a radial gas flow direction at the crest. For that lower density-ratio range, JS found that the baroclinic effect was as strong as vortex tilting and stretching.
Temporal development for gas-to-liquid density ratio equal to 0.5,
 $Re=8000$
,
 $We=57\,500$
; (a–f)
 $t=60{-}110~{\rm\mu}$
s, (g–i)
 $t=120{-}140~{\rm\mu}$
s.

Figure 36 shows a longer duration calculation at higher gas density, higher
 $Re$
and higher surface tension. Longer wavelengths (333
 ${\rm\mu}$
m) and higher initial amplitude were used. Formation of four lobes and the holes, bridges and ligaments are similar to the above findings at high density but with lower surface tension. Now, however, the higher surface tension allows a longer duration calculation with clearer observation of liquid detachment from the jet core. As is typical at high gas density, strong radial development of the spray occurs.
Figure 37 shows the results for the same gas density and kerosene properties (
 $Oh$
) as figure 36 but with higher velocity (
 $Re$
and
 $We$
) and shorter (100
 ${\rm\mu}$
m) wavelength. Another long-duration calculation is allowed with the higher surface tension. Five lobes now appear. The lobes at these higher
 $Re$
and gas density are again less arced at the crest; holes form at the sides of neighbouring lobes and then merge. For these higher densities, more rapid outer development is seen even with the higher surface tension value here. The middle bridges with azimuthal orientation formed for the case in figure 36 but are hidden in that view. Remnants of the broken middle bridges are shown under the wave crest in figure 38.
Lobe, bridge and ligament development, density ratio is 0.5,
 $Re=16\,000$
,
 $We=230\,000$
. (Gas flows from right to left.) (a)
 $t=60~{\rm\mu}\text{s}$
, (b)
 $t=80~{\rm\mu}\text{s}$
, (c)
 $t=100~{\rm\mu}\text{s}$
, (d)
 $t=120~{\rm\mu}\text{s}$
, (e)
 $t=150~{\rm\mu}\text{s}$
, (f)
 $t=180~{\rm\mu}\text{s}$
.

Remnants of middle bridge under the wave crest; density ratio is 0.5,
 $Re=16\,000$
,
 $We=230\,000$
.

5.5 Spray character: droplet size and cone angle
In general, ligaments and bridges are thicker for larger density ratio and lower
 $Re$
or lower
 $We$
. The sizes for the early formed droplets scale with the ligament and bridge sizes. The calculations have not been carried sufficiently far in time to yield a large number of droplets or break up of droplets (secondary atomization). Nevertheless, the computational results are consistent with experimentally measured global features of a spray.
Figure 39 shows the temporal radial development of the mixture of liquid and entrained gas for gas-to-liquid density ratios equal to 0.05, 0.1 and 0.5 for
 $Re=320$
, 1600 and 8000. The outermost radial position of the continuous liquid defines the radial scale of the two-phase mixture. The furthest location of the droplets after they detach from the ligaments and move away from the liquid core for each case has also been shown for gas-to-liquid density ratios equal to 0.05 and 0.1. In the time duration of our calculations, we obtain relatively few droplets, especially for
 $Re=320$
. These droplets have been formed from the middle bridge and rim bridge for 0.5 gas-to-liquid density ratio. Therefore, for the high gas density case, the farthest location of the droplets is roughly equal to the outer bound of the liquid and entrained gas mixture.
Radial temporal development of the mixture of liquid and entrained gas for gas-to-liquid density ratio equal to 0.05, 0.1 and 0.5, (a)
 $Re=320$
,
 $We=230\,000$
; (b)
 $Re=1600$
,
 $We=230\,000$
and
 $Re=8000$
,
 $We=57\,500$
.

The two-phase mixture scale grows faster and extends more radially outward for higher gas density for both
 $Re$
values. The previously described radially outward velocity component increases with gas density, thus explaining the faster increasing volumetric growth rate with increasing gas density.
For
 $Re=320$
and the lowest gas density, the jet instability develops more slowly and the cone crests do not develop noticeably before the ligaments form from the elongation of the corrugations on the cones, becoming longer and extending further radially outward. As figure 39(a) shows, no droplet forms before 90
 ${\rm\mu}$
s. The ligaments must first elongate to produce the droplets. Afterwards, the first droplets form quickly compared to the overall development time of the cone crests. After the ligaments form, they spread radially outward. The droplets form at earlier times for gas-to-liquid density ratio equal to 0.1 compared to 0.05 since the droplets are created from the disintegration of the ligaments that, in turn, form from the tearing of the lobes as discussed earlier. Figure 39(b) indicates that, by increasing the
 $Re$
, the low gas density case behaves similar to those at higher gas densities; however, the liquid jet spreads more for the highest density ratio, i.e. 0.5, during the same time period. The larger entrained mixture volume at any given time for larger gas density observed in our temporal analysis is consistent with the larger spray cone angle observed with a larger gas density in spatially developing spray jets. This behaviour is supported by a variety of empirical evidence (Abramovich Reference Abramovich1963; Yokota & Matsuoka Reference Yokota and Matsuoka1977; Reitz & Bracco Reference Reitz and Bracco1979).
Figure 40 demonstrates the size of the droplets measured directly within the calculations up to 90
 ${\rm\mu}$
s for gas-to-liquid density ratios of 0.05, 0.1 and 0.5 and for
 $Re=320$
, 1600 and 8000. Larger droplets are formed for higher gas densities. With increasing liquid viscosity, i.e. decreasing
 $Re$
, the droplet size increases for all gas-to-liquid density ratios. This is in agreement with the experimental studies of Hiroyasu & Kadota (Reference Hiroyasu and Kadota1974) for a single-hole diesel spray injected into gas with pressure varying between 0.1 and 5.0 MPa. They showed that the droplet size increased with an increase in gas pressure, i.e. an increase in gas density. Their results demonstrated that an increase in the liquid viscosity or a decrease in the injection velocity, i.e. a decrease in
 $Re$
keeping the liquid density constant, increases the mean droplet size (Hiroyasu & Kadota Reference Hiroyasu and Kadota1974; Hiroyasu & Tabata Reference Hiroyasu, Arai and Tabata1989). An increase in surface tension, i.e. decrease in
 $We$
, increases early droplet size, as indicated in figure 40 where a simultaneous decrease in liquid viscosity and increase in surface tension make little change. The difference between the droplet size for gas-to-liquid density ratios equal to 0.05 and 0.1 for
 $Re=1600$
is not significant, as shown in figure 40. By increasing
 $Re$
from 1600 to 8000 and reducing the
 $We$
from 230 000 to 57 500 for density ratio equal to 0.5, no significant difference in droplet size was observed.
Droplet size for 0.05, 0.1 and 0.5 gas-to-liquid density ratios for
 $Re=320$
and
 $1600$
,
 $We=230\,000$
; density ratio equal to 0.5,
 $Re=8000,We=57\,500$
.

6 Conclusion and summary
Following the preliminary work of JS, the understanding of liquid stream break up and concurrent smaller structure formation is built upon an examination of both translation and rotation of the fluid. The formations of lobes, holes, bridges, ligaments and early droplets have been explained and quantified. Dependencies on
 $Re$
,
 $We$
, liquid viscosity and gas density have been analysed, covering three distinct physical domains. Coherent behaviour with variations through the parameter domains has been described. Vorticity dynamics has provided a useful explanation for the formations. The mechanics have been explained by relating surface wave dynamics and vortex dynamics.
At higher
 $Re$
(1600–16 000) and
 $We$
(57 500–230 000), lobe number is well ordered, increasing with
 $Re$
, and lobes are longer in the stream direction; the lobes have more curvature at the crest edge and a more regular formation of holes in the sheet formed by the conical crest. The holes enlarge, causing a rim bridge of liquid at the wave crests on the lobes.
At density ratios of 0.5–0.9 throughout the
 $Re$
range, lobes occur and are regular but develop more slowly, thereby having lower curvature in the azimuthal direction at the crest and extending a shorter distance in the gas-stream direction. This allows holes in neighbouring lobes to merge before the rims break to form ligaments. Consequently, liquid bridge formations are longer in this domain. At these higher gas densities throughout the
 $Re$
range, a middle bridge between two holes also forms.
The rim bridges at the crest eventually tear due to capillary action, transforming the crest rims to ligaments and opening the holes. The ligaments remain connected to the continuous liquid at one end and swing outward radially, thereby affecting spray cone angle. In cases where they exist, middle bridges also break by capillary action, forming two ligaments and a centred droplet. They are not as thick as rim bridges and break earlier.
The primary hairpin vortices on the lobes deform to create secondary hairpin vortices in a small region between two neighbouring lobes that extend on the edge of the cone. Pairs of counter-rotating vortices form in the rim bridge after the formation of the hole on the lobe. The same vortex structure is observed in the middle bridge. The bridges break where the two secondary hairpin vortices turn in the opposite direction at the centre of the rim. The sheet of gas between the liquid core and the liquid lobes has itself lobes which are directed opposite to and azimuthally out of phase with the liquid lobes.
In cases where both gas density and
 $Re$
are lower, the well-ordered lobes are replaced by a more irregular corrugation with a smaller wavelength along the edge of the conical wave crest. Ligaments form on the lobes by stretching before holes form. The crests are thicker here, explaining a delay in hole formation. Still, the ligament extension is driven by the pressure gradient rather than shear. Detailed experimental results describing the smaller structures are available only in this lower-valued domain and agree qualitatively with the computational results here. While higher-
 $Re$
experiments have poorer resolution, qualitative agreement with the calculations are obtained.
For
 $Re=320$
and the low gas density, a different mechanism affects the early instability; the cone crests do not develop noticeably before the ligaments form from the elongation of the corrugations on the cones, becoming longer and extending further radially outward. By increasing the
 $Re$
, the low gas density case behaves similar to those at higher gas densities. One must suspect therefore that the
 $Re$
based on gas density and viscosity is more important than our liquid-based
 $Re$
in determining the bifurcation in ligament formation. While viscosity was not important in determining the momentum balance for the ligament, it does affect the velocity field near the interface and the ligaments. In all cases, hole formations align with hairpin and helical vortices; accordingly, the perforations correlate with resulting fluid motion from these vortices.
The integral of the streamwise vorticity over the cross-section plane is zero; however, the integral of the absolute magnitude of that vorticity grows, showing strengthening of the hairpins while the lobes thin and holes form. Accordingly, circulation in the hairpin region is shown to increase with time.
 $We$
based on liquid lobe thickness is much larger than unity value as holes form, indicating that inertial effects rather than capillary action dominates the hole formation process. Thus, the hole formation process here is different from previous examples of liquid tearing in the literature. Mass and momentum fluxes in the streamwise direction are integrated over a cross-section. Gas-to-liquid mass-flux ratios increase with time at both the braid and ring; momentum ratio is roughly constant at the braid but fluctuates at the ring where the unsteadiness is greater. With the periodic conditions, little variation is expected or found in the stream direction.
Increase of surface tension at lower density ratio and lower
 $Re$
has a similar effect to increasing liquid viscosity. The lobes are smaller and more random in appearance. Still, velocity is a factor in bifurcation of behaviour; velocity has an effect and no critical value of
 $Oh$
is found. An increase in surface tension at higher
 $Re$
can act similar to an increase in liquid viscosity by decreasing the number of well-organized lobes. At larger surface tension and higher
 $Re$
, the crest does not form a thin liquid sheet extending downstream above the liquid core. Thus, rather than a perforation through a sheet, cavities form, similar to the findings of Desjardins & Pitsch (Reference Desjardins and Pitsch2010), but they still correlate with hairpin vortex structures. The cavity formation becomes less likely than the perforation at the higher-
 $Oh$
values expected at higher pressures.
Capillary action causes break up of droplets from the ligaments and bridges. Thicknesses of liquid bridges and ligaments and early droplet sizes increase with increasing gas density and increasing liquid viscosity; i.e. thicker ligaments and larger droplets form in the low
 $Re$
, low gas density range. The droplets form at earlier times for gas-to-liquid density ratio equal to 0.1 compared to 0.05 since the droplets are created from the disintegration of the ligaments that, in turn, form from the tearing of the lobes.
The two-phase mixture volume develops faster and extends more radially outward for higher gas density for all
 $Re$
values tested. This correlates with the radial velocity increase at the ring with increasing gas density. This effect can be explained by the increasing reduction in circulation magnitude aft of the surface wave crest with increasing density difference across the surface.
Predicted early droplet sizes and radial dimensions of the emerging spray show good qualitative agreement with experimental evidence. Sizes increase with increasing liquid viscosity or surface tension.
Acknowledgement
Access to the NICS Kraken supercomputer under Allocation TG-CTS130062 and to the UCI HPC cluster were very valuable in performing our high resolution computations.