In 2014, the Centers for Medicare and Medicaid Services (CMS) established the Hospital Acquired Conditions Reduction Program (HACRP) to motivate hospitals to reduce healthcare-associated infections (HAIs). Reference Zimlichman, Henderson and Tamir1 Under the HACRP, hospitals in the worst-performing quartile are penalized 1% of their total CMS payment for inpatient care. Reference Cassidy2 HAI measurements also comprise 25% of total performance scores in the CMS Hospital Value-Based Purchasing program (HVBP). 3 Under the HVBP, 2% of each acute care hospital’s total inpatient payments are withheld and redistributed based on performance. 3 Despite the goals of these programs in reducing HAIs or in improving quality of care, several aspects of HAI-based comparisons have been questioned. These include risk adjustment, surveillance bias, preventability, measure validity, and biases against high-volume hospitals. Reference Rajaram, Chung and Kinnier4–Reference Bearman, Doll and Cooper10
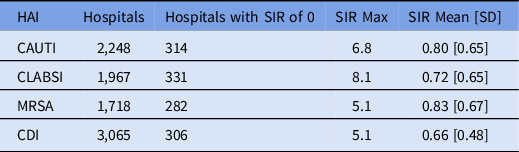
HAI measurements are based on the standardized infection ratio (SIR), that is, the ratio of reported infections to those predicted by risk-adjusted models of the National Healthcare Safety Network (NHSN). 11 To avoid imprecise calculations, SIRs are not reported for hospitals with <1 predicted infection. 11 Despite this precaution and the inclusion of volume (eg, patient days, device days) in the NHSN models, SIRs remain biased by volume. Reference Armbrister, Finke, Long, Korvink and Gunn12,13 Although hundreds of low-volume hospitals can tie for the best score (SIR = 0) or have extremely high SIRs, high-volume hospitals rarely achieve a SIR of 0 (Table 1). Reference Armbrister, Finke, Long, Korvink and Gunn12 Although methods have been proposed to correct the volume-based bias in SIRs, the cause remains unknown even as it continues to bias hospital comparisons. Reference Armbrister, Finke, Long, Korvink and Gunn12,13
Four types of HAIs included in the CMS Hospital-Acquired Condition (HAC) Reduction Program and Hospital Value-Based Purchasing (HVBP) Program a

Note. HAI, hospital-associated infection; SIR, standardized infection ratio; max, maximum; SD, standard deviation; CAUTI, catheter-associated urinary tract infection; CLABSI, central-line–associated bloodstream infection; MRSA, methicillin-resistant Staphylococcus aureus; CDI, Clostridioides difficile infection; CMS, Centers for Medicare and Medicaid Services.
a Data on SIRs were obtained from publicly available CMS Hospital Compare archives files dated January 29, 2020. These data exclude hospitals having <1 predicted infection.
We hypothesized that the volume-based bias of SIRs emerges from 2 general statistical relationships. First, according to the inverse relationship between sample size and sampling error, lower volume should lead to greater random variation in infection rates. Reference Monrad, Harner and Stout14 Second, according to the relationship between sample size and sensitivity (ie, true positive rate, detection probability, statistical power), higher volumes should, by chance alone, lead to higher detection probabilities. Reference Monrad, Harner and Stout14 Consequently, the lower a hospital’s volume of patient days or device days, the more it risks a high SIR and the more easily it achieves an SIR of zero by chance. In contrast, high-volume hospitals should have less variable rates of infection and greater rates of detection, but little chance of reporting zero HAIs.
The volume-based bias of SIRs may be compounded by preventability and surveillance bias. Estimates of the nonpreventable portion of HAIs range from 30% to 65% depending on HAI type. Reference Schreiber, Sax, Wolfensberger, Clack and Kuster9,Reference Bearman, Doll and Cooper10 If these percentages were underestimated or if they increased over time as quality improvements reduced preventable causes, then the incidence of HAIs may be increasingly influenced by volume as well as other factors outside the control of hospitals (eg, the prevalence of MRSA in the broader community). Reference Popovich, Snitkin and Hota15 Although surveillance is within the control of hospitals, studies have suggested that high-volume hospitals may employ greater surveillance as a consequence of greater resources. Reference Rajaram, Chung and Kinnier4,Reference Koenig, Soltoff and Demiralp6 If so, then differences in rates of detection based solely on volume could be exacerbated by volume-based differences in surveillance.
In this study, we used 7 years (2014–2020) of publicly available, quarterly reported CMS HAI data on 4,268 hospitals to test our hypothesis that the volume-based bias in the SIR is driven by the statistical consequences of sample size, that is, the random effects of volume. We assess the ability of these random effects to explain reported numbers of HAIs and distributions of SIRs across time. We then built random expectations based on volume into the calculations of SIRs to produce a new metric, the standardized infection score (SIS). We assessed the degree to which the SIS mitigates the volume-based bias of the SIR and evaluated changes to hospital rankings. We also discuss the implications for the HACRP and HVBP.
Methods
Data source
We obtained 7 consecutive years of hospital-level HAI data from publicly available CMS Hospital Compare archives. 16 These archives contain HAI data for each hospital participating in Medicare and span yearly quarters from July 2014 to April 2020. We excluded quarters after April 2020 due to the ongoing effects of the coronavirus disease 2019 (COVID-19) pandemic on HAI rates. Reference Baker, Sands and Huang17 We focused on 4 HAI types: central-line–associated bloodstream infection (CLABSI), catheter-associated urinary tract infection (CAUTI), infection due to Clostridioides difficile (CDI), and infection due methicillin-resistant Staphylococcus aureus (MRSA) (Table 1). 11 For each quarter and each HAI type, we included all hospitals with publicly reported SIRs. Because we analyzed each quarter independently, our analyses did not require each hospital to contribute data over the entire 7-year period.
Statistical analysis
SIRs versus volume
We characterized relationships between SIRs and volume using patient days (MRSA and CDI) and device days (CLABSI and CAUTI). According to our hypothesis, we expected variation in SIRs to increase as volume decreased, resulting in high SIRs and high frequencies of SIRs equal to 0 at low volumes. As volume increased, we expected SIRs to converge to values greater than 0, resulting in few hospitals with SIRs equal to 0.
Characterizing random effects of volume
If random effects of volume are responsible for the volume-based bias in SIRs, then random outcomes driven by volume should approximate distributions of real SIRs. Likewise, random expectations based on volume may explain substantial fractions of variation in reported numbers of HAIs. To evaluate these expectations, we used a combination of iterative random sampling, optimization, goodness-of-fit testing, linear regression, and measures of statistical distance.
We modeled probabilities of reporting an HAI per patient day or device day (p) as the probability of an infection occurring per patient day or device day (p i ) multiplied by the probability of detecting infections when they occur (p d ): p = p i ⋅ p d . In accordance with our hypothesis, we modeled p d as an increasing function of volume: p d = days/(days + z), where z determined the rate of increase. We derived optimized values of p i and z for each HAI type in each quarter using iterative searches of their parameter space (Appendix 1 online).
We used optimized values of p i and z to calculate the number of HAIs expected at random (E = p ⋅ days). We then used a constrained linear regression (slope = 1, y-intercept = 0) to determine the percent of variation in reported numbers of HAIs that was explained by random expectations. We also used optimized values of p i and z to simulate SIRs that could have resulted as chance outcomes driven by volume, that is, by replacing numerators of real SIRs with random outcomes. We used the percent histogram intersection (∩), an intuitive measure of similarity, to compare distributions of real and simulated SIRs.
Standardized infection score (SIS)
We developed a standardized infection score (SIS) to account for differences between numbers of observed infections (O), numbers of predicted infections used in SIR calculations (P), and numbers infections expected at random (E):
 $$\left( {O{\rm{\;}}-{\rm{\;}}E} \right)\ + {\rm{\;}}\left( {O{\rm{\;}}-{\rm{\;}}P} \right)\ + {\rm{\;}}\left( {P{\rm{\;}}-{\rm{\;}}E} \right)$$
 $$=2 \cdot \left( {O - E} \right)$$
As the coefficient of 2 cannot affect rankings, it is dropped to yield one half the sum of differences or simply, O – E. Standardizing by P yields the SIS:
 $$SIS = (O\; - \;E)/P$$
Ultimately, the SIS makes only a small modification to the SIR. Like the SIR, lower SIS values represent better scores. Unlike the SIR, which has a lower bound of zero, the SIS can take negative values and thus, has no lower bound. Hence, the SIS not only accounts for infections expected at random but should avoid the aggregation of scores that occurs when many low-volume hospitals have SIRs of 0.
Winsorized z-scores and ranking
Unlike the use of SIRs in the HVBP, the HACRP transforms SIRs via Winsorization and z-scores. 18 Winsorization aims to decrease the influence of outliers by adjusting any SIR less than the fifth percentile or greater than the 95th percentile to those respective percentiles. After Winsorization, SIRs are z-scored for standardization across HACRP components. We conducted Winsorization and z-transformations on the SIR and SIS to compare the effects of these transformations on the 2 metrics. Finally, we analyzed the impact of using the SIS versus SIR when ranking hospitals.
Data and analytical code availability
We performed our analyses using common libraries in Python version 3.8 software (Python, Fredericksburg, VA). Source code and data are available at https://github.com/Rush-Quality-Analytics/HAIs.
Results
Relationship between SIRs and volume
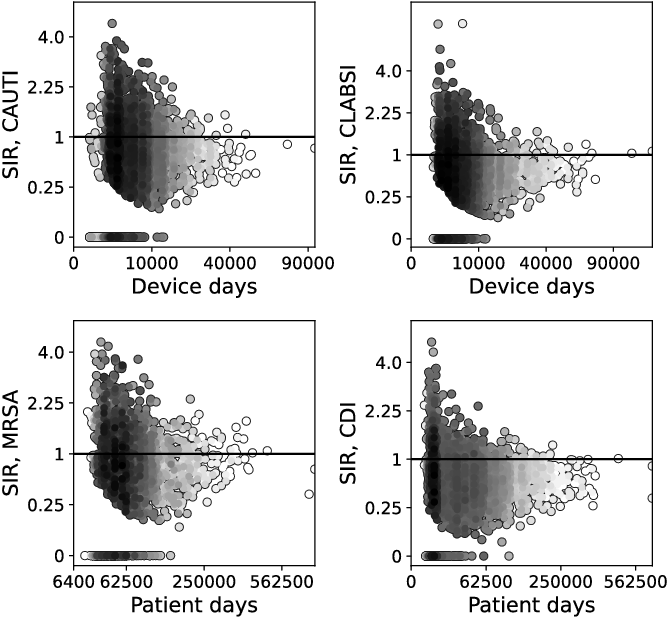
As hypothesized, variation in SIRs decreased as volume increased, leading low-volume hospitals to receive the highest (worst) and lowest (best) SIRs (Fig 1). Among hospitals with less than the median volume, the mean percentage of hospitals across quarters with SIRs of 0 was 32.8% [SD, 6.0] for CLABSI, 30.0% [SD, 5.6] for CAUTI, 27.9% [SD, 1.7] for MRSA, and 20.0% [SD, 3.6] for CDI. These percentages were considerably lower for hospitals with volumes greater than or equal to the median: 5.0% [SD, 2.7] for CLABSI, 3.2% [SD, 2.0] for CAUTI, 4.7% [SD, 0.8] for MRSA, and 0.3% [SD, 0.01] for CDI.
Relationships of SIRs to volume. Analysis based on the April 2020 CMS HAI file. Heat maps show the density of data; darker shades correspond to higher density. Horizontal black lines indicate SIR values of 1.

Probabilities of infection and detection
Across HAI types, the estimated probabilities of an infection per patient day or device day (p i ) were within ranges reported by prior studies (Supplementary Table 1 online). Reference Li, Cao, Ge, Jiang, Zhou and Zheng19–Reference Eddy33 Across quarters, we obtained the following mean values of p i : 0.0025 [SD, 0.0013] for CAUTI, 0.0011 [SD, 0.0002] for CLABSI, 0.0001 [SD, 0.0001] for MRSA, and 0.0008 [SD, 0.0001] for CDI. Probabilities of detection (p d ) varied greatly among hospitals because they were modeled to increase with volume (Supplemental Table 2). For example, the average median probability of detecting CDI was 0.639 [SD, 0.077] across quarters, with an average minimum of 0.1006 [SD, 0.0362] and an average maximum of 0.9752 [SD, 0.0084]. Valid comparisons of p d to prior studies could not be made due to varying bases of detection and unreported days.
Influence of the random effects of volume
Random expectations based on volume explained most of the variation in reported HAIs, resulting in strong support for our hypothesis. Across quarters, random expectations explained a mean of 84% [SD, 0.02] of variation in CDI, a mean of 70% [SD, 0.06] of variation in CAUTI, a mean of 67% [SD, 0.06] of variation in CLABSI, and a mean of 54% [SD, 0.02] of variation in MRSA (Supplementary Fig. 1 online). These small standard deviations revealed consistent percentages of explained variation in reported infections across time.
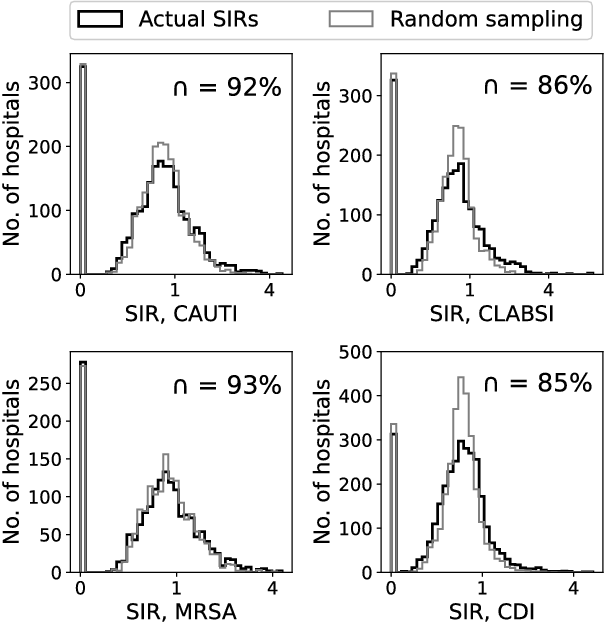
In additional support of our hypothesis, distributions of actual SIRs were closely approximated by distributions of simulated SIRs. That is, where SIR numerators were replaced with random outcomes according to optimized probabilities of infection and detection (Fig. 2). In particular, simulated SIRs closely reproduced the aggregation of actual SIRs at zero (Fig. 2). Across quarters, we obtained the following mean percentage histogram intersections between distributions of simulated and actual SIRs: 91.3% [SD, 1.3] for MRSA, 88.0% [SD, 3.1] for CAUTI, 87.1% [SD, 2.3] for CLABSI, and 86.1% [SD, 2.2] for CDI.
Histograms of actual SIRs (black) and SIRs based on random sampling, that is, where numbers of reported cases were replaced with random outcomes (gray); ∩ is the percent of overlap between the histograms. Analyses based on the April 2020 CMS HAI file.

SIR versus SIS
Raw scores
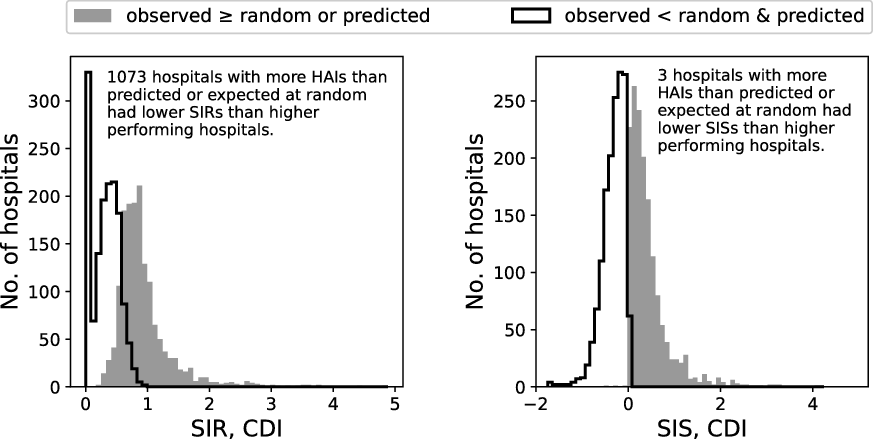
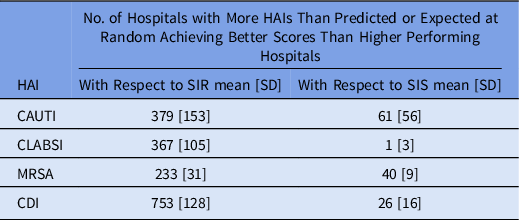
Unlike distributions of the SIR, in which hundreds of hospitals tie for the best score (SIR = 0), distributions of the SIS were largely symmetrical and centered around zero, that is, the point where reported numbers of HAIs equal random expectations (Fig. 3 and Supplementary Figs. 2–4 online). In addition to accounting for random expectations and eliminating aggregation at extreme values, the SIS resolved other issues with the SIR. Specifically, the NHSN risk-adjusted predictions are nullified when the SIR numerator is zero. This never occurred with the SIS because SIS values never exactly equaled zero. Finally, hundreds of hospitals that failed to outperform their random expectation or their risk-adjusted prediction received better (lower) SIRs than higher-performing hospitals (Table 2, Fig. 3, and Supplemental Figs. 2–4 online). Such outcomes were relatively rare with the SIS.
Distributions of the SIS and SIR for Clostridioides difficile infections (CDI). Each distribution is divided into (1) hospitals with fewer infections than predicted from risk-adjusted models and fewer infections than expected at random (white) and (2) hospitals with more infections than predicted from risk-adjusted models or than expected at random (gray). Analyses based on the April 2020 CMS HAI file.

Hospitals with More Infections Than Predicted or Expected at Random That Achieved Lower (Better) Scores Than Hospitals That Outperformed Both Their Prediction and Their Random Expectation a

Note. HAI, hospital-associated infection; SIR, standardized infection ratio, SIS, standardized infection score; SD, standard deviation; CAUTI, catheter-associated urinary tract infection; CLABSI, central-line–associated bloodstream infection; MRSA, methicillin-resistant Staphylococcus aureus; CDI, Clostridioides difficile infection.
a Values are averaged across yearly quarters.
Winsorized z-scores
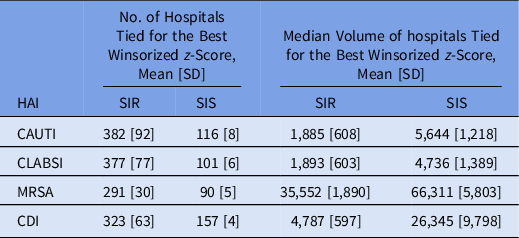
Transforming the SIRs into Winsorized z-scores neither corrected for the aggregation of low-volume hospitals achieving the lowest (best) score nor allowed hospitals of higher volume to achieve competitively low scores (Table 3, Supplementary Figs. 5–8 online). In fact, SIRs of 0 were so common that Winsorization at the fifth percentile of SIRs had zero effect. In contrast, applying Winsorization and z-scores to the SIS increased the median volume of hospitals with the lowest (best) score and decreased the number of hospitals tied for the best score by 69.6% for CAUTI, 73.2% for CLABSI, 69.0% for MRSA, and 51.4% for CDI (Table 3 and Supplementary Figs. 5–8 online).
Results for Winsorized z-Scores Based on the SIR and the SIS a

Note. SIR, standardized infection ratio, SIS, standardized infection score; HAI, hospital-associated infection; SD, standard deviation; CAUTI, catheter-associated urinary tract infection; CLABSI, central-line–associated bloodstream infection; MRSA, methicillin-resistant Staphylococcus aureus; CDI, Clostridioides difficile infection.
a Results for each HAI are averaged across yearly quarters (mean ± standard deviation). For both the SIR and SIS, the lowest Winsorized z-score corresponds to the best score. Volumes are with respect to device days (CAUTI, CLABSI) and patient days (MRSA, CDI).
Changes in HAI rankings
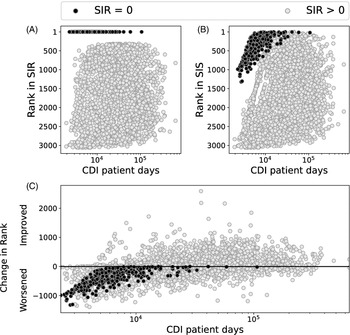
Use of SIS for ranking the performance of hospitals resulted in a drastic reordering of hospitals relative to the use of SIRs. Across quarters, hospitals with SIRs of 0 for CDI dropped by an average of 381 ranks [SD, 285] when using the SIS (Fig 4, Supplementary Figs. 9–11 and Supplementary Table 3 online). Results were similar for other HAI types (Supplementary Table 3 online). However, hospitals with SIRs of 0 retained their high ranks if they had relatively high volumes, suggesting that SIRs of 0 are unlikely the result of random chance when volume is high.
Comparison of ranked scores for the SIR and SIS versus volume for Clostridioides difficile infections (CDI). (A) Rank in the SIR versus volume. (B) Rank in the SIS vs. volume. Ranks of 1 represent the top (best) rank. (C) Changes in rank that occur when using the SIS instead of the SIR. In each subplot, hospitals that had SIRs of 0 are plotted as black points. Analyses based on the April 2020 CMS HAI file.

Across quarters, the SIS caused hospitals below the tenth percentile in volume to worsen by the following averages: 563 ranks [SD, 335] for CAUTI, 357 ranks [SD, 246] for CLABSI, 328 ranks [SD, 211] for MRSA, and 666 ranks [SD, 416] for CDI. Many of these hospitals had SIRs of 0 (Fig. 4 and Supplementary Figs. 9–11 online). In contrast, the SIS caused hospitals above the 90th percentile in volume to improve by the following averages: 282 ranks [SD, 308] for CAUTI, 127 ranks [SD, 150] for CLABSI, 131 ranks [SD, 231] for MRSA, and 326 ranks [SD, 338] for CDI. In support for the fairness of SIS, many high-volume hospitals dropped in rank after using the SIS, whereas many low-volume hospitals improved (Fig. 4 and Supplementary Figs. 9–11).
Discussion
In our study, we hypothesized that statistical consequences of sample size (ie, random effects of volume) drive a critical bias in the standardized infection ratios (SIRs) used in the comparison of patient safety and quality of care among hospitals. We demonstrated how random effects of volume can explain the extreme variation in SIRs among low-volume hospitals, why hundreds of low-volume hospitals often tie for the best and lowest score (SIRs of 0), and why high-volume hospitals have little chance of reporting zero HAIs. After building our hypothesized mechanisms into models based on random sampling, we found that the random effects of volume closely approximate distributions of SIRs and can explain up to 84% of variation in numbers of reported HAIs.
In allowing hundreds of hospitals to tie for the lowest and best score (SIR = 0), use of the SIR nullifies the effect of its own denominator (risk-adjusted predictions), obscures potentially large differences in performance, and negates the use of Winsorization to control for low SIR outliers. SIRs also allowed hundreds of hospitals that failed to outperform their risk-adjusted prediction or their random expectation to achieve better rankings than higher-performing hospitals. In making only a slight modification to the SIR, the standardized infection score (SIS) mitigated these effects and allowed hospitals with disparate volumes to achieve competitive SIS scores while decreasing the number of hospitals tied for the best score, whether based on raw scores or Winsorized z-scores.
Others have proposed changes to the SIR that would affect hospital rankings. Reference Armbrister, Finke, Long, Korvink and Gunn12,Reference Caroff, Wang and Zhang32 In focusing on colon-surgery infection rates, assignments to the worst-performing quartile drastically change when risk adjustment includes variables that current methodologies omit. Reference Caroff, Wang and Zhang32 Substantial changes in rankings also occur when assuming a nonlinear relationship between volume and numbers of infections, an approach that also produces predictions of greater accuracy. Reference Armbrister, Finke, Long, Korvink and Gunn12 If included, these refinements may improve the reliability of SIR denominators (predicted numbers of infections). However, without accounting for the random effects of volume and without eliminating the lower bound of zero, SIRs will retain a predominant bias and continue to risk the aggregation of hospitals at the lowest score; ultimately obscuring performance while conflating it with volume.
Correcting the shortcomings of the SIR may have financial implications for the HACRP and HVBP. Under the HACRP, hospitals in the worst-performing quartile are penalized 1% of their total CMS payment for inpatient care. If one hospital is removed from the worst-performing quartile, another will likely take its place. As a result, the total penalties levied by the CMS when penalizing high-volume hospitals may be far greater than when penalizing the same number of low-volume hospitals. Unlike the HACRP, the HVBP withholds 2% of CMS inpatient payments from participating acute care hospitals and redistributes the sum according to total performance. This dynamic, of low performers subsidizing rewards to high performers, may drastically change if fewer high-volume hospitals rank as low performers.
Beyond comparisons of HAIs and the penalties incurred by hospitals, our study highlights an ongoing issue facing the prevention of HAIs. Uncertainty is inherent to most systems and has long been recognized as a confounding force in healthcare. Reference Eddy33 With respect to HAIs, the so-called preventable portion has been estimated at 55%–70%, leaving the nonpreventable portion as a major source of uncertainty. Reference Bearman, Doll and Cooper10 The large percentages of variation in HAI cases that were explained by random expectations (54%–84%) may indicate that the nonpreventable portion is largely driven by the random effects of volume. Mitigating this uncertainty to decrease HAIs will be an ongoing challenge, and measures of performance used in hospital rankings and payment adjustments must account for it.
Our study had several limitations. Improvements are needed in public data and raise questions that future studies may answer. First, creating SIS-based HAC scores was impossible due to differences between CMS data sets. Specifically, the SIR denominators needed to calculate the SIS are not available in HACRP files and cannot be imputed from HAI files. SIR denominators in HAI files are based 1 measurement year, at most, whereas SIR denominators used by the HACRP are based on 2 years. Also, we did not examine characteristics of hospitals that consistently had either less or more HAIs than expected at random. In addition, we did not examine the potential for hospitals to decrease HAIs in the presence of strong random effects and without subverting surveillance.
The statistical consequences of sample size produce strong volume-based biases in SIRs. CMS and the NHSN can prevent these biases and other shortcomings of the SIR by adopting the SIS. However, even if the SIS replaced the SIR, the concerns of previous studies would still need to be addressed. In particular, the modeling and variables that underpin the risk-adjusted predictions of the NHSN (ie, denominators of the SIR and SIS) deserve greater justification or modification. Likewise, differences in surveillance also need to be addressed if HAI performance measures are to reflect the relative quality of hospitals. Otherwise, objections to the SIR will continue to mount as hospitals continue to risk unjustified penalties, reputational damage, and misdirected quality improvement efforts.
Supplementary material
To view supplementary material for this article, please visit https://doi.org/10.1017/ice.2022.288
Acknowledgments
Financial support
No financial support was provided relevant to this article.
Conflicts of interest
All authors report no conflicts of interest relevant to this article.