Introduction
Waterhemp [Amaranthus tuberculatus (Moq.) Sauer] is a small-seeded, summer annual dicot weed that has become increasingly prominent across much of the corn (Zea mays L.) and soybean [Glycine max (L.) Merr.] production areas of the Midwestern United States (Hager et al. Reference Hager, Wax, Simmons and Stoller1997; Steckel Reference Steckel2007). Amaranthus tuberculatus is indigenous to Illinois but was not a problematic weed species until the widespread adoption of conservation tillage (Refsell and Hartzler Reference Refsell and Hartzler2009) and evolution of multiple herbicide resistances (Tranel et al. Reference Tranel, Riggins, Bell and Hager2011), which allowed A. tuberculatus to rapidly establish in agronomic production systems (Hager et al. Reference Hager, Wax, Simmons and Stoller1997). Management is essential for crop production, because high A. tuberculatus densities (8 plants m−2) can reduce soybean and corn yields by up to 56% and 74%, respectively (Steckel Reference Steckel2007).
Amaranthus tuberculatus is capable of high reproductive output in a variety of conditions, with female plants capable of producing more than 400,000 seeds growing in 68% shade to approximately 1 million seeds under ideal conditions (Steckel et al. Reference Steckel, Sprague, Hager, Simmons and Bollero2003). These seeds have the ability to remain dormant and viable within the soil seedbank for several years (Buhler and Hartzler Reference Buhler and Hartzler2001; Steckel et al. Reference Steckel, Sprague, Stoller, Wax and Simmons2007). In addition to high reproductive output, A. tuberculatus is a dioecious and obligate-outcrossing species. Obligate outcrossing promotes high genetic diversity, recombination, and pollen-mediated gene flow in A. tuberculatus, which contributes to rapid development of multiple herbicide resistances (Sarangi et al. Reference Sarangi, Tyre, Patterson, Gaines, Irmak, Knezevic, Lindquist and Jhala2017; Shergill et al. Reference Shergill, Barlow, Bish and Bradley2018; Tranel et al. Reference Tranel, Riggins, Bell and Hager2011). Confirmed resistances to 4-hydroxyphenylpyruvate dioxygenase (HPPD), acetolactate synthase (ALS), protoporphyrinogen oxidase (PPO), photosystem II (PSII), and very-long-chain fatty-acid–inhibiting herbicides, as well as glyphosate and/or the synthetic auxin 2,4-D, have been reported in several Midwestern A. tuberculatus populations (Heap Reference Heap2020; Shergill et al. Reference Shergill, Barlow, Bish and Bradley2018; Strom et al. Reference Strom, Davis, Gonzini, Mitsdarfer, Riechers and Hager2019).
In Midwestern corn production, atrazine and HPPD-inhibiting herbicides provide effective chemical options for residual control of A. tuberculatus and are typically applied together in PRE or POST tank mixes (Abendroth et al. Reference Abendroth, Martin and Roeth2006; Woodyard et al. Reference Woodyard, Bollero and Riechers2009). Tank mixtures can delay the selection and development of herbicide-resistant weed populations (Evans et al. Reference Evans, Tranel, Hager, Schutte, Wu, Chatham and Davis2016). Atrazine resistance is commonly conferred by amino acid substitutions in the chloroplast D1 protein, the target site for PSII inhibitors, in resistant weeds (Frenkel et al. Reference Frenkel, Matzrafi, Rubin and Peleg2017). Although target-site and non–target site atrazine-resistance (atz-R) mechanisms exist in weeds (Délye et al. Reference Délye, Jasieniuk and Le Corre2013), metabolism-based atz-R is of great concern and has recently become more common (Ma et al. Reference Ma, Kaundun, Tranel, Riggins, McGinness, Hager, Hawkes, McIndoe and Riechers2013b; Nakka et al. Reference Nakka, Godar, Thompson, Peterson and Jugulam2017; Preston Reference Preston2004; Vennapusa et al. Reference Vennapusa, Faleco, Vieira, Samuelson, Kruger, Werle and Jugulam2018; Yu and Powles Reference Yu and Powles2014). The increase in the frequency of metabolic atz-R is potentially due to the lack of a fitness cost typically reported in atz-R weeds with an altered D1 protein (Holt et al. Reference Holt, Powles and Holtum1993; Vila-Aiub et al. Reference Vila-Aiub, Neve and Powles2009). Metabolic atz-R in a multiple herbicide–resistant (MHR) A. tuberculatus population from central Illinois (named MCR for McLean County resistant) is conferred by rapid glutathione (GSH) conjugation to atrazine (Ma et al. Reference Ma, Kaundun, Tranel, Riggins, McGinness, Hager, Hawkes, McIndoe and Riechers2013b), which is catalyzed by glutathione S-transferase (GST) activity (Cummins et al. Reference Cummins, Dixon, Freitag-Pohl, Skipsey and Edwards2011; Labrou et al. Reference Labrou, Papageorgiou, Pavli and Flemetakis2015; Perperopoulou et al. Reference Perperopoulou, Pouliou and Labrou2018).
Mesotrione belongs to the triketone family of HPPD-inhibiting herbicides. HPPD-inhibiting herbicides (Group 27) include the triketones, isoxazoles, and pyrazolones (Beaudegnies et al. Reference Beaudegnies, Edmunds, Fraser, Hall, Hawkes, Mitchell, Schaetzer, Wendeborn and Wibley2009; Ndikuryayo et al. Reference Ndikuryayo, Moosavi, Yang and Yang2017). The MCR population (also called the SIR population; O’Brien et al. Reference O’Brien, Davis and Riechers2018) described above is both mesotrione-resistant (meso-R) and topramezone-resistant due to rapid oxidative metabolism of the parent herbicide (Lygin et al. Reference Lygin, Kaundun, Morris, Mcindoe, Hamilton and Riechers2018; Ma et al. Reference Ma, Kaundun, Tranel, Riggins, McGinness, Hager, Hawkes, McIndoe and Riechers2013b), presumably catalyzed by one or more cytochrome P450 enzymes (P450s). Greenhouse studies have examined the genetics and inheritance of atz-R and meso-R traits independently in the MCR population (Huffman et al. Reference Huffman, Hausman, Hager, Riechers and Tranel2015), and inheritance of meso-R was also investigated in MHR A. tuberculatus populations from Iowa (Kohlhase et al. Reference Kohlhase, Edwards and Owen2018) and Nebraska (Oliveira et al. Reference Oliveira, Gaines, Jhala and Knezevic2018). Each of these inheritance studies concluded that meso-R in A. tuberculatus is a multigenic, or quantitative trait, and Kohlhase et al. (Reference Kohlhase, Edwards and Owen2018) demonstrated that the number of functional genes governing the meso-R trait increased as the mesotrione rate increased. In contrast, metabolic atz-R phenotypically segregated 3:1 (R:S) at 0.98 kg atrazine ha−1 POST (Huffman et al. Reference Huffman, Hausman, Hager, Riechers and Tranel2015) or 1:2:1 (RR:Rr:rr) at 14.4 kg atrazine ha−1 POST (Evans et al. Reference Evans, O’Brien, Ma, Hager, Riggins, Lambert and Riechers2017) in a F2 population derived from MCR, indicating atz-R is inherited as a monogenic, nuclear-encoded trait.
Populations within A. tuberculatus and Palmer amaranth (Amaranthus palmeri S. Watson), the only two weed species with confirmed HPPD inhibitor–resistant populations, are also multiple resistant to atrazine (Heap Reference Heap2020). This suggests a possible association between these two traits in spite of presumed distinct detoxification mechanisms (Evans et al. Reference Evans, O’Brien, Ma, Hager, Riggins, Lambert and Riechers2017; Ma et al., Reference Ma, Kaundun, Tranel, Riggins, McGinness, Hager, Hawkes, McIndoe and Riechers2013b). By contrast, atz-R A. tuberculatus populations that remain sensitive to mesotrione have been commonly reported (Heap Reference Heap2020; Patzoldt et al. Reference Patzoldt, Tranel and Hager2005; Yu and Powles Reference Yu and Powles2014). It is possible, however, that the single gene conferring metabolic atz-R (Huffman et al. Reference Huffman, Hausman, Hager, Riechers and Tranel2015) might be one of several unknown genes involved in meso-R in the MHR A. tuberculatus populations. In the current study, experiments were designed to investigate the hypothesis that metabolic atz-R and meso-R traits were independently controlled in a segregating F2 population. The following objectives were designed to experimentally test our hypothesis: (1) generate a pseudo-F2 population that segregates for meso-R and atz-R traits, and (2) develop a screening procedure that allows surviving meso-R F2 plants to be subsequently treated with atrazine and phenotypically assessed for atz-R, and vice versa.
Materials and Methods
Generation of F1 and Pseudo-F2 Populations, Dose Response, and Metabolism of Mesotrione
Greenhouse Crosses
Based on our previous results regarding mesotrione metabolism in the MCR population (Ma et al. Reference Ma, Kaundun, Tranel, Riggins, McGinness, Hager, Hawkes, McIndoe and Riechers2013b), a single cross was made between one male (MCR-6) parent and one female (WCS-2) parent to generate an F1 (Ma et al. Reference Ma, Kaundun, Hawkes, Hausman, Tranel, Hager, Mcindoe and Riechers2013a). The MCR-6 clonal line was selected because it displayed the fastest rate of mesotrione metabolism among the six meso-R lines tested, while the WCS-2 line displayed one of the slowest mesotrione metabolic rates among sensitive lines (Ma et al. Reference Ma, Kaundun, Tranel, Riggins, McGinness, Hager, Hawkes, McIndoe and Riechers2013b). Five male F1 plants were then intermated with a single female F1 plant to create a pseudo-F2 population. Although the exact number of genes conferring meso-R is currently unknown (Huffman et al. Reference Huffman, Hausman, Hager, Riechers and Tranel2015; Kohlhase et al. Reference Kohlhase, Edwards and Owen2018), the MCR-6 male clone was chosen for making a cross with the sensitive WCS-2 parent due to the greater likelihood of MCR-6 possessing a homozygous meso-R genotype at each locus based on its rapid mesotrione metabolic rate (Ma et al. Reference Ma, Kaundun, Tranel, Riggins, McGinness, Hager, Hawkes, McIndoe and Riechers2013b). By contrast, male MCR parents chosen for crosses in prior inheritance work (Huffman et al. Reference Huffman, Hausman, Hager, Riechers and Tranel2015) likely included some heterozygous individuals.
Mesotrione Dose–Response Analysis
A whole-plant dose–response study was conducted with the MCR-6 clonal line, WCS population (the WCS-2 clonal line was lost during continuous vegetative cloning), and the F1 under similar greenhouse and plant culturing conditions as described previously (O’Brien et al. Reference O’Brien, Davis and Riechers2018). All seeds were stratified using methods outlined by Bell et al. (Reference Bell, Hager and Tranel2013), then placed in 12-cm potting tray inserts filled with commercial potting soil (LC1, Sun Gro Horticulture, 15831 NE 8th Street, Bellevue, WA 98008). Seeds were germinated in a growth chamber with 28/22 C day/night temperatures and a photoperiod of 16/8 h. Light within the growth chamber was provided by incandescent and fluorescent bulbs that delivered 550 μmol m−2 s−1 photon flux at the plant canopy. Plants were then transferred to the greenhouse, and upon reaching 3 to 4 cm were evenly spaced within a heavy-duty planter flat in LC1 potting soil supplemented with slow-release fertilizer (Osmocote® 13-13-13, Scotts, 14111 Scottslawn Road, Marysville, OH 43041). Natural sunlight in the greenhouse was supplemented with mercury halide lamps to provide 800 μmol m−2 s−1 photon flux at the plant canopy level as previously described (O’Brien et al. Reference O’Brien, Davis and Riechers2018).
Mesotrione (CallistoTM herbicide, Syngenta Crop Protection, Greensboro, NC 27409) was applied POST to 10- to 12-cm plants with 1% (v/v) crop oil concentrate (COC) (Herbimax®, Loveland Products, Loveland, CO 80538) and 2.5% (v/v) liquid ammonium sulfate (AMS) (N-Pak®, Winfield United, Shoreview, MN 55126) as adjuvants. Mesotrione rates ranged from 0.105 to 10,500 g ha−1, spaced equally on a log 3.16 scale (105 g ha−1 is the labeled POST rate in corn). Treatments were applied with an automated compressed-air research sprayer (DeVries Manufacturing, 86956 State Highway 251, Hollandale, MN 56045) fitted with a TeeJet® 80015 EVS nozzle (TeeJet Technologies, P.O. Box 7900, Wheaton, IL 60187) calibrated to deliver 185 L ha−1 at 275 kPa at 45 cm above the plant canopy. Aboveground biomass was harvested at 14 d after treatment (DAT) and dried in an oven at 65C for 7 d. Dry weights were then recorded and converted into a percentage of the respective nontreated control plants.
Dry-weight data were collected from two separate studies, with treatments arranged in a completely randomized design with six replications. Levene’s test for homogeneity of variance was not significant; as a result, the data from both studies (12 replications in total) were pooled and analyzed by nonlinear regression using the dose–response curve package in R (Knezevic et al. Reference Knezevic, Streibig and Ritz2007). Rates of mesotrione required to decrease plant biomass by 20%, 50%, and 80% (GR20, GR50, and GR80, respectively) were determined as previously described (Ma et al. Reference Ma, Evans and Riechers2016; O’Brien et al. Reference O’Brien, Davis and Riechers2018) using the following four-parameter nonlinear logistic model (Equation 1).
 $$y = c + {{d - c} \over {1 + \exp \{ {\rm{b}}[\log ({\rm{x}}) - \log ({\rm{G}}{{\rm{R}}_{50}})]\} }}$$
where b is the slope of the curve, c is the lower limit, d is the upper limit, and GR50 is 50% reduction in dry weight.
Mesotrione Metabolism Using an Excised Leaf Assay
Rates of mesotrione metabolism were measured by the time required for 50% of absorbed mesotrione to degrade (DT50) during a time-course study using the same plant materials described earlier. Excised leaves from plants (10 to 12 cm) from each line or population (MCR-6, WCS, and F1) were incubated for 1 h in a 0.1 M Tris-buffered solution (pH 6.0) containing 150 µM [URL-14C]mesotrione in a growth chamber, as described previously by Ma et al. (Reference Ma, Kaundun, Tranel, Riggins, McGinness, Hager, Hawkes, McIndoe and Riechers2013b, Reference Ma, Skelton and Riechers2015). Two independent experiments arranged in a completely randomized design were conducted for the metabolic study, and each treatment (line/population by time point) was replicated six times. Levene’s test for homogeneity of variance was not significant; as a result, the data from both studies (12 replications in total) were pooled and analyzed by nonlinear least-squares regression analysis and fit with a simple first-order curve in order to estimate DT50 values. The model was described by the following equation.
 $$y = {C_0}{e^{ - {\frac{{{\rm{ln}}\left( 2 \right)}}\over{{{\mu _i}}}}t}}$$
where y represents the percentage of the parent herbicide remaining at time t, µ i is the DT50 for each biotype i, and the parameter C 0 is the estimated amount of parent herbicide present at t = 0.
Characterization of Atrazine Resistance in the Male MCR-6 Parent
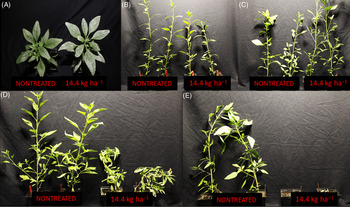
The MCR-6 × WCS-2 cross (described previously in “Methods”) was performed with the intent of investigating the genetics and inheritance of the meso-R trait (Ma et al. Reference Ma, Kaundun, Hawkes, Hausman, Tranel, Hager, Mcindoe and Riechers2013a), but the phenotype of the MCR-6 clonal line in regard to atz-R was not determined before the cross was made. Before the F2 population could be used for experiments to investigate our hypothesis that meso-R and atz-R traits in A. tuberculatus are independently controlled, it was necessary to determine whether the male MCR-6 parent was homozygous atz-R. A discriminatory atrazine POST rate was used to distinguish between the two possible atz-R genotypes (RR and Rr) based on their distinct phenotypes (Evans et al. Reference Evans, O’Brien, Ma, Hager, Riggins, Lambert and Riechers2017). MCR-6 vegetative clones were continually propagated in a growth chamber and greenhouse, as described previously (Ma et al. Reference Ma, Kaundun, Tranel, Riggins, McGinness, Hager, Hawkes, McIndoe and Riechers2013b, Reference Ma, Skelton and Riechers2015) under the same growth conditions described earlier. Once the cloned MCR-6 plants had reached a height of 9 to 11 cm (at or before the 8-leaf stage), atrazine was applied POST at a rate of 14.4 kg ha−1 (with 1% [v/v] COC and 2.5% [v/v] AMS), and treated plants were then returned to the greenhouse. Amaranthus tuberculatus injury was assessed by visual inspection at 7, 14, and 21 DAT based on the amount of chlorotic and necrotic tissue and height differences. Plants that rapidly developed healthy, new green tissue following atrazine treatment and were as tall as nontreated controls were assigned a homozygous (RR) atrazine-R genotype (Figure 1A–C). By comparison, plants that developed less green meristematic tissue than RR lines following atrazine treatment, were stunted, and did not grow significantly taller after application were considered representative of the heterozygous (Rr) atrazine-R genotype (Figure 1D). Plants that died at the 14.4 kg ha−1 discriminatory rate within 7 DAT were assigned an atrazine-sensitive (rr) genotype (Figure 1E) (Evans et al. Reference Evans, O’Brien, Ma, Hager, Riggins, Lambert and Riechers2017).
Phenotypic segregation of MCR-6 (cloned male parent) and individual F2 clonal lines of Amaranthus tuberculatus in response to foliar-applied atrazine at 14 d after treatment. MCR-6 and several F2 plants (9 to 11 cm) were treated with 14.4 kg ha−1 atrazine (with 1% [v/v] crop oil concentrate and 2.5% [v/v] liquid ammonium sulfate) to distinguish among the three possible atrazine-resistant (atz-R) phenotypes (described in Evans et al. Reference Evans, O’Brien, Ma, Hager, Riggins, Lambert and Riechers2017). (A) Top view of MCR-6 nontreated and treated plants showing lack of foliar injury and necrosis; (B) side view of MCR-6 nontreated and treated plants showing lack of foliar injury, necrosis, and minimal height reduction; (C) side view of homozygous atz-R F2 plants; (D) side view of heterozygous atz-R F2 plants; and (E) side view of homozygous atrazine-sensitive F2 plants. The four plants in each of panels C to E were cloned from a single, randomly chosen F2 “mother” plant, and thus are genetically identical.

Sequential Treatments and Segregation Analysis of the Pseudo-F2 Population
Plants from the previously described F2 population at a height of 9 to 11 cm were treated with either 260 g ha−1 mesotrione (including 1% [v/v] methylated seed oil [MSO] [MSO concentrate, Loveland Products]) or 2 kg ha−1 atrazine (with 1% [v/v] COC and 2.5% [v/v] AMS). The 2 kg ha−1 atrazine rate was chosen because it represents the maximum labeled POST rate in corn and clearly distinguishes atz-R from atrazine-sensitive plants; that is, resistance could be identified visually, because homozygous and heterozygous atz-R F2 plants exhibited little injury and regrew rapidly, while sensitive plants quickly died (Evans et al. Reference Evans, O’Brien, Ma, Hager, Riggins, Lambert and Riechers2017; Huffman et al. Reference Huffman, Hausman, Hager, Riechers and Tranel2015). The relatively high rate of POST mesotrione was chosen based on preliminary tests to differentiate meso-R from mesotrione-sensitive plants but without killing intermediately meso-R individuals (described in detail below). The rate of mesotrione POST (260 g ha−1) also represents an approximate GR80 rate determined in previous greenhouse studies by our research group with the MCR/SIR population (Hausman et al. Reference Hausman, Singh, Tranel, Riechers, Kaundun, Polge, Thomas and Hager2011; O’Brien et al. Reference O’Brien, Davis and Riechers2018) that ensured sensitive plants would not survive.
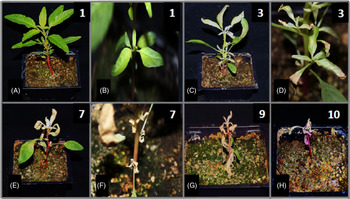
Following the first mesotrione treatment, assessments of visual injury were recorded 7, 14, and 21 DAT on a scale of 1 to 10. A rating of 1 represented minimal injury (mainly green tissue), while a rating of 10 represented complete plant death by 21 DAT. Due to the polygenic nature of meso-R in A. tuberculatus (Huffman et al. Reference Huffman, Hausman, Hager, Riechers and Tranel2015), a 1 to 10 rating scale was, chosen because a range of phenotypes were observed (in accord with Kohlhase et al. Reference Kohlhase, Edwards and Owen2018). Using the 1 to 10 scale (Figure 2), plants with ratings of 1 to 5 at 21 DAT were considered meso-R. A rating of 1 or 2 reflected a plant with minimal bleaching and necrosis (possibly homozygous meso-R at each locus; Figure 2A and B). A rating of 3 to 5 reflected plants with a completely bleached apical meristem that retained some green leaf tissue on the lower part of the plants. Plants with bleached meristems that were rated 3 to 5 survived to 21 DAT, and eventually reached reproductive stages (Figure 1C and D, plants with a rating of 3 are shown). Plants rated 6 to 10 incurred significant initial injury through 21 DAT and died before flowering (Figure 2E–H).
Representative visual assessment of injury scale illustrating the 1 to 10 ratings used to characterize the range of symptomology exhibited by mesotrione-treated F2 plants (white number in upper-right corner of each panel). A mesotrione-resistant (meso-R) F2 plant showing minor bleaching symptomology, representing an injury rating of 1, shown at the seedling level (A) and close-up of an axillary bud (B). A meso-R F2 plant displaying more bleaching and some necrosis on leaf tips but eventually recovered, representing an injury rating of 3, shown at the seedling level (C) and close-up of axillary buds (D). A mesotrione-sensitive F2 plant demonstrating severe necrosis that killed the meristems; the plant eventually died before 21 d after treatment (DAT), representing an injury rating of 7, shown at the seedling level (E) and close-up of axillary buds (F). Mesotrione-sensitive F2 plants that died within 14 DAT, representing injury ratings of 9 and 10 (G, H).

Because a range of meso-R phenotypes were present in the segregating F2 population (Figure 2), some meso-R plants incurred significant initial bleaching and necrosis at the apical meristem and axillary buds, which made the vegetative cloning process extremely difficult (particularly for plants rated 4 or 5). A foliar antioxidant solution was developed and tested to overcome the initial oxidative injury generated by mesotrione (Hess Reference Hess2000; Mitchell et al. Reference Mitchell, Bartlett, Fraser, Hawkes, Holt, Townson and Wichert2001) and “rescue” intermediately meso-R plants. The solution consisted of 0.1 mM sodium ascorbate (final pH adjusted to 6.0 with 0.1 N HCl), 0.1 mM vitamin A acetate (diluted from a stock in 95% dimethyl sulfoxide), and 20 µM Trolox ((±)-6-hydroxy-2,5,7,8-tetramethylchromane-2-carboxylic acid; Sigma-Aldrich, St Louis, MO 63103) diluted from a stock in absolute ethanol. Trolox is a water-soluble, synthetic form of vitamin E that has been used previously to scavenge free radicals in biological systems (Hamad et al. Reference Hamad, Arda, Pekmez, Karaer and Temizkan2010). The spray solution also included 0.25% (v/v) nonionic surfactant (Activator 90, Loveland Products) to facilitate spray absorption and leaf wetting and 1% (v/v) ethanol to increase compound solubility. The antioxidant solution was applied liberally with a hand mist sprayer at 14 DAT with mesotrione, then again at 21 DAT (just before vegetative cloning; described below) to facilitate recovery of intermediately meso-R plants (plants rated 3 to 5; Figure 2). Solutions were prepared the day of application to avoid oxidation and instability of antioxidants. In preliminary tests to investigate the potential of an indirect safening response by the antioxidant solution, 10- to 12-cm atrazine-sensitive plants not treated with either herbicide were treated with the antioxidant solution and then again at 7 d after antioxidant application. Plants were then treated at 14 d after the initial antioxidant application with 2 kg ha−1 atrazine and assessed visually for injury and height differences. Repeated foliar applications of the antioxidant solution did not induce atz-R in A. tuberculatus plants.
The apical meristems from individual meso-R or atz-R F2 plants from the first herbicide treatment were clipped at 21 DAT to facilitate axillary bud growth and cloning (Ma et al. Reference Ma, Skelton and Riechers2015). Cloning resistant survivors was necessary in order to apply the second herbicide treatment to 9- to 11-cm-tall plants, as the original resistant parent plants continued to grow during the 21-d recovery period and resulted in plants outside labeled heights for control. Axillary buds from each resistant plant were placed in individual pots within plastic inserts filled with LC1 potting soil and returned to the growth chamber for 4 to 5 d to establish roots. To promote root growth, the axillary buds were treated with a powder containing indole-3-butyric acid (Sigma-Aldrich). Seedlings were transferred to the greenhouse until the second POST herbicide treatment, as described earlier.
To investigate the potential genetic relationship between the two resistance traits in the F2 population, the same screening procedure was conducted, but in the reverse order, following the first herbicide treatment. For example, surviving atz-R plants were treated with 260 g ha−1 mesotrione, and meso-R plants were treated with 2 kg ha−1 atrazine POST when plants reached 9 to 11 cm in height. Each experiment was repeated 10 times (Trials 1 to 10 or 11 to 20) with 20 to 89 individual F2 plants tested within each trial for the first herbicide treatment. To ensure the percentage of atz-R and meso-R plants was consistent in both studies, regardless of the order in which the herbicides were applied, the probabilities of these intersections were compared using a combination of conditional probability and χ2 goodness-of-fit tests (α = 0.05; Bernardo Reference Bernardo2010; Ott and Longnecker Reference Ott, Longnecker and Taylor2010). Specifically:
 $$P(A \cap M) = P(A | M) \times P(M) $$
where P(A ∩ M) is the probability that a plant is both atz-R and meso-R; P(A | M) is the conditional probability of atz-R, given that a plant is meso-R; and P(M) is the marginal probability of meso-R. In the inverse study, the following equation was used:
 $$P(M \cap A) = P(M | A) \times P(A) $$
where P(M ∩ A) is the probability that a plant is both meso-R and atz-R; P(M | A) is the conditional probability of meso-R, given that a plant is atz-R; and P(A) is the marginal probability of atz-R. Provided the order in which the herbicide is applied does not influence the likelihood of a plant being both atz-R and meso-R, P(A ∩ M) and P(M ∩ A) should be nonsignificantly different, as verified by a χ2 goodness-of-fit test.
Results and Discussion
Generation of F1 and Pseudo-F2 Populations, Dose Response, and Metabolism of Mesotrione
Mesotrione Dose–Response Analysis
F1 plants generally displayed an intermediately meso-R phenotype (e.g., Figure 2C and D) in relation to the MCR-6 parent and WCS (Figure 3). Resistance indices (RIs) of 36-fold, 50-fold, and 66-fold were calculated based on GR20, GR50, and GR80 values, respectively, for MCR-6 relative to WCS following mesotrione treatment (Table 1). Both the GR50 (105 g ha−1) and RI (50-fold) for MCR-6 are greater than the GR50 (48.5 g ha−1) and RI (35-fold) calculated for the MCR field population in relation to WCS in previous research (Hausman et al. Reference Hausman, Singh, Tranel, Riechers, Kaundun, Polge, Thomas and Hager2011). The greater GR50 and RI of the MCR-6 clone (relative to WCS; Table 1) compared with the original MCR population (also calculated relative to WCS; Hausman et al. Reference Hausman, Singh, Tranel, Riechers, Kaundun, Polge, Thomas and Hager2011) supports a greater likelihood for homozygosity at one or more genetic loci conferring meso-R in the MCR-6 male clone compared with the MCR plants used in previous genetics and inheritance research (Huffman et al. Reference Huffman, Hausman, Hager, Riechers and Tranel2015). However, further molecular–genetic studies are required to verify the actual meso-R genotype of the MCR-6 male clone.
Mesotrione dose–response curves for the male parent (MCR-6) clonal line, WCS population, and the F1 generated by crossing MCR-6 with WCS-2. Mesotrione was applied to 10- to 12-cm plants at rates spaced on a log 3.16 scale ranging from 0.105 to 10,500 g ha−1 with 1% (v/v) crop oil concentrate and 2.5% (v/v) liquid ammonium sulfate as adjuvants. Two independent experiments were conducted with six replications each. Dry-weight data were pooled and analyzed by nonlinear least-squares regression using the dose–response curve package in R (Knezevic et al. Reference Knezevic, Streibig and Ritz2007) to determine rates of mesotrione required to decrease plant biomass by 20%, 50%, and 80% (GR20, GR50, and GR80, respectively), as previously described (Ma et al. Reference Ma, Evans and Riechers2016; O’Brien et al. Reference O’Brien, Davis and Riechers2018). Vertical bars represent the treatment mean ± SE.


a Estimated GR20, GR50, and GR80 values (rates of mesotrione required to decrease plant biomass by 20%, 50%, and 80%, respectively) are expressed as rates of mesotrione in g ha−1. GR values are followed by their respective standard errors of the mean in parentheses.
b Amaranthus tuberculatus populations: MCR-6, cloned male parent; WCS, herbicide-sensitive population; F1, generated by crossing MCR-6 with WCS-2.
Mesotrione Metabolism Using an Excised Leaf Assay
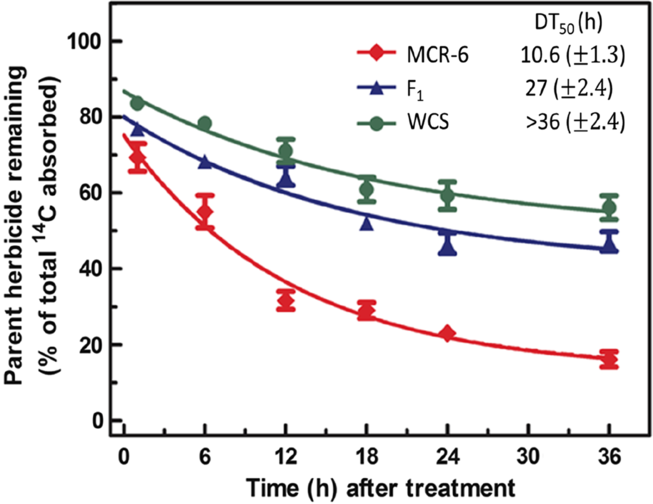
Rapid mesotrione metabolism by the MCR-6 clone (DT50 of 10.6 h) and the inability of WCS to reach a DT50 (>36 h) was measured (Figure 4), which is in accord with previous research analyzing the MCR-6 clone (DT50 of 9.5 h) and several WCS clones (median DT50 of >45 h) (Ma et al. Reference Ma, Kaundun, Tranel, Riggins, McGinness, Hager, Hawkes, McIndoe and Riechers2013b). Additionally, the F1 displayed an intermediate DT50 (27 h) that was closer to WCS in the mesotrione metabolic study than MCR-6, particularly at the later time points examined (Figure 4). The metabolic results are consistent with GR50 values determined for POST mesotrione in the dose–response study (Table 1; Figure 3). When taken together with the dose–response results (Figure 3) that indicated greater fold resistance of the MCR-6 clone relative to the MCR population (Hausman et al. Reference Hausman, Singh, Tranel, Riechers, Kaundun, Polge, Thomas and Hager2011), the mesotrione metabolic results rationalize our selection of the MCR-6 and WCS-2 clones to generate F1 and pseudo-F2 populations for meso-R segregation analysis.
Mesotrione metabolism in excised Amaranthus tuberculatus leaves from the male parent (MCR-6) clonal line, WCS population, and the F1 generated by crossing MCR-6 with WCS-2. Excised leaves from 10- to 12-cm plants were treated with 150 µM [URL-14C]mesotrione for 1 h, and a time-course study was conducted to determine the time required for 50% of absorbed mesotrione to degrade (DT50), as described by Ma et al. (Reference Ma, Kaundun, Tranel, Riggins, McGinness, Hager, Hawkes, McIndoe and Riechers2013b, Reference Ma, Skelton and Riechers2015). Two independent experiments were conducted with six replications each. Data were pooled, analyzed by nonlinear least-squares regression analysis, and fit with a simple first-order curve to estimate DT50 values. Vertical bars represent the treatment mean ± SE, and DT50 values for each line or population are shown ±SE.
Characterization of Atrazine Resistance in the Male MCR-6 Parent
Typical foliar necrosis symptoms resulting from atrazine (14.4 kg ha−1) were not detected in any treated MCR-6 cloned plant (Figure 1A and B). In addition, significant height reductions were not observed in any treated MCR-6 plant in comparison to nontreated control plants at 7, 14, and 21 DAT (Figure 1B, only 14 DAT is shown). The lack of injury to or significant height reductions in treated plants indicates that the cloned MCR-6 plants, and thus the original MCR-6 male parent, are homozygous atz-R. To further investigate the genotype of MCR-6, several randomly chosen plants were selected from the segregating F2 population and treated with the same discriminatory atrazine rate to compare with the phenotype of MCR-6 as described previously (Evans et al. Reference Evans, O’Brien, Ma, Hager, Riggins, Lambert and Riechers2017). As expected, three distinct phenotypes were observed, and representative F2 plants are shown (Figure 1C–E) to illustrate typical plant responses within each genotypic category. Importantly, homozygous atz-R F2 plants (Figure 1C) were phenotypically similar to MCR-6 (Figure 1B) and clearly distinguishable from heterozygous atz-R F2 plants (Figure 1D).
Sequential Treatments and Segregation Analysis of the Pseudo-F2 Population
When mesotrione was applied POST first at 260 g ha−1, a range of meso-R phenotypes were delineated by using the portion of the rating scale from 1 to 5 describing meso-R plants (details listed in “Methods” and representative ratings of 1 and 3 shown in Figure 2A–D). The overall treatment mean percentage of meso-R plants was 8.2% (P(M) = 8.2%; Table 2), which is consistent with a quantitative, polygenic trait as well as previous reports describing meso-R in A. tuberculatus (Huffman et al. Reference Huffman, Hausman, Hager, Riechers and Tranel2015; Kohlhase et al. Reference Kohlhase, Edwards and Owen2018). Atrazine treatment at a rate of 2 kg ha−1 clearly separated atz-R (both homozygous and heterozygous) plants from atrazine-sensitive plants under greenhouse conditions (data not shown). Surprisingly, 100% of all meso-R clones were atz-R (Table 2), empirically determining the inheritance of meso-R is genetically related to inheritance of atz-R. The conditional probability (P(A | M) = 100%) strongly supports that either the gene conferring atz-R is also involved with controlling meso-R or that the genes are linked. To determine which of these two possibilities was more plausible, the marginal and conditional probabilities of the inverse study were also calculated (Equations 3 and 4).
Sequential phenotyping experiment in a segregating F2 population to quantify resistant individuals to mesotrione and atrazine.
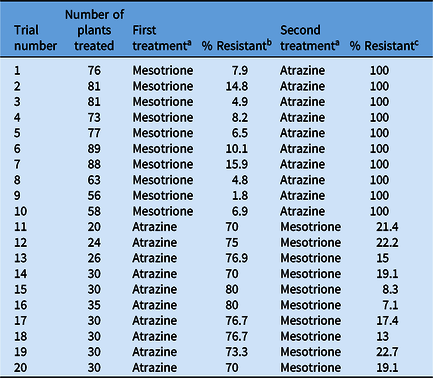
a Mesotrione was applied at 260 g ha−1 with 1% (v/v) methylated seed oil. Atrazine was applied at 2 kg ha−1 with 1% (v/v) crop oil concentrate and 2.5% (v/v) liquid ammonium sulfate as adjuvants.
b Original F2 plants treated with foliar herbicide (mesotrione or atrazine).
c Vegetatively cloned plants, derived from surviving resistant plants from the first herbicide treatment, were treated with the other herbicide when plants reached a height of 9 to 11 cm as described in “Methods.”
In the inverse study, the overall treatment mean percentage of atz-R plants (easily discernible by 14 DAT) where atrazine was applied first was 74.9% (Table 2). Atz-R plants were then cloned as previously described and treated with mesotrione POST. The observed frequency of plants that were both meso-R and atz-R in the inverse study was 12.4% (Equation 4). Using a χ2 goodness-of-fit test, this percentage (i.e., the probability that a plant is resistant to both herbicides) was found to be nonsignificantly different from the observed 8.2% across the 10 trials (P-value = 0.30), as expected. Therefore, the order in which the herbicides were applied did not influence the probability that a plant was resistant to both herbicides. Furthermore, the conditional probability that plants were meso-R given they were atz-R (P(M | A)) was experimentally determined as 16.5% (Table 2), which is significantly greater than the observed frequency of mesotrione resistance without atrazine prescreening (8.2%) (P-value = 0.006). Comparing conditional probability results from the atrazine first–mesotrione second study (P(M | A) = 16.5%) to the conditional probability determined in the complementary study (P(A | M) = 100%) strongly supports the hypothesis that the gene conferring metabolic atz-R is also involved with controlling the meso-R trait, but that additional gene(s) are necessary to confer meso-R in MCR-6.
Interestingly, the conditional probability P(M | A) = 16.5% (atrazine first–mesotrione second experiment) calculated in our research is consistent with a non-epistatic, independently assorting model that includes a sole atz-R locus and two additional loci that segregate in a ratio of 13:3 (S:R). These results are also consistent with a recently proposed model for mesotrione resistance in A. tuberculatus from Iowa (Kohlhase et al. Reference Kohlhase, Edwards and Owen2018), where greenhouse results showed that three genetic loci governed resistance at mesotrione rates ≥210 g ai ha−1. Importantly, the rate of mesotrione used for screening in our greenhouse experiments was 260 g ha−1 (Table 2). However, more detailed research studies are necessary to further refine and test this hypothesis and genetic model experimentally.
In the case of mesotrione resistance and atrazine resistance in MCR-6, our results imply that 100% of meso-R plants in the F2 population are also atz-R, but atz-R plants are not necessarily meso-R. This theory can be explained if the single gene in MCR-6 conferring atz-R (most likely encoding a GST that rapidly metabolizes atrazine; Evans et al. Reference Evans, O’Brien, Ma, Hager, Riggins, Lambert and Riechers2017) is necessary, but not sufficient by itself to confer mesotrione resistance, which likely requires at least two additional genes at mesotrione rates ≥210 g ai ha−1 (in accord with Kohlhase et al. Reference Kohlhase, Edwards and Owen2018). The contribution of a qualitative trait contributing to a different quantitative trait has been previously hypothesized for plant pathogen resistance (Nelson et al. Reference Nelson, Wiesner-Hanks, Wisser and Balint-Kurti2018). Our proposed genetic model is consistent with the increase in meso-R frequency quantified following preselection for atz-R (8.2% to 16.5%), coupled with the inverse experiment showing an increase in atz-R frequency from 75% to 100% following preselection for meso-R (Table 2). Our determination of an association between meso-R and atz-R traits is also indirectly supported by several reports of meso-R and metabolic atz-R A. tuberculatus plants and populations in the field (Heap Reference Heap2020), where all known meso-R A. tuberculatus populations are also atz-R (Heap Reference Heap2020; Ma et al. Reference Ma, Kaundun, Tranel, Riggins, McGinness, Hager, Hawkes, McIndoe and Riechers2013b). However, several reported atz-R A. tuberculatus populations (due to rapid metabolism) are not meso-R; for example, the Adams County, IL, resistant population that possesses metabolic atz-R (Ma et al. Reference Ma, Kaundun, Tranel, Riggins, McGinness, Hager, Hawkes, McIndoe and Riechers2013b) is sensitive to mesotrione and other HPPD-inhibiting herbicides (O’Brien et al. Reference O’Brien, Davis and Riechers2018; Patzoldt et al. Reference Patzoldt, Tranel and Hager2005). The F2 plants treated with antioxidant solution before the application of atrazine also followed a 3:1 (R:S) segregation ratio (data not shown), indicating that this solution did not confer an indirect safening response that would interfere with the data analysis from the other screenings in our study.
Mesotrione metabolism in corn is due to P450-catalyzed hydroxylation of the dione ring (Hawkes et al. Reference Hawkes, Holt, Andrews and Thomas2001), and a similar P450-catalyzed pathway (evidenced by formation of 4-hydroxy-mesotrione) rapidly metabolized mesotrione in the MCR population (Ma et al. Reference Ma, Kaundun, Tranel, Riggins, McGinness, Hager, Hawkes, McIndoe and Riechers2013b). More recent research has demonstrated the rice (Oryza sativa L.) gene HIS1, which encodes a Fe(II)/2-oxoglutarate–dependent oxygenase enzyme, governs tolerance to several triketone HPPD-inhibiting herbicides in rice via oxidative metabolism (Maeda et al. Reference Maeda, Murata, Sakuma, Takei, Yamazaki, Karim, Kawata, Hirose, Kawagishi-Kobayashi, Taniguchi, Suzuki, Sekino, Ohshima, Kato, Yoshida and Tozawa2019). Because GSH conjugates of mesotrione have not been identified in crops or weeds to date (Hawkes et al. Reference Hawkes, Holt, Andrews and Thomas2001; Kaundun et al. Reference Kaundun, Hutchings, Dale, Howell, Morris, Kramer, Shivrain and Mcindoe2017; Ma et al. Reference Ma, Kaundun, Tranel, Riggins, McGinness, Hager, Hawkes, McIndoe and Riechers2013b; Mitchell et al. Reference Mitchell, Bartlett, Fraser, Hawkes, Holt, Townson and Wichert2001), it might seem implausible to suggest a GST enzyme could be associated with the meso-R trait in A. tuberculatus. However, some GST proteins catalyze glutathione peroxidase (GPOX) or dehydroascorbate reductase activity, where GSH becomes oxidized and cytotoxic lipid peroxides or dehydroascorbate, respectively, are reduced during each reaction (Mashiyama et al. Reference Mashiyama, Malabanan, Akiva, Bhosle, Branch, Hillerich, Jagessar, Kim, Patskovsky, Seidel, Stead, Toro, Vetting, Almo, Armstrong and Babbitt2014; Perperopoulou et al. Reference Perperopoulou, Pouliou and Labrou2018). These reactions differ from GST-catalyzed conjugation of GSH directly to herbicide substrates (e.g., atrazine, chloroacetamides) possessing an electrophilic site (Riechers et al. Reference Riechers, Kreuz and Zhang2010), because GSH is consumed (Cummins et al. Reference Cummins, Dixon, Freitag-Pohl, Skipsey and Edwards2011). The “indirect” mechanism for hydroperoxide detoxification by a GST with GPOX activity (AmGSTF1) has been reported in MHR blackgrass (Alopecurus myosuroides Huds.) from the United Kingdom, where resistances to several classes of herbicides that generate oxidative stress was reported, such as the phenylureas (Cummins et al. Reference Cummins, Cole and Edwards1999, Reference Cummins, Wortley, Sabbadin, He, Coxon, Straker, Sellars, Knight, Edwards, Hughes, Kaundun, Hutchings, Steel and Edwards2013). Accordingly, we propose the same GST enzyme that metabolizes atrazine in MCR-6 also contributes to meso-R by detoxifying lipid peroxides resulting from triplet chlorophyll and reactive oxygen species that are produced following mesotrione treatment (Beaudegnies et al. Reference Beaudegnies, Edmunds, Fraser, Hall, Hawkes, Mitchell, Schaetzer, Wendeborn and Wibley2009; Hess Reference Hess2000; Mitchell et al. Reference Mitchell, Bartlett, Fraser, Hawkes, Holt, Townson and Wichert2001). Our theory is further substantiated by research in rice with an overexpressed GST (OsGSTL1) possessing GPOX activity, in which transgenic plants displayed enhanced herbicide tolerance (Hu et al. Reference Hu, Qv, Xiao and Huang2009). Moreover, some enzymes and proteins demonstrate multifunctional or “moonlighting” activities (Huberts and van der Klei Reference Huberts and van der Klei2010; Jeffery Reference Jeffery2014; Ke et al. Reference Ke, Yuan, Liu, Hui, Qin, Chen, Zhang, Li, Xiao, Zhang and Wang2020) that might also occur with certain A. tuberculatus GSTs. A multifunctional enzyme is somewhat analogous to a single gene conferring metabolic cross-resistance, or pleiotropic effect, to seemingly unrelated herbicide chemistries (Beckie and Tardif Reference Beckie and Tardif2012; Dyer Reference Dyer2018). However, it is not entirely congruous, as one of the two associated resistance traits in this case (meso-R) requires additional genes to confer whole-plant resistance.
A similar association of herbicide-resistance traits was previously reported in A. tuberculatus (Tranel et al. Reference Tranel, Wu and Sadeque2017), in which a possible genetic association between target site–mediated resistances to ALS- and PPO-inhibiting herbicides was investigated. However, unlike our current study, the genetic association of these resistance traits was attributed to an actual physical linkage of the two genes (195 kb apart) based on analysis of the cultivated grain amaranth (Amaranthus hypochondriacus L.) genome sequence (Tranel et al. Reference Tranel, Wu and Sadeque2017). Because the precise number and identity of meso-R genes in Amaranthus is currently unknown and an A. tuberculatus draft genome is not yet publicly available, research in the near future aimed at investigating potential physical linkages between metabolic atz-R and meso-R genes in A. tuberculatus or A. hypochondriacus must be based on probabilistic measures (Ott and Longnecker Reference Ott, Longnecker and Taylor2010), as opposed to molecular marker information. By contrast, a single P450 gene (Nsf1) controls tolerance to mesotrione, tembotrione, and several other POST herbicides in corn (Nordby et al. Reference Nordby, Williams, Pataky, Riechers and Lutz2008; Williams and Pataky Reference Williams and Pataky2010).
Summary and Management Implications
Our findings shed new light on the observations from several field populations of dioecious Amaranthus species in which mesotrione resistance has yet to be uncoupled from metabolic atz-R (Heap Reference Heap2020). Our genetic model postulates that qualitative atz-R is an essential component of the more quantitative nature of meso-R observed in A. tuberculatus, similar to proposed pathogen-resistance models in crops (Nelson et al. Reference Nelson, Wiesner-Hanks, Wisser and Balint-Kurti2018). Future research in our lab will be directed toward utilizing the AtuGSTF2 gene as an expressed marker to investigate whether meso-R plants selected from our existing F2 population exhibit elevated AtuGSTF2 transcript levels, as reported in our previous work with metabolic atz-R plants (Evans et al. Reference Evans, O’Brien, Ma, Hager, Riggins, Lambert and Riechers2017). Ultimately, to comprehensively understand the complex molecular–genetic mechanisms underlying these two associated metabolic resistance traits, additional crosses should be performed to generate more F1 and F2 populations from the MCR field population as well as from other HPPD inhibitor–resistant and metabolic atz-R Amaranthus populations. Following identification of the actual meso-R genes and release of a draft genome sequence, the chromosomal locations of the genetic loci containing these genes and the atz-R locus can be investigated within the A. tuberculatus genome.
The inability to uncouple these two metabolic resistance traits in the MCR-derived F2 population underscores the importance of incorporating integrated weed management systems that use herbicides with different biokinetic properties (i.e., diverse herbicide sites of action and detoxification pathways) in conjunction with nonchemical control measures. Many popular corn PRE herbicide mixtures contain atrazine and mesotrione (as well as other HPPD-inhibiting herbicides), so it is critical to further understand the association between mesotrione and atrazine metabolic resistances to aid in stewardship and reduce selection pressure for additional multiple-resistant A. tuberculatus populations. Although the synergistic interaction between atrazine and HPPD-inhibiting herbicides is frequently utilized for weed management in corn production systems (Abendroth et al. Reference Abendroth, Martin and Roeth2006; Woodyard et al. Reference Woodyard, Bollero and Riechers2009), different PSII inhibitors such as metribuzin (O’Brien et al. Reference O’Brien, Davis and Riechers2018) or bromoxynil could also be used to reduce the selection for metabolic atrazine resistance in Amaranthus.
Acknowledgments
We thank Lisa Gonzini, Charlie Mitsdarfer, and Doug Maxwell from the University of Illinois Herbicide Evaluation group for technical assistance and guidance, Brendan Jamison for assistance with greenhouse studies, Seth Strom for critically reviewing earlier versions of the article, and Brian Diers for advice regarding the genetics and inheritance of resistance traits in plants. No conflicts of interest have been declared. This research was partially supported by an undergraduate student research award from the Weed Science Society of America to KEJ.