1 Introduction
With the development of micro-electro-mechanical systems (MEMS) in the automotive, aerospace, biomedical, computer chip, chemical separation and food agricultural industries, there is a continuing interest in exploring microscale heat transfer and flow resistance. The effects of roughness are of particular interest, since it has been observed that roughness resulting from various fabrication processes, such as etching, micromachining or laser drilling, can lead to deviations in the pressure drop from the classical theoretical values for both laminar and turbulent microchannel flows (Wu & Little Reference Wu and Little1984; Papautsky et al. Reference Papautsky, Brazzle, Ameel and Bruno Frazier1999; Papautsky, Ameel & Bruno Frazier Reference Papautsky, Ameel and Bruno Frazier2001; Gamrat et al. Reference Gamrat, Favre-Marinet, Le Person, Baviere and Ayela2008; Kandlikar Reference Kandlikar2008). However, the existing results are often inconsistent and sometimes contradictory. For laminar flows, some researchers in the past found good agreement with conventional laminar theory for the pressure drop on smooth walls (Makihara, Sasakura & Nagayama Reference Makihara, Sasakura and Nagayama1993; Jiang et al. Reference Jiang, Zhou, Huang and Liu1997; Mala & Li Reference Mala and Li1999), but as expressed by Wagner & Kandlikar (Reference Wagner and Kandlikar2012) some others found larger values (Duncan & Peterson Reference Duncan and Peterson1994; Weilin, Mala & Li Reference Weilin, Mala and Li2000; Sobhan & Garimella Reference Sobhan and Garimella2001; Morini Reference Morini2004; Brackbill & Kandlikar Reference Brackbill and Kandlikar2007; Du & Li Reference Du and Li2009), while others found smaller values (Pfahler et al. Reference Pfahler, Harley, Bau and Zemel1990; Choi, Barron & Warrington Reference Choi, Barron and Warrington1991; Yu et al. Reference Yu, Warrington, Barron and Ameel1995).
The original work by Nikuradse (Reference Nikuradse1933) suggested that roughness has no effect on laminar flow pipe flow. However, Kandlikar et al. (Reference Kandlikar, Schmitt, Carrano and Taylor2005) and Kandlikar (Reference Kandlikar2005) identified large uncertainties in Nikurade’s data, and Brackbill & Kandlikar (Reference Brackbill and Kandlikar2007) subsequently showed experimentally that roughness effects in the laminar region are important and that they can be correlated well by replacing the nominal pipe diameter with the constricted flow diameter in the definition of the friction factor. Kandlikar et al. (Reference Kandlikar, Schmitt, Carrano and Taylor2005) had earlier used the concept of constricted diameter to construct a modified Moody diagram for pipe flow, employing a Reynolds number based on the constricted flow. In this diagram, a single line describes the laminar flow regime independent of roughness type, and for turbulent flow the friction factors become constant with increasing Reynolds numbers, as they do in the unmodified Moody diagram based on Nikuradse’s results. However, in the turbulent region, roughness values higher than 0.03 all collapse into a single line. The current consensus holds that even for laminar flow roughness leads to an increased friction factor (Hetsroni et al. Reference Hetsroni, Mosyak, Pogrebnyak and Yarin2005), but that the channel aspect ratio and roughness type and its geometric distribution are also important in determining the magnitude of the increase (Wu & Cheng Reference Wu and Cheng2003; Zhang, Chen & Shi Reference Zhang, Chen and Shi2010; Kharati-Koopaee & Zare Reference Kharati-Koopaee and Zare2015).
Such results have come from both experiment and computation. For example, Hu, Werner & Li (Reference Hu, Werner and Li2003) developed a three-dimensional finite-volume numerical model to simulate microchannel liquid flow over rectangular prism roughness elements. The results indicated that increasing the roughness height increased the pressure drag, which was exacerbated by the effects of blockage. Also, the increased surface area increased the local shear stress contribution; and the effects of pressure drag and skin friction drag decreased with increased spacing, mainly due to the decrease in the roughness element density. In this respect, we note the characteristics of so-called ‘
 $d$
-type’ roughness (Perry, Schofield & Joubert Reference Perry, Schofield and Joubert1969), typified by periodic two-dimensional elements of square cross-section placed transversely to the flow. In turbulent flow, when the spacing is small (
 $\unicode[STIX]{x1D706}/k<3$
, where
 $k$
is the height of each element and
 $\unicode[STIX]{x1D706}$
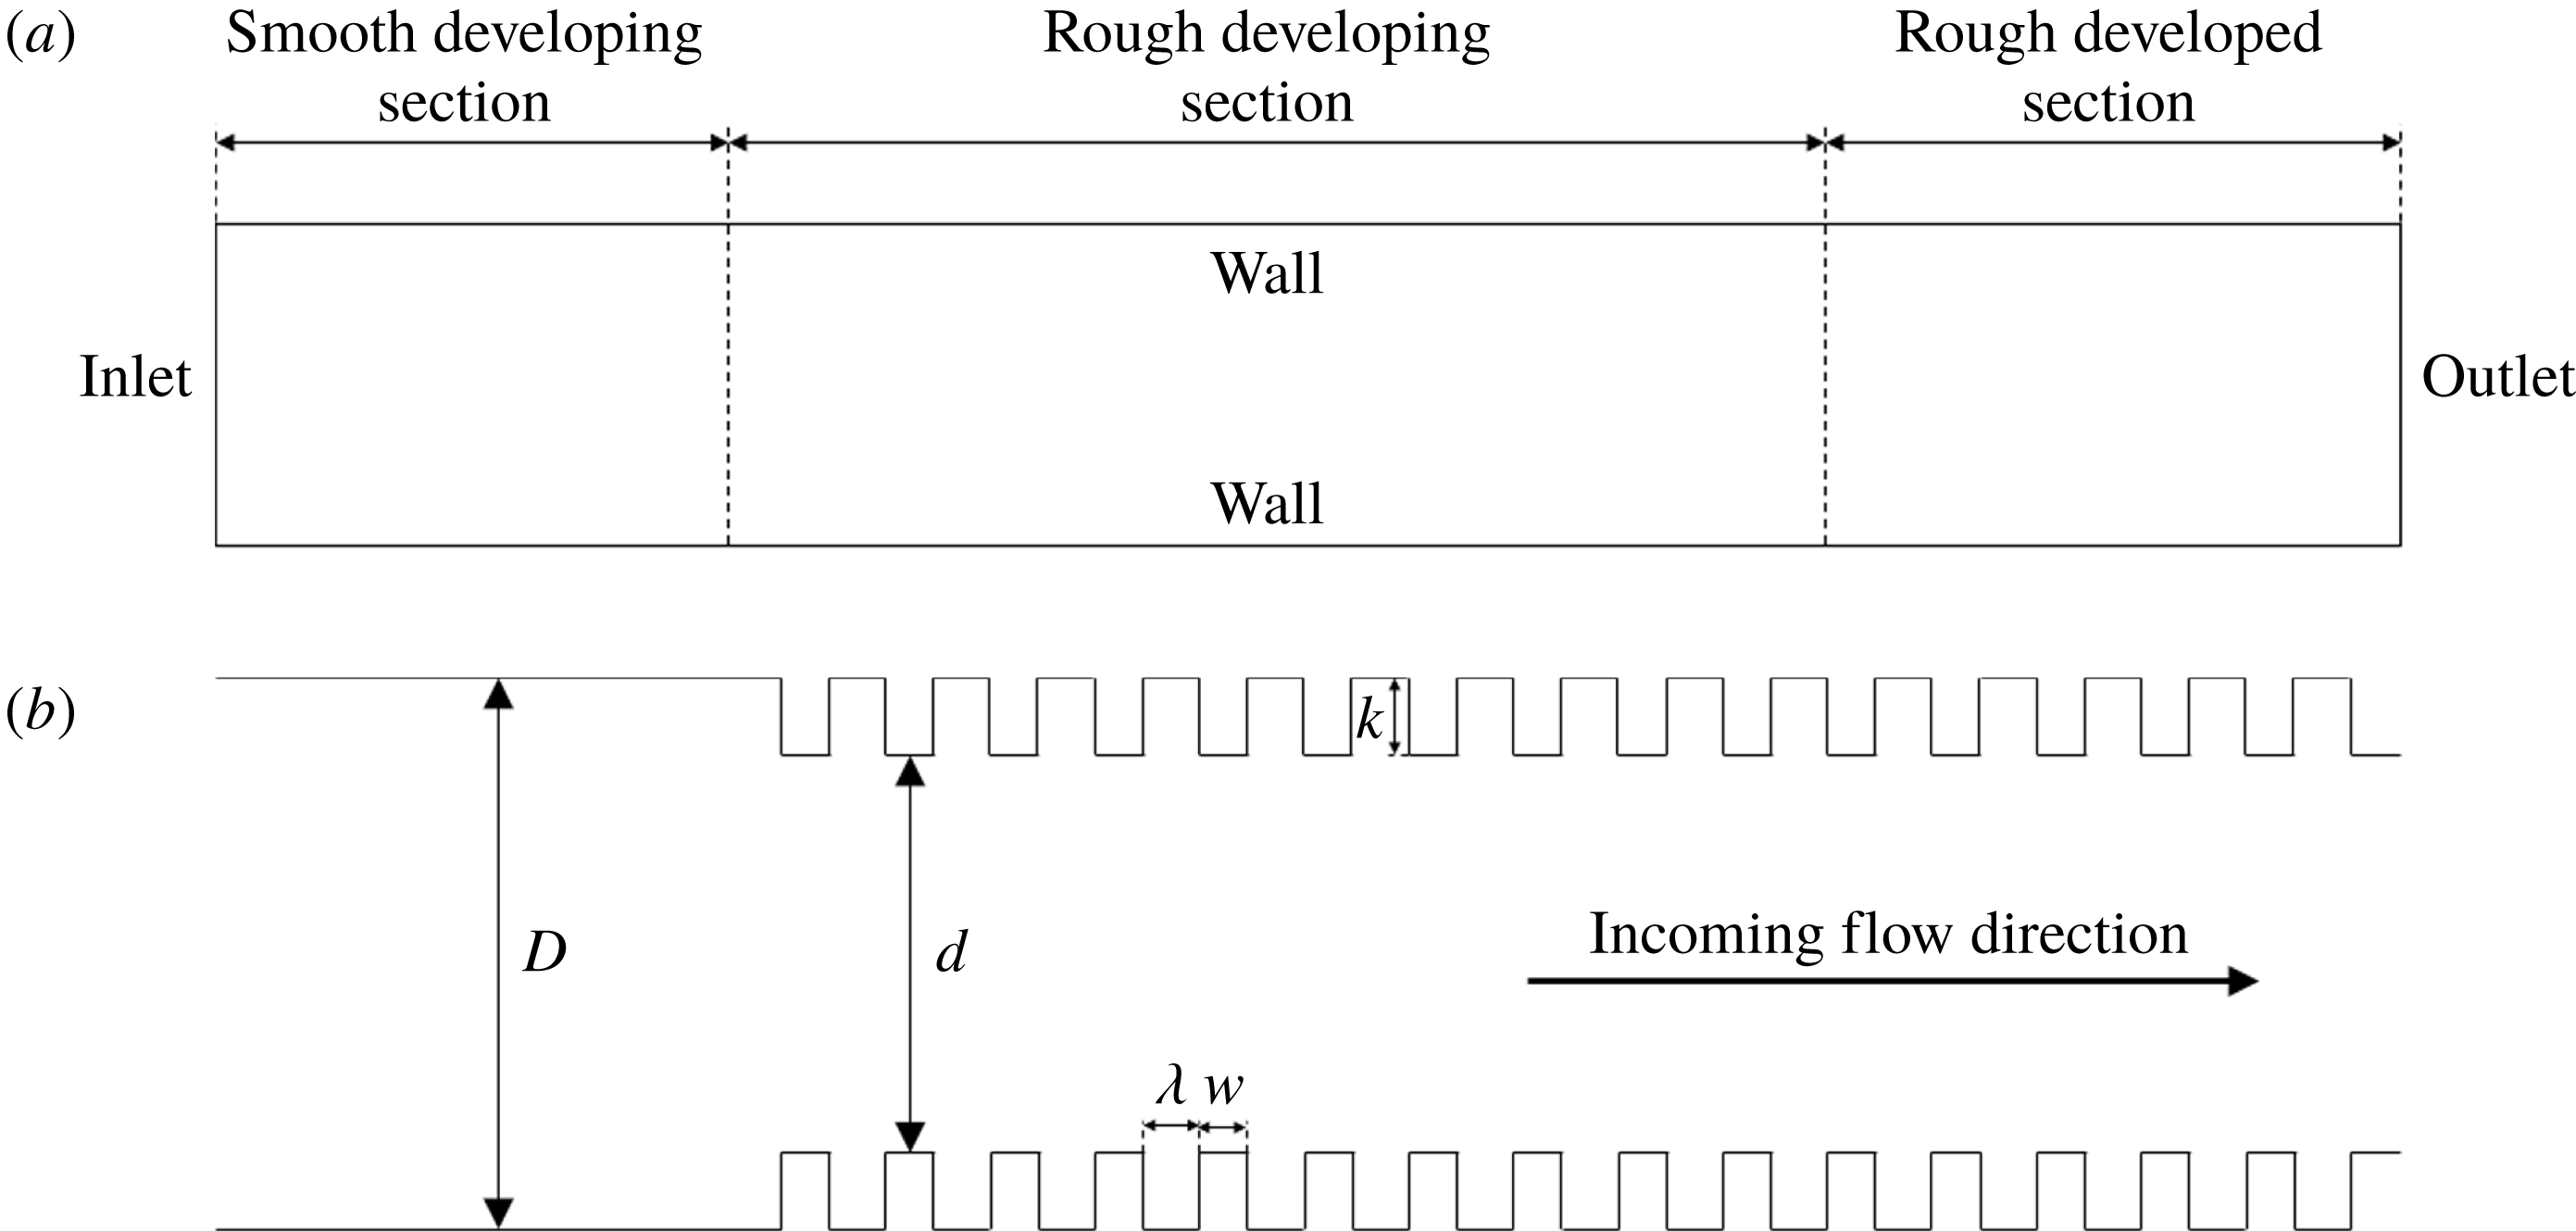
is the cavity width, see figure 1), the flow in the cavity is more or less isolated from the external flow, whereas for larger spacing the external flow communicates more strongly with the cavity flow. Perry et al. found that for the smaller spacing the effects of roughness scale on outer variables, which for a pipe or channel would be its diameter or height, hence the name
 $d$
-type roughness.
Computational domain: (a) overview; (b) close-up view.

In this context, Rawool, Mitra & Kandlikar (Reference Rawool, Mitra and Kandlikar2006) conducted numerical simulations to investigate the effect of the roughness height, geometry and Reynolds number on the friction factor in a serpentine microchannel. It was observed that the increase in friction factor was nonlinear with increasing height of obstruction. Because of the drag associated with the separated flow behind the roughness elements, the channel pressure drop was higher for smaller values of pitch (
 $\unicode[STIX]{x1D706}/k$
). The pressure drop correlation fell between the values corresponding to using the baseline diameter
 $D$
or the constricted diameter
 $d$
for all cases (see figure 1 for the nomenclature).
Wang, Yap & Mujumdar (Reference Wang, Yap and Mujumdar2005) computed the friction factors of single-phase microchannel flow with rectangular, triangular and elliptical roughness elements, and also found that the increased protrusion of the roughness elements produced more stagnant flow within the elements and thereby larger friction coefficients. Du & Li (Reference Du and Li2009) constructed a simplified three-dimensional roughness element model to study the effect of relative height, width and length of the roughness, as well as Reynolds number. The results indicated that the effects of roughness were important even for cases where the relative roughness height (
 $k/D$
) was less than 3 %. Zhang et al. (Reference Zhang, Chen and Shi2010) showed that the flow over semicircular and triangular roughness elements also induced stronger recirculation and flow separation with increasing roughness height, and Dharaiya & Kandlikar (Reference Dharaiya and Kandlikar2011) analysed numerically the thermal and hydrodynamic characteristics of microchannels in the presence of roughness elements, and reported an increase in pressure drop and heat transfer with roughness. Mohammadi & Floryan (Reference Mohammadi and Floryan2013) studied the drag generated by small periodic corrugations by numerical analysis, and found that for short-wavelength transverse grooves, the flow separated in the troughs and the main flow lifted above the grooves by a distance approximately equal to the groove amplitude. The results were almost entirely independent of Reynolds number. Finally, Wagner & Kandlikar (Reference Wagner and Kandlikar2012) found by experiment that the friction factor increased as the aspect ratio of the channel or the hydraulic diameter decreased, that is, when the relative roughness area increased for a given roughness profile. This tendency became more obvious for larger and more closely spaced roughness elements.
Here, we study the effects of roughness on the flow within a microchannel under laminar flow conditions, with the aim of elucidating more clearly the effects of height and spacing. Rectangular rib roughness is used and, in a departure from most previous work, the simulations include the region where the flow is adjusting to the introduction of roughness, in addition to the region where the flow is fully developed. Variations in height and spacing are investigated to understand more clearly the underlying physical mechanisms that cause the pressure drop to deviate from the smooth-wall theoretical value. These considerations lead us to propose scaling laws for the flow development length and the fully developed friction factor, which help to identify the relative effects of the roughness height and spacing. We also propose the concept of a fully rough laminar flow.
2 Numerical methods
The commercial computational fluid dynamics (CFD) software tool ANSYS/Fluent was used for all the results presented here. As shown in figure 1(a), the full computational domain consists of three parts: an initial smooth section (
 $0\leqslant x/D<20$
), and a rough section (
 $20\leqslant x/D\leqslant 95$
) which has a developing part and a fully developed part. The smooth section length was chosen so that the flow entering the rough region was fully developed parabolic laminar flow, with a pressure gradient that had become constant to better than 0.1 %. The FLUENT outflow boundary condition is employed on the outlet section.
Figure 1(b) shows the geometric parameters. Here,
 $d$
is the constricted diameter of the rough section, such that
 $d=D-2k$
. The width
 $w$
of the roughness elements was fixed so that
 $w=0.1D$
, while the roughness height
 $k$
and the cavity width
 $\unicode[STIX]{x1D706}$
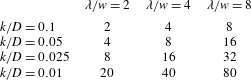
were varied to produce a wide range of flow cases. From table 1 we see that, by comparison with turbulent flow, only one case would qualify as
 $d$
-type roughness on the basis of its geometry (
 $k/D=0.1$
,
 $\unicode[STIX]{x1D706}/w=2$
,
 $\unicode[STIX]{x1D706}/k=2$
), and all other cases would qualify as
 $k$
-type roughness.
Experimental conditions, showing values of
 $\unicode[STIX]{x1D706}/k$
(
 $w/D=0.1$
, fixed).

A square, structured mesh was used for all cases. For
 $k/D>0.01$
, a grid interval of
 $0.01D$
was used, giving
 $4.8\times 10^{5}$
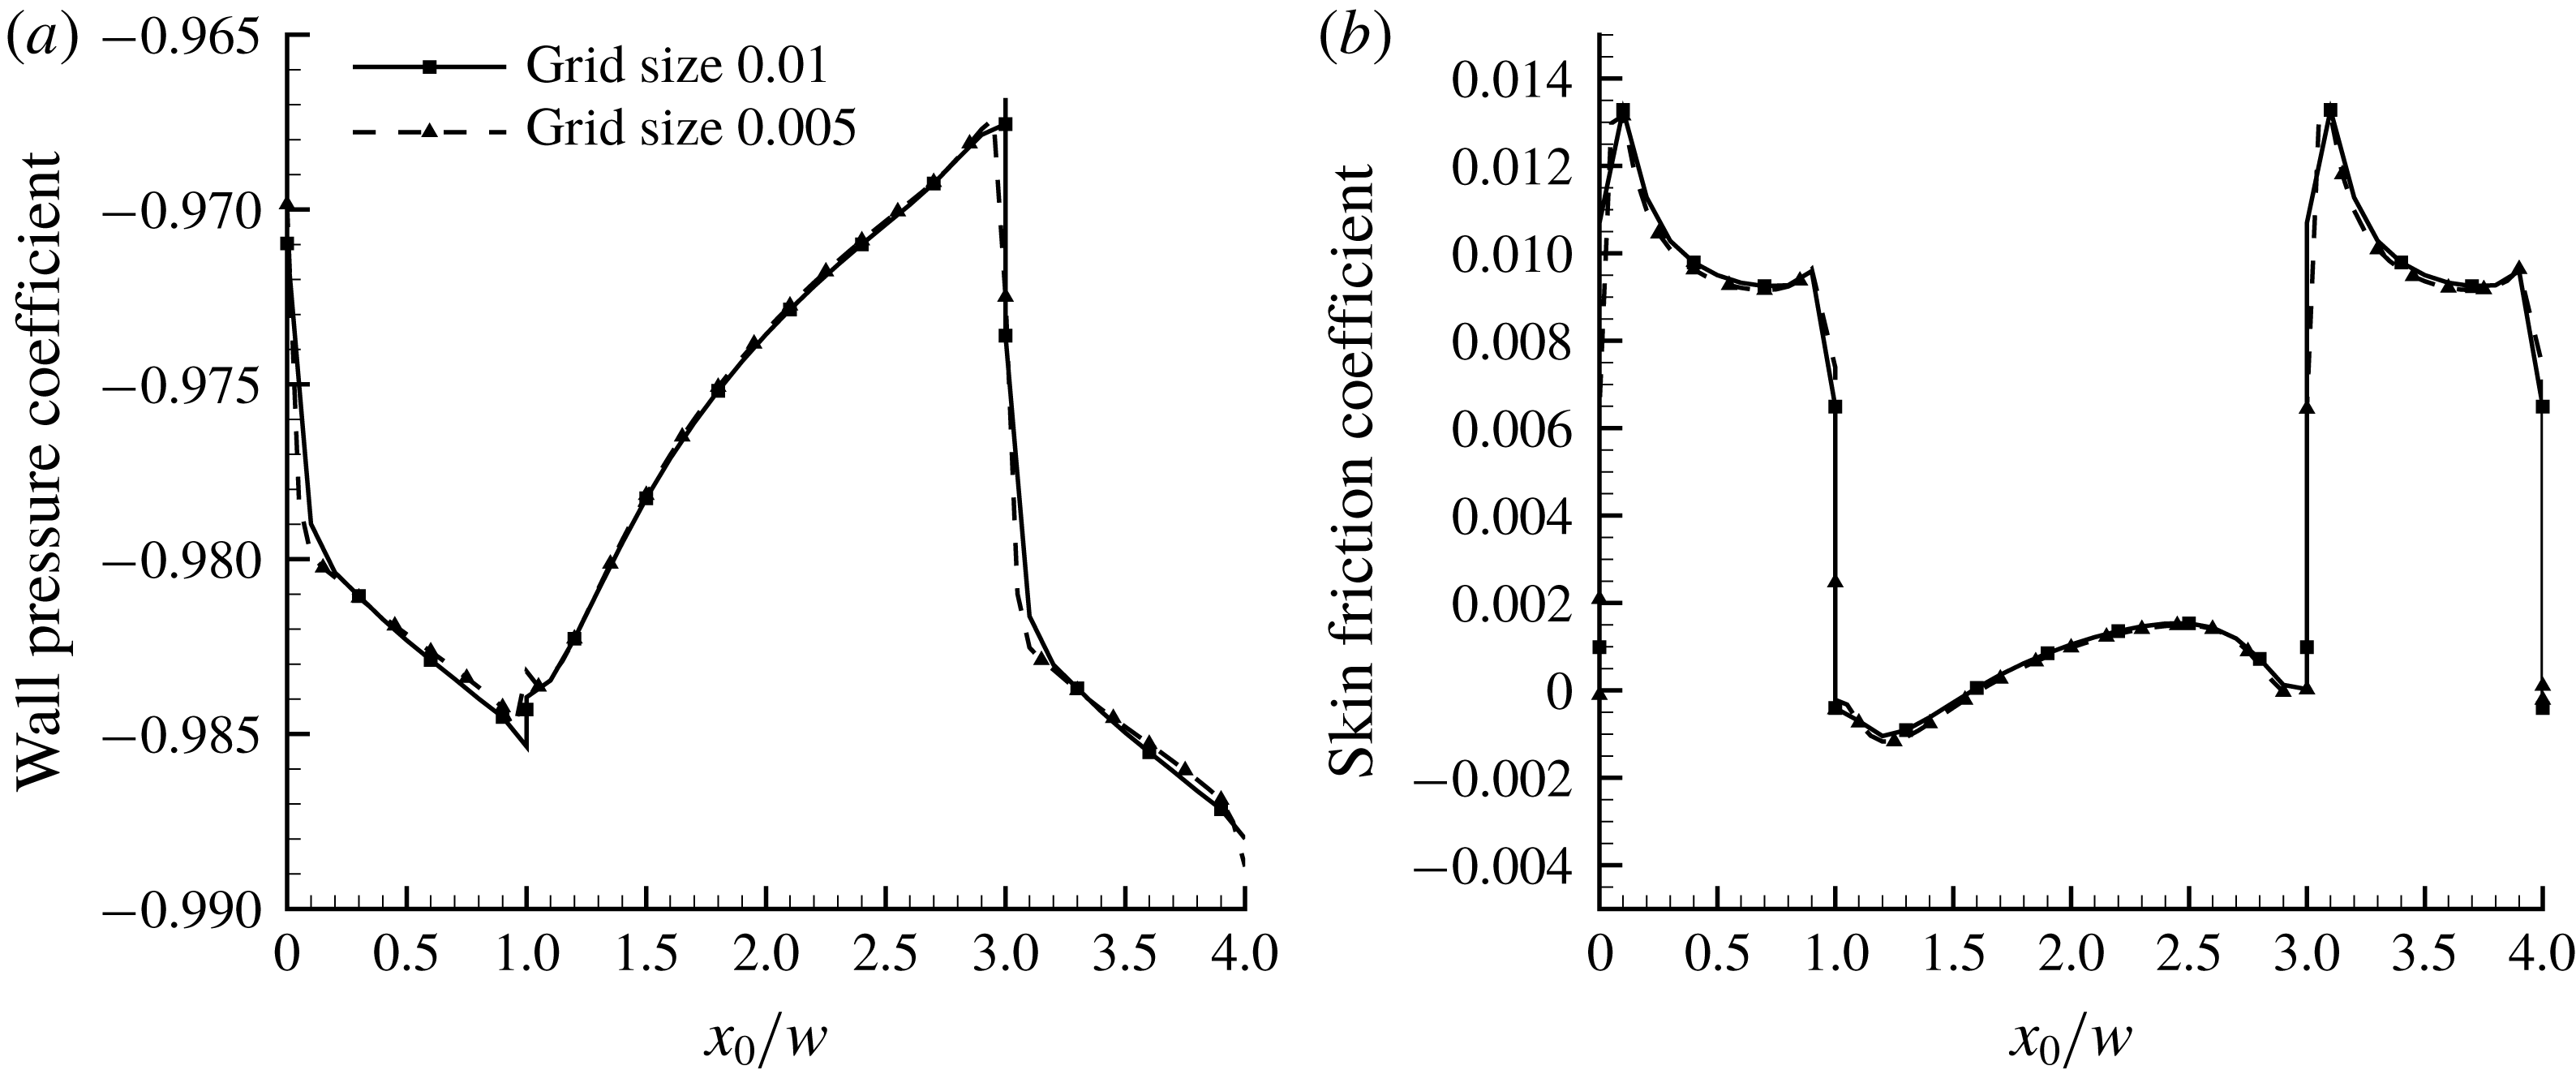
grid points in the full domain. Computations using grid sizes of
 $0.002D$
and
 $0.005D$
indicated that the results for
 $k/D>0.01$
were independent of grid density (see, for example, figure 2), but for
 $k/D=0.01$
the grid interval needed to be refined to
 $0.0025D$
before grid independence was achieved. The residual error in all cases was
 ${<}10^{-4}$
.
Effects of mesh refinement for the case where
 $k/D=0.025$
,
 $\unicode[STIX]{x1D706}/w=2$
. (a) Wall pressure distribution; (b) wall shear stress distribution. The skin friction and wall pressure coefficients are defined in § 5, and
 $x_{0}$
is defined such that
 $x_{0}=0$
at the upstream face of the roughness element.

Three values of Reynolds number
 $Re=VD/\unicode[STIX]{x1D708}$
were considered: 500, 1000 and 2000. Here
 $\unicode[STIX]{x1D708}$
is the fluid kinematic viscosity and
 $V$
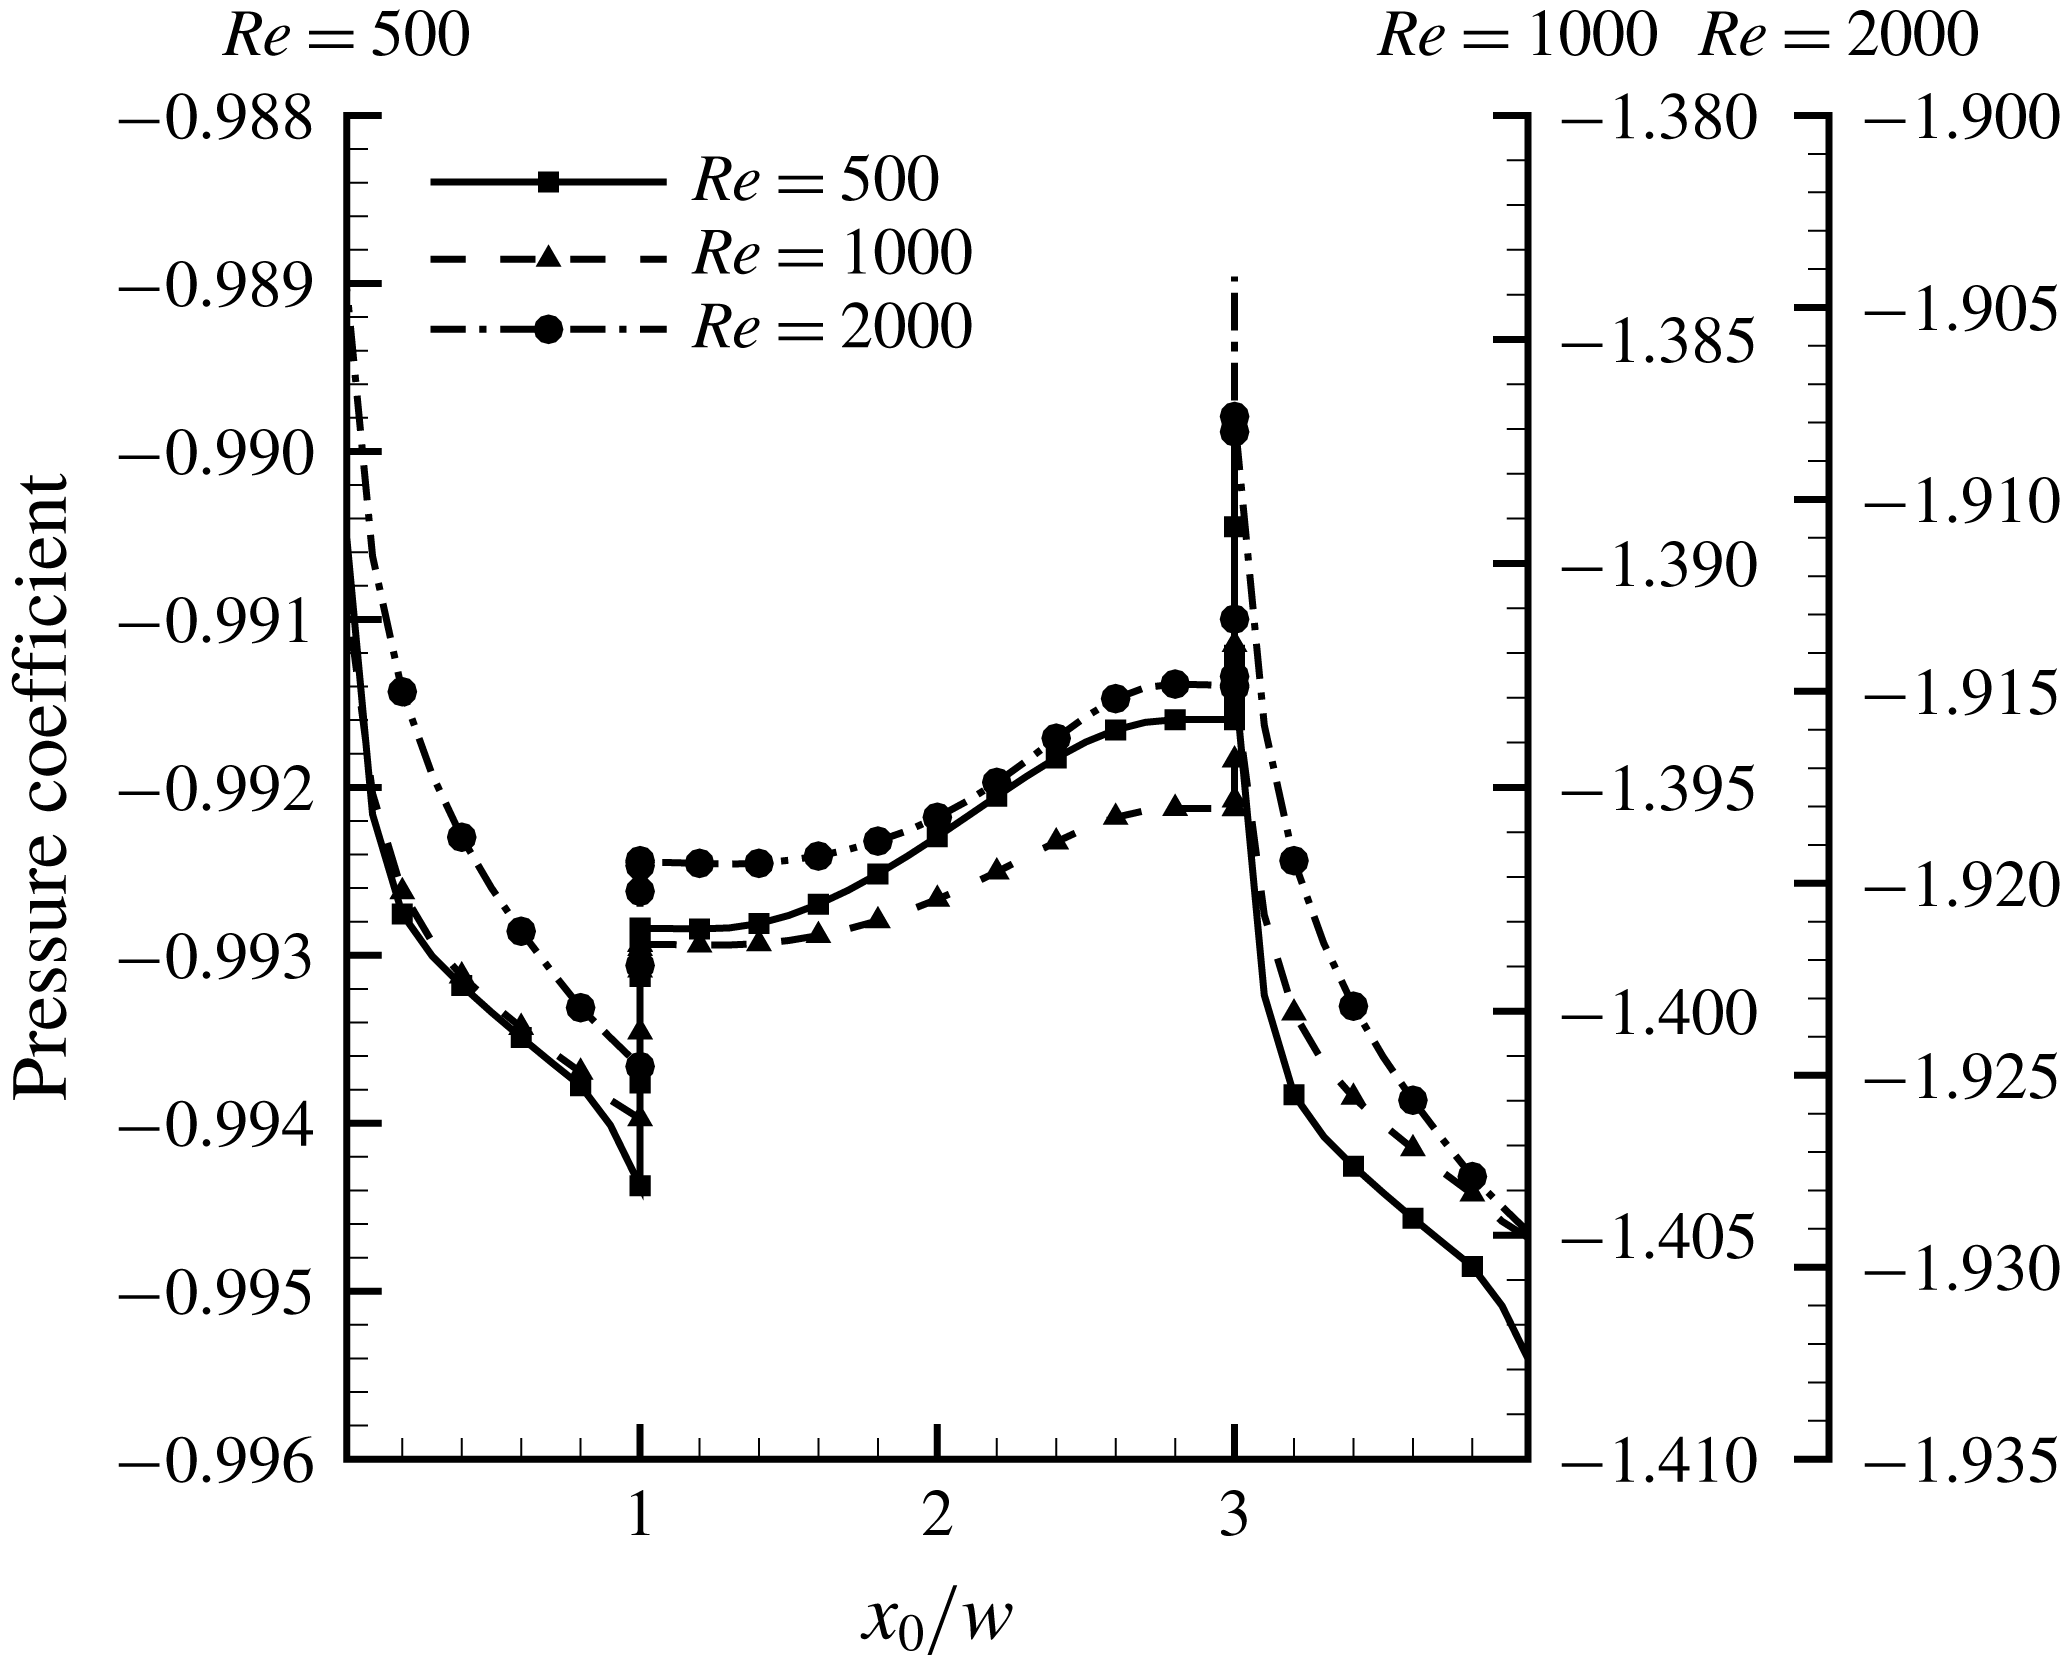
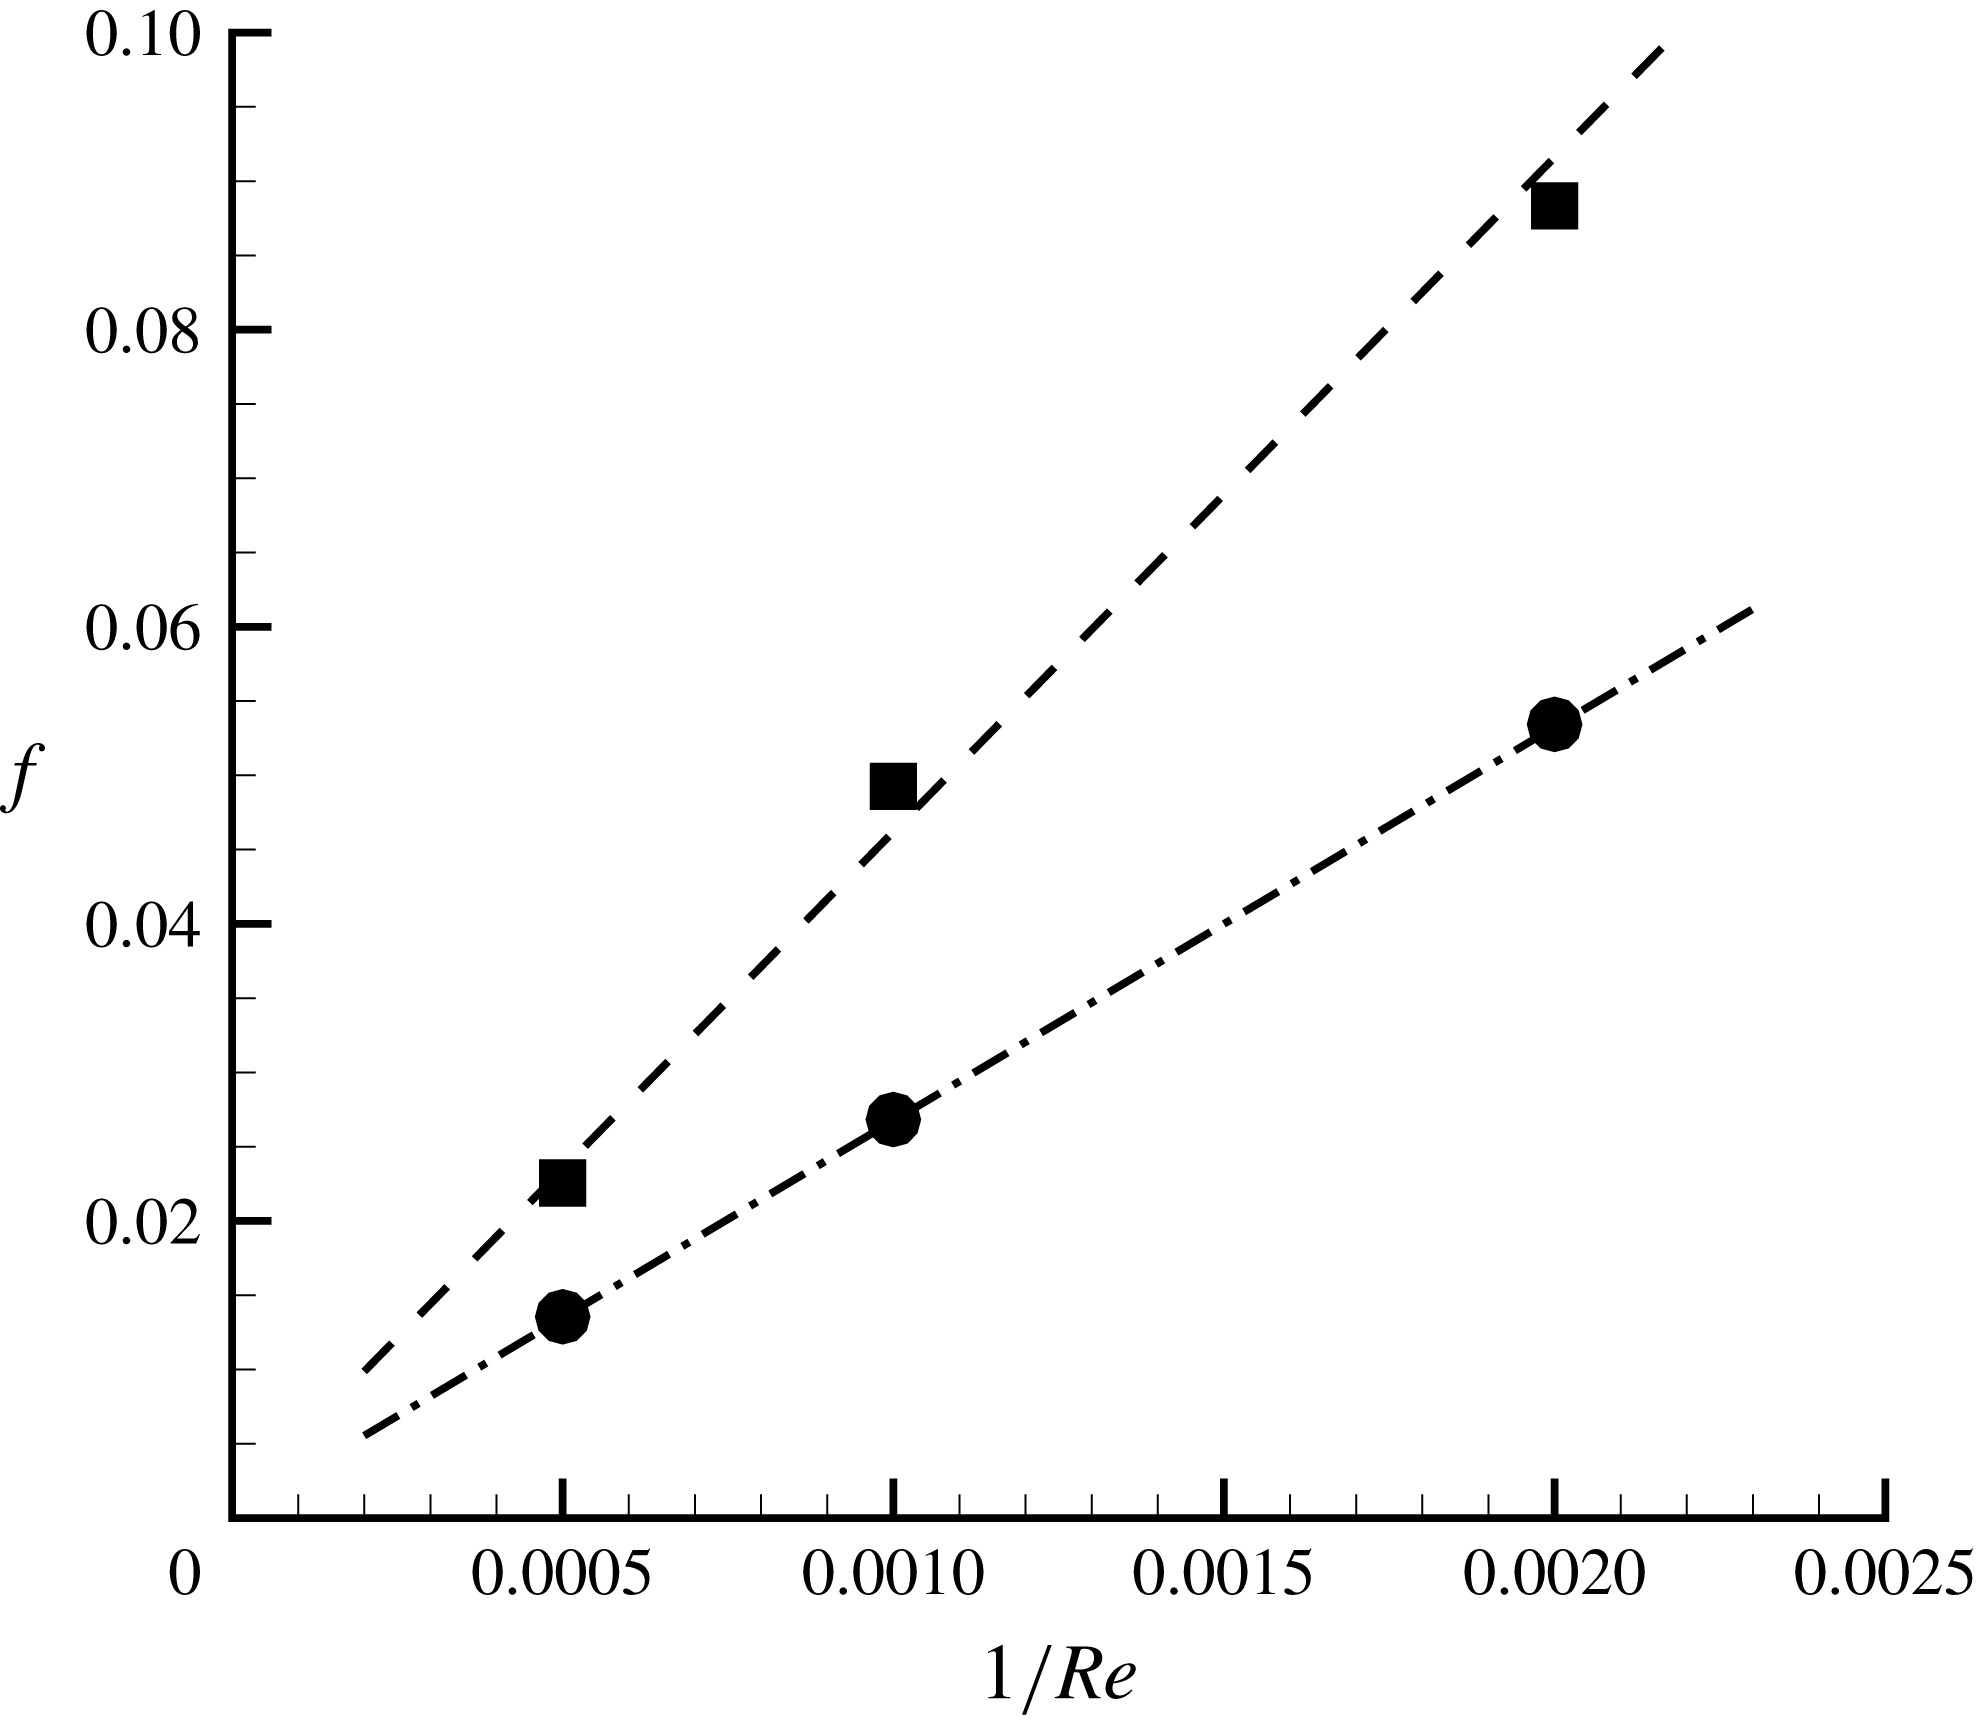
is the bulk velocity. Even at the highest Reynolds number, no transitional behaviour was observed. The results were Reynolds number dependent, as shown in figure 3 for the wall pressure coefficient, but the effects on the friction factors were rather straightforward. In a related paper, Sentürk & Smits (Reference Sentürk and Smits2019) investigated roughness effects in fully developed laminar pipe flow for square bar roughnesses similar to those studied here, and found that the friction factor was inversely proportional to the Reynolds number over their full range of roughness heights and spacings. To demonstrate that this dependence also holds in the context of fully developed channel flow, figure 4 shows the friction factor variation with Reynolds number for two particular cases (
 $\unicode[STIX]{x1D706}/w=2$
with
 $k/D=0.025$
and
 $k/D=0.1$
). Note that in the case of a channel flow, the constricted Reynolds number is the same as the unmodified Reynolds number because of continuity. The results indicate that the friction factors are indeed inversely proportional to the Reynolds number, as they would be for smooth wall laminar flow where we have
 $f=24/Re$
. Hence, all further results presented here will be restricted to a single Reynolds number of 2000.
Effect of Reynolds number on the wall pressure coefficient for
 $k/D=0.1$
,
 $\unicode[STIX]{x1D706}/w=2$
.

Effect of Reynolds number on the friction factor for
 $\unicode[STIX]{x1D706}/w=2$
. Lines are linear fits to the data: ●,
 $k/D=0.025$
; ▪,
 $k/D=0.1$
.

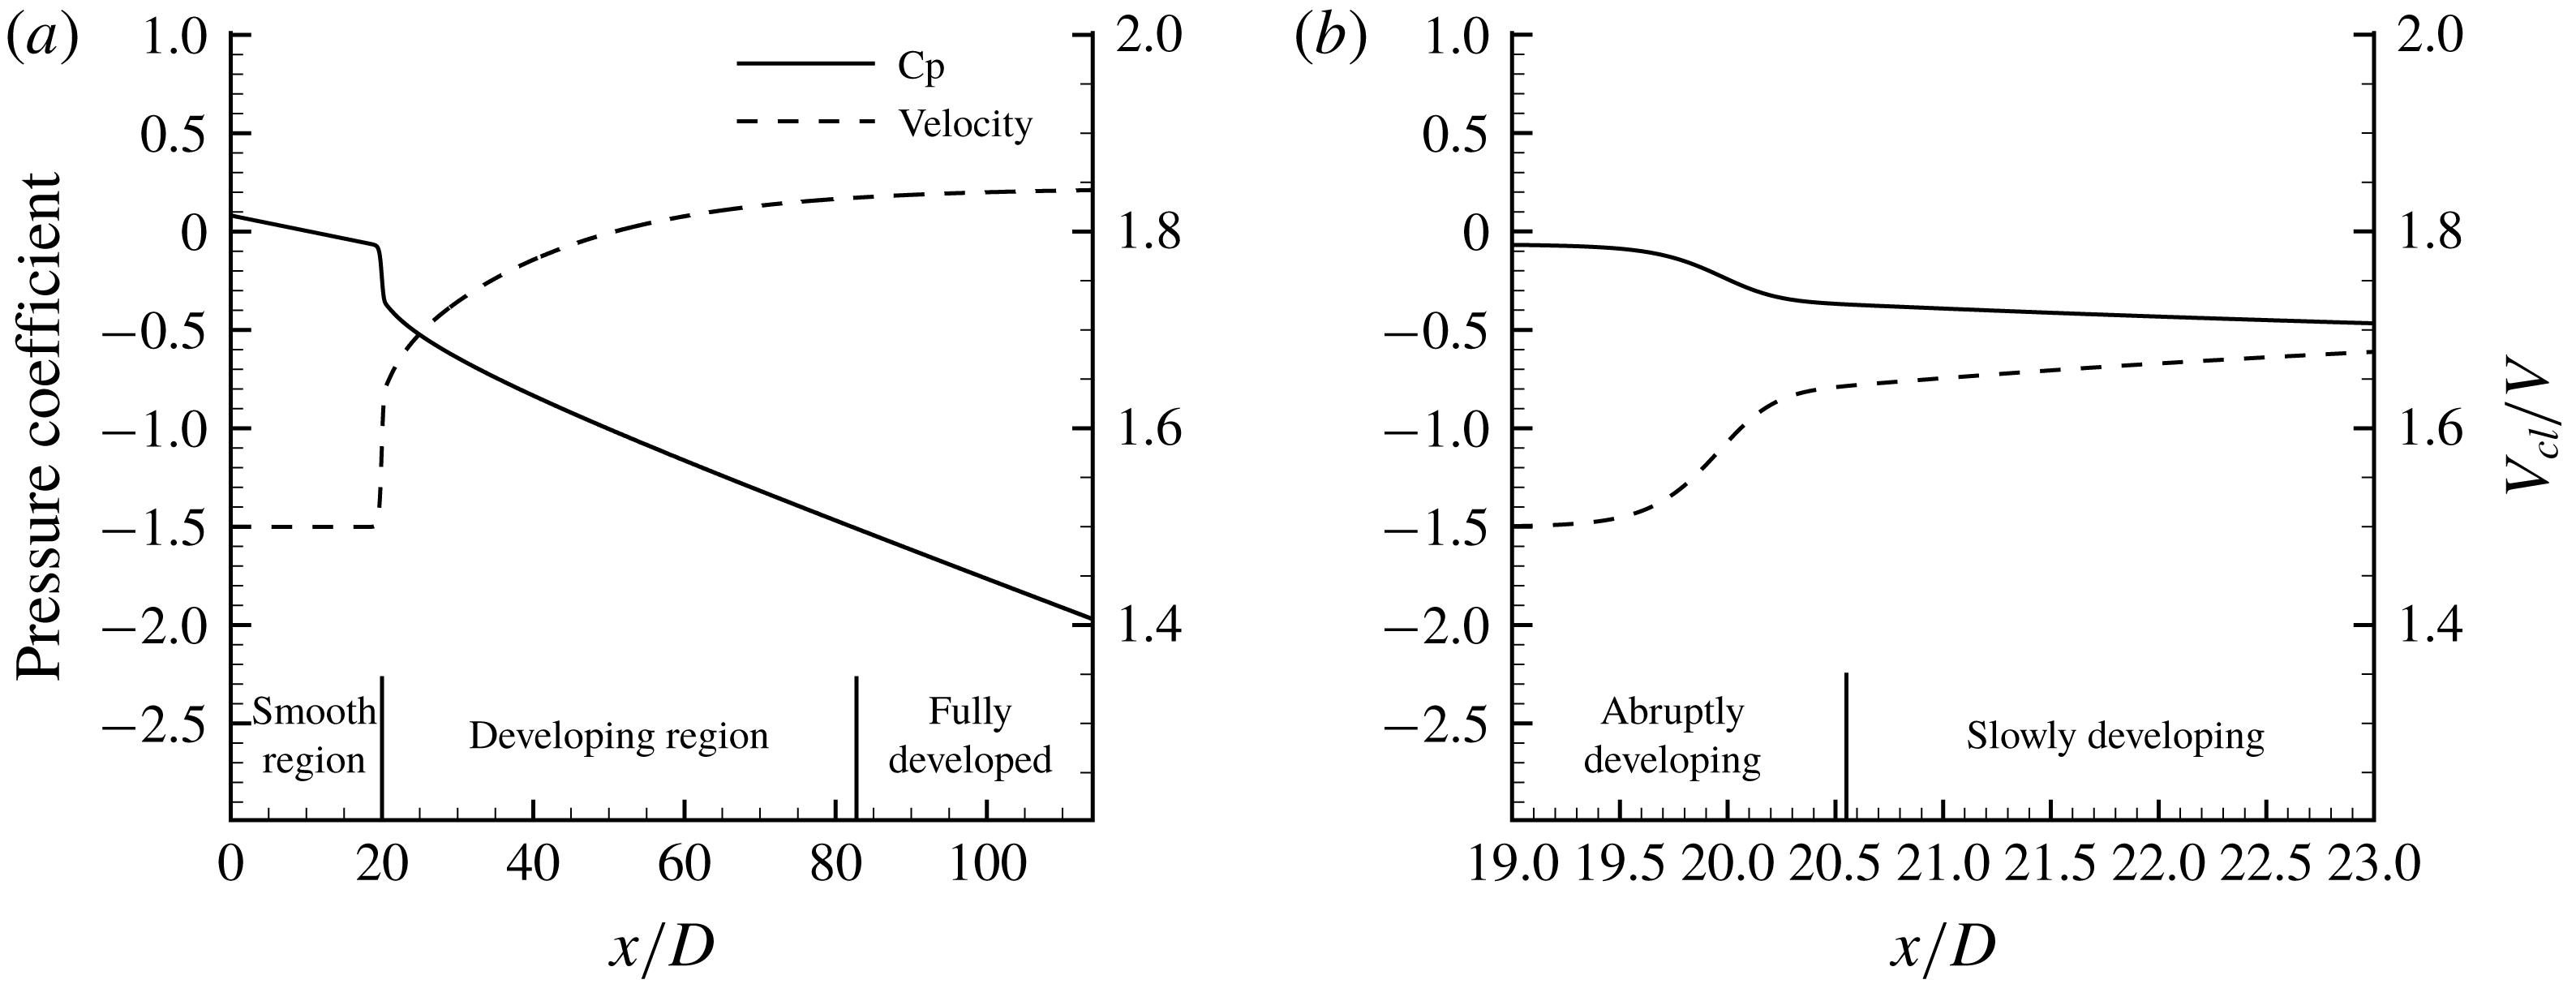
Distributions of pressure and centreline velocity along the channel for
 $\unicode[STIX]{x1D706}/w=2$
and
 $k/D=0.1$
. (a) Overall development. (b) Enlarged view.

3 Flow development behaviour
Figure 5 shows the distributions of flow velocity and pressure along the centreline for
 $\unicode[STIX]{x1D706}/w=2$
and
 $k/D=0.1$
. We see that there is an abrupt initial response to the roughness over a distance of about one channel height, and then the flow asymptotically approaches the fully developed condition. We will assume the flow to be fully developed when the pressure gradient along the centreline of the channel is constant to within 1 % (reducing the threshold to 0.1 % did not appreciably change our conclusions). The development distances
 $L_{d}$
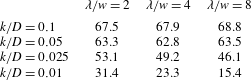
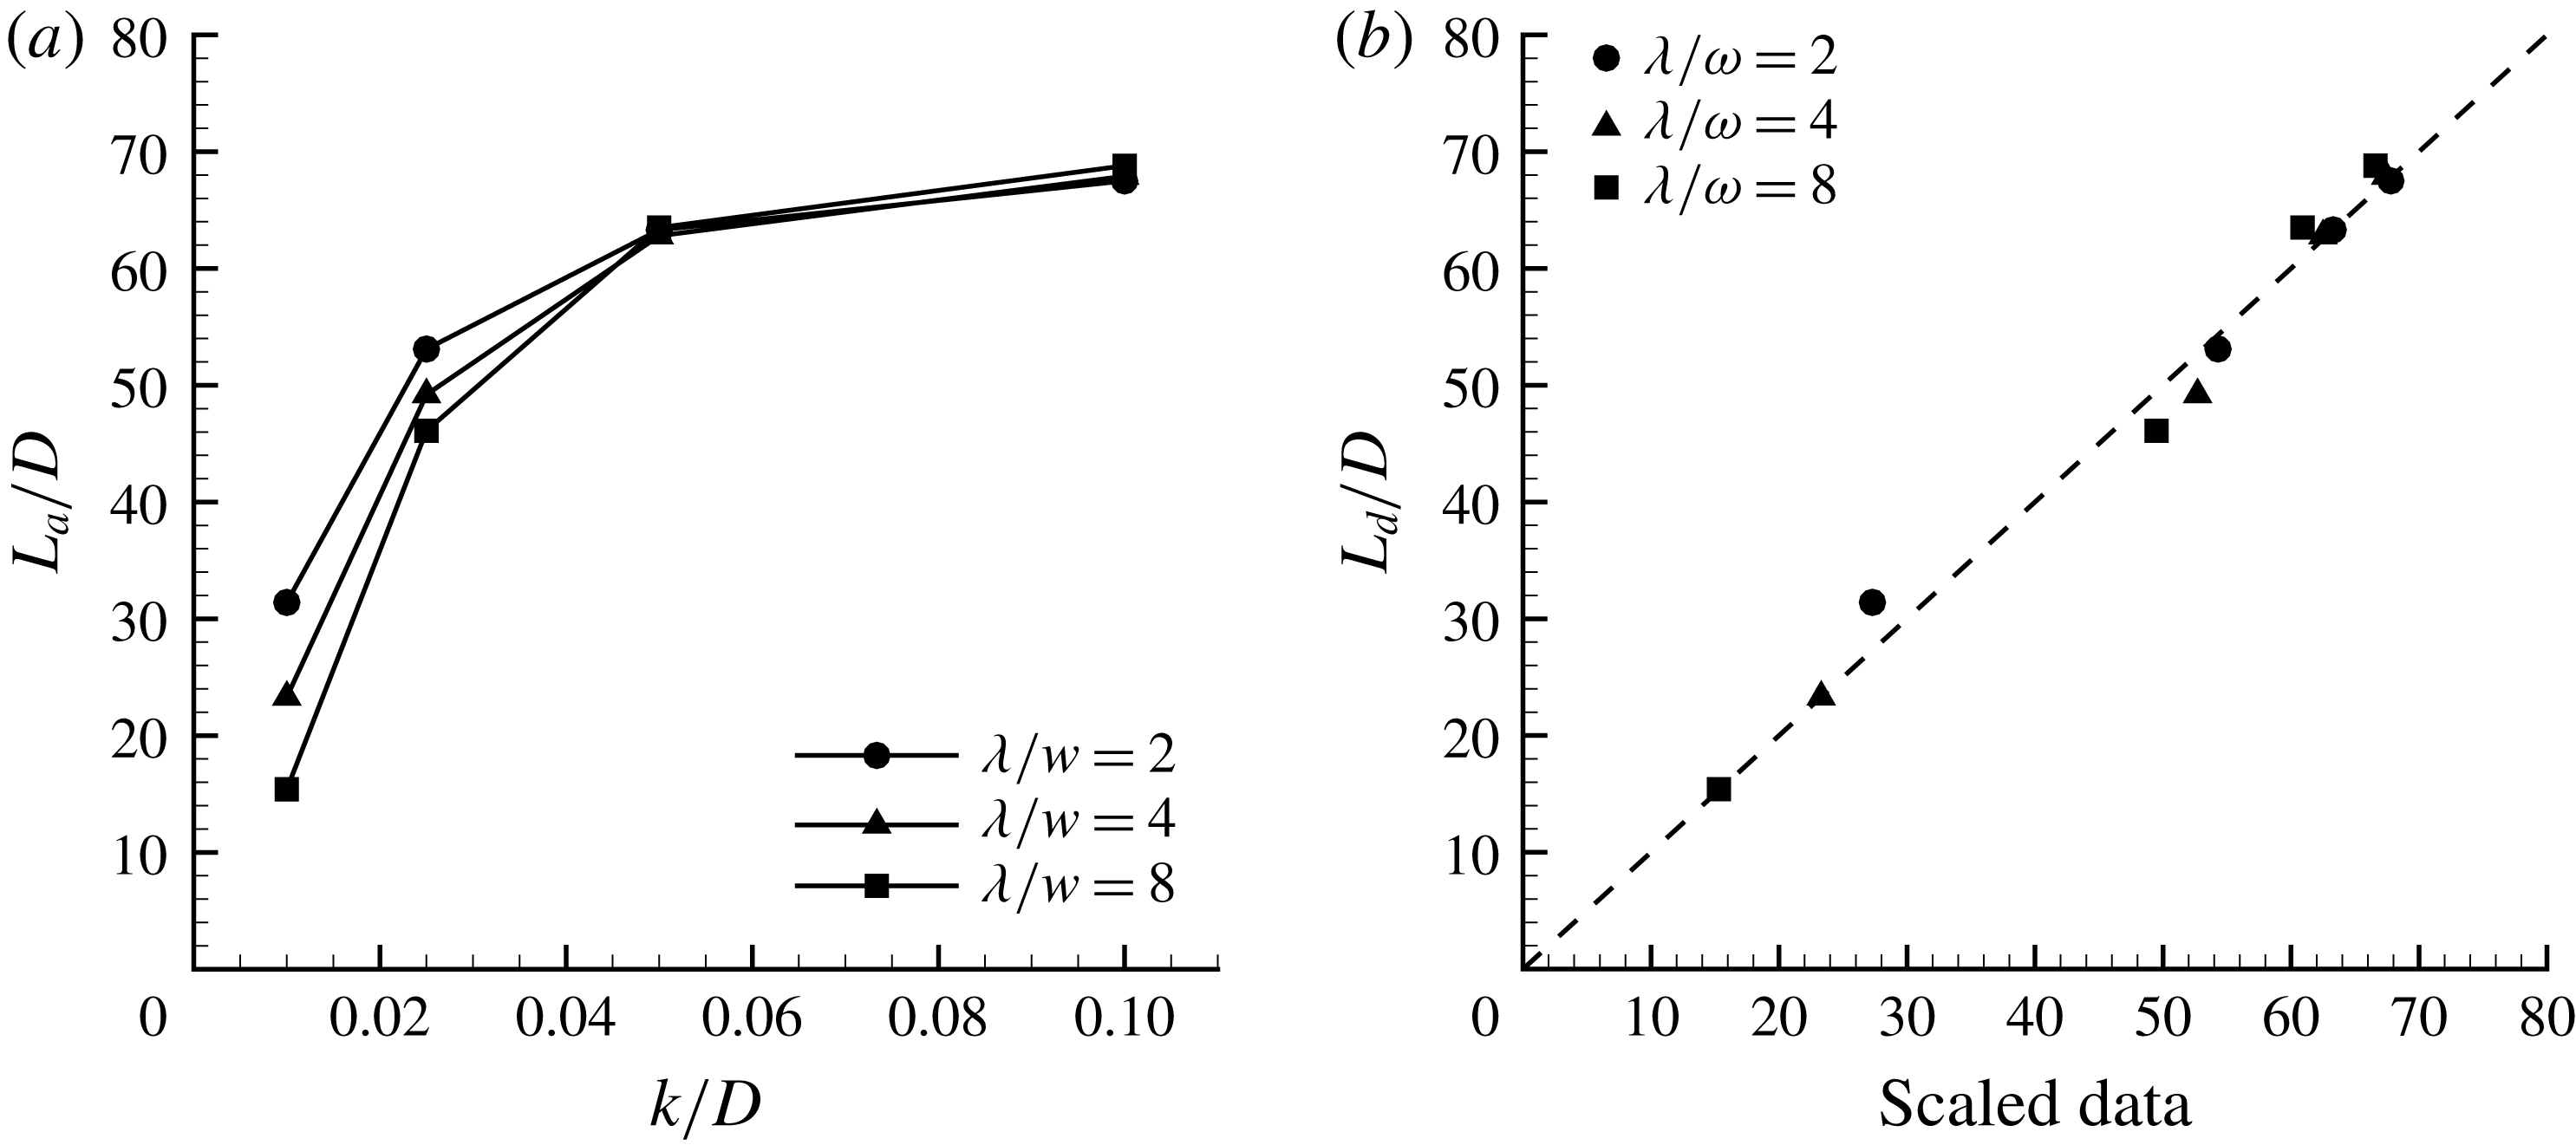
determined in this way are shown in table 2 and figure 6(a). We see that
 $L_{d}/D$
varies from 15.4 to 68.8 for the range of roughness heights and pitch explored here, but for the largest roughness height (
 $k/D=0.1$
) it is almost independent of
 $k$
and
 $\unicode[STIX]{x1D706}$
, while for
 $k/D\leqslant 0.05$
the height and pitch play an increasingly important role.
Length of developing region,
 $L_{d}/D$
.

These trends are captured by a simple correlation with roughness height and pitch according to
 $$\begin{eqnarray}\frac{L_{d}}{D}=a-\frac{b}{k/D}-c_{1}\frac{\unicode[STIX]{x1D706}}{k},\end{eqnarray}$$
as seen in figure 6(b). The constants
 $a=72.4$
,
 $b=0.41$
and
 $c_{1}=0.2$
are fitting parameters obtained by ordinary least squares, and with these values the mean square error is 2.1. The correlation evidently holds well even for
 $k/D=0.01$
, although it cannot continue to hold for very small values of
 $k/D$
since that would lead to negative development lengths.
Equation (3.1) is a function of two scaling parameters,
 $k/D$
and
 $\unicode[STIX]{x1D706}/k$
. We will address the significance of these parameters in more detail once we have examined the flow behaviour in the vicinity of the roughness elements, but we note here that
 $k/D$
can be identified broadly with the pressure losses (form drag) and
 $\unicode[STIX]{x1D706}/k$
with the viscous drag. Equation (3.1) can then be interpreted as indicating that for large roughness heights the form drag dominates, whereas for small roughness heights the viscous drag component becomes increasingly important.
Length of developing region,
 $L_{d}/D$
. (a) Variation with roughness height,
 $k/D$
. (b) Data scaled according to (3.1) (
 $a=72$
,
 $b=0.37$
,
 $c_{1}=0.26$
). ●,
 $\unicode[STIX]{x1D706}/w=2$
; ▵,
 $\unicode[STIX]{x1D706}/w=4$
; ▫,
 $\unicode[STIX]{x1D706}/w=8$
.

4 Fully developed region
The fully developed regime corresponds to the region where
 $x\geqslant L_{d}$
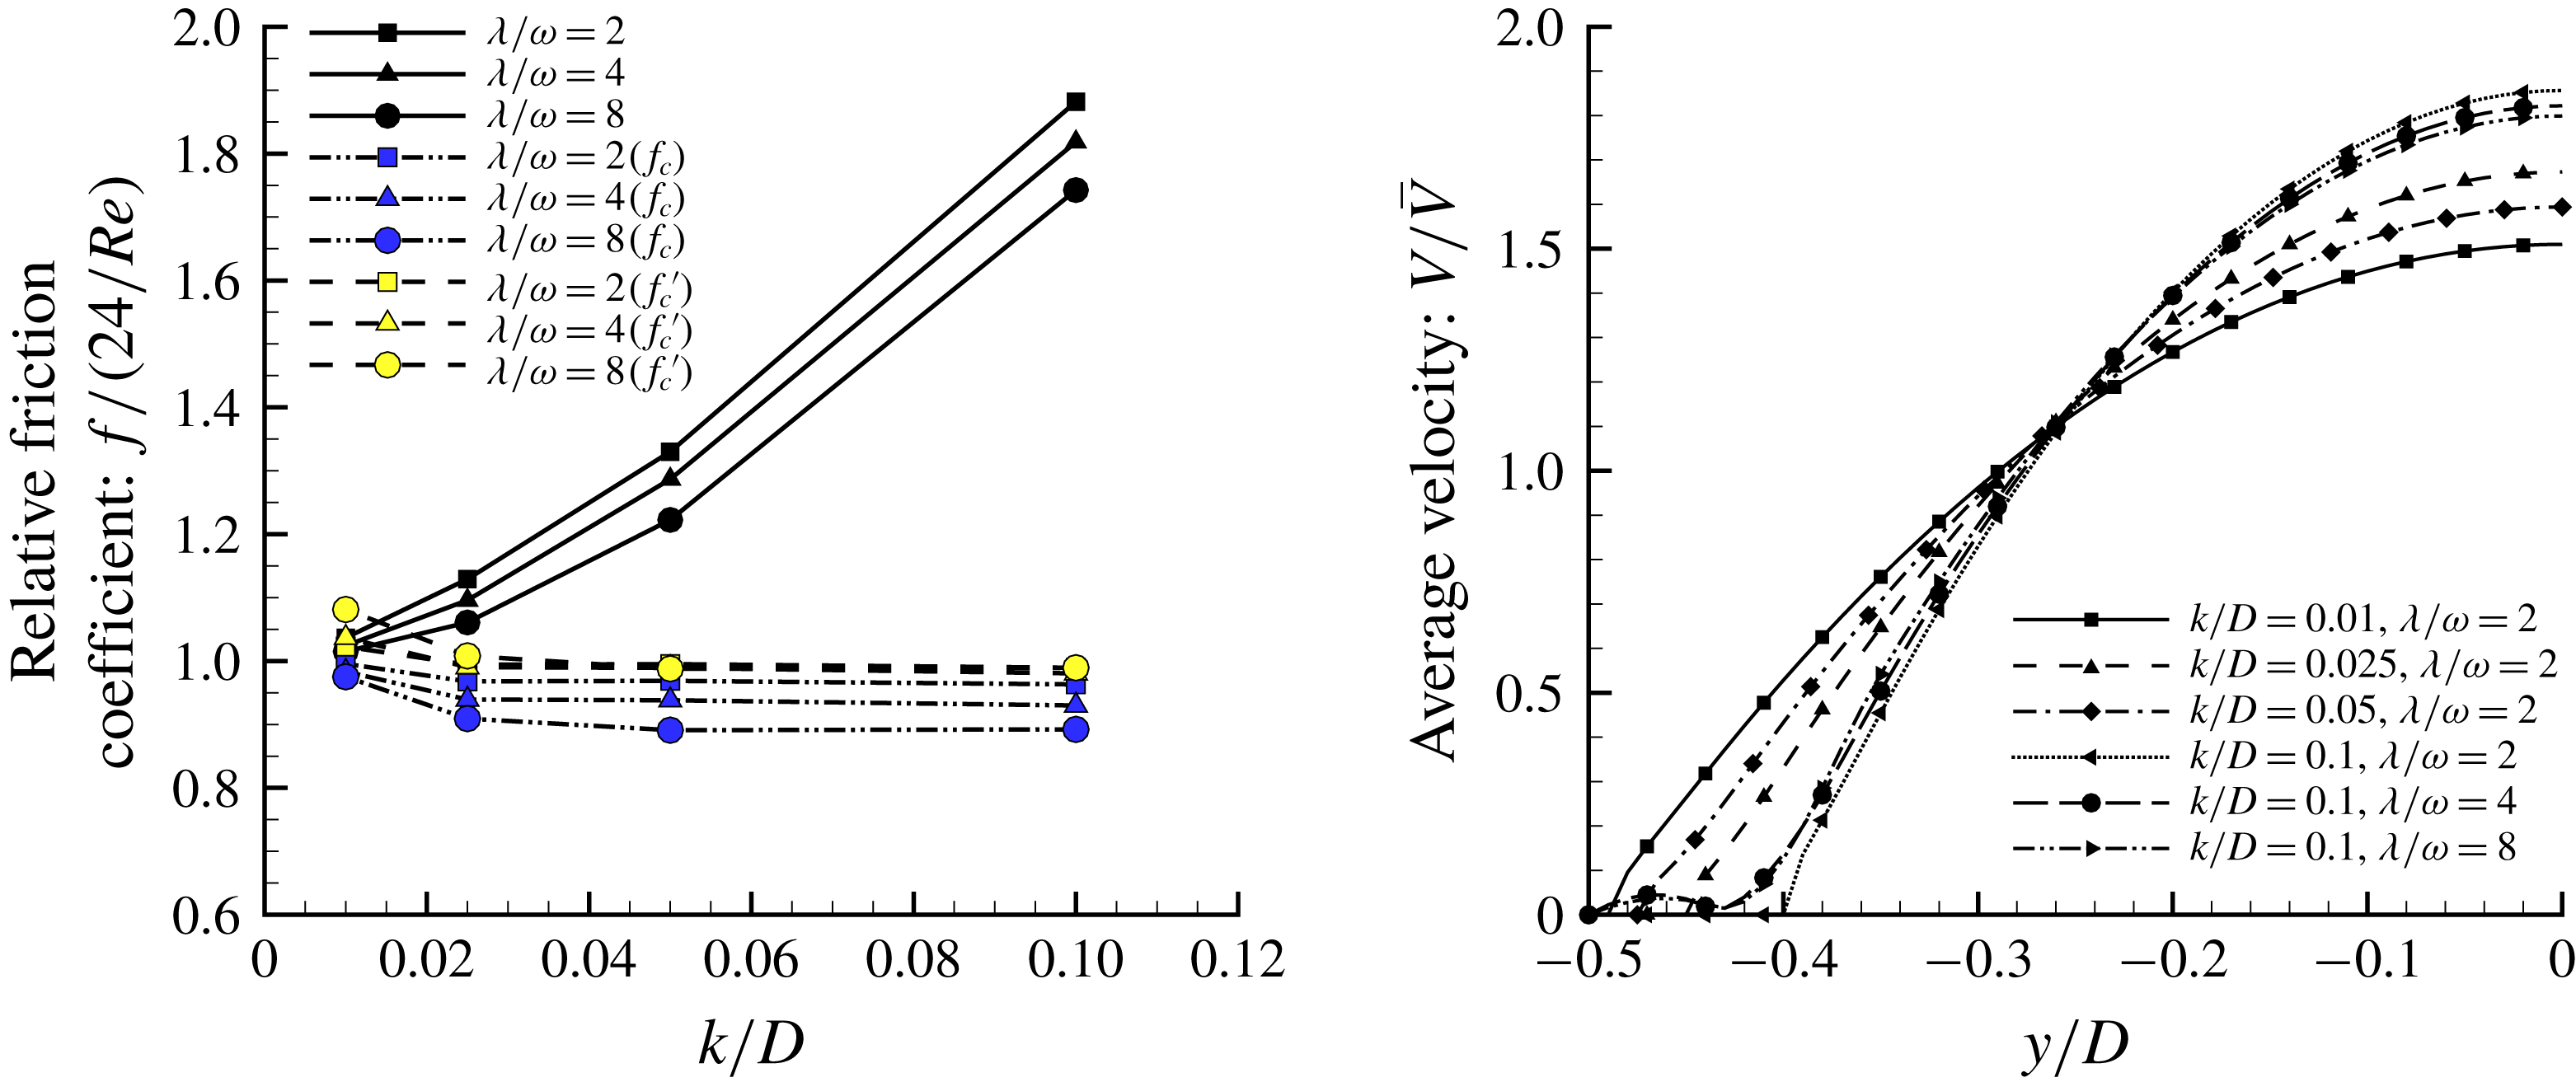
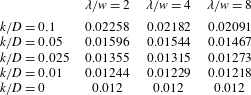
(see table 2). Table 3 and figure 7(a) show the variations in the friction coefficients in this region as a function of the roughness parameters
 $k/D$
and
 $\unicode[STIX]{x1D706}/w$
. The friction factor
 $f$
for fully developed flow is defined by
 $$\begin{eqnarray}f=\frac{\unicode[STIX]{x0394}p(D/L)}{{\textstyle \frac{1}{2}}\unicode[STIX]{x1D70C}V^{2}},\end{eqnarray}$$
where
 $\unicode[STIX]{x0394}p$
is the pressure drop over the distance
 $L$
and
 $\unicode[STIX]{x1D70C}$
is the density of the fluid. For laminar flow in a smooth channel, we expect
 $f=24/Re$
. Following Kandlikar et al. (Reference Kandlikar, Schmitt, Carrano and Taylor2005), we can also define a constricted friction factor
 $f_{c}$
for the fully developed rough wall region according to
 $$\begin{eqnarray}f_{c}=\frac{\unicode[STIX]{x0394}p(d/L)}{{\textstyle \frac{1}{2}}\unicode[STIX]{x1D70C}V^{\prime 2}},\end{eqnarray}$$
where we use the constricted channel height
 $d=D-2k$
instead of
 $D$
. Note that by mass conservation
 $V^{\prime }=VD/d$
, and
 $f_{c}$
can be written as
 $$\begin{eqnarray}f_{c}=f\left(\frac{d}{D}\right)^{3}=f\left(1-\frac{2k}{D}\right)^{3}.\end{eqnarray}$$
Table 3 and figure 7(a) show that the friction coefficient
 $f$
in the presence of roughness is always larger than the smooth wall laminar flow value at this Reynolds number (
 $f=24/Re=0.012$
), by a factor of 1.88 for the most extreme case. The effect of the roughness height
 $k/D$
dominates, while the dependence on pitch is relatively weak.


Friction coefficients,
 $f$
.

The behaviour of the constricted friction coefficients
 $f_{c}$
is also shown in figure 7(a). This form of the friction factor collapses the data to within about 10 % of the smooth wall value, although the effects of spacing continue to have a small influence. The success of
 $f_{c}$
in representing the data is attributable to the change in the velocity profile due the presence of the roughness. The average velocity distributions (as computed over a single roughness cell) are shown in figure 7(b). Within the roughness elements there is little mean streamwise flow, and so as the roughness height increases the centreline velocity increases. For any given roughness height, therefore, the average velocity profile closely resembles fully developed flow through a channel of height
 $D-2k$
, that is,
 $D(1-2k/D)$
, which highlights the role of the roughness height in changing the friction coefficient, as already illustrated by the form of
 $f_{c}$
given by (4.3).
Compared to the effect of the roughness height, the effect of pitch is relatively small. An empirical (linear) correction for the spacing is given by
 $$\begin{eqnarray}f_{c}^{\prime }=f_{c}\left(1+c_{2}\frac{\unicode[STIX]{x1D706}}{w}\right),\end{eqnarray}$$
and figure 7(a) shows that this correction (with
 $c_{2}=0.0136$
) leads to an almost perfect collapse of the data, and for
 $k/D>0.01$
it gathers the data to within about 2 % of the smooth wall value.
We can rewrite (4.4) as
 $$\begin{eqnarray}f_{c}^{\prime }=f\left(1-\frac{2k}{D}\right)^{3}\left(1+c_{2}\frac{\unicode[STIX]{x1D706}}{w}\right).\end{eqnarray}$$
The correlation for the friction factor is therefore in terms of
 $k/D$
and
 $\unicode[STIX]{x1D706}/w$
, and it does not include
 $\unicode[STIX]{x1D706}/k$
. So it seems that a full description of the effects of transverse roughness elements on laminar flow (development length, equation (3.1), and fully developed friction factor, equation (4.5)), needs three parameters:
 $k/D$
,
 $\unicode[STIX]{x1D706}/k$
, and
 $\unicode[STIX]{x1D706}/w$
. However,
 $\unicode[STIX]{x1D706}/w$
is not an independent parameter since
 $\unicode[STIX]{x1D706}/w=10(\unicode[STIX]{x1D706}/k)(k/D)$
. Hence we need only two parameters:
 $k/D$
and
 $\unicode[STIX]{x1D706}/k$
.
5 Flow characteristics in the vicinity of the roughness elements
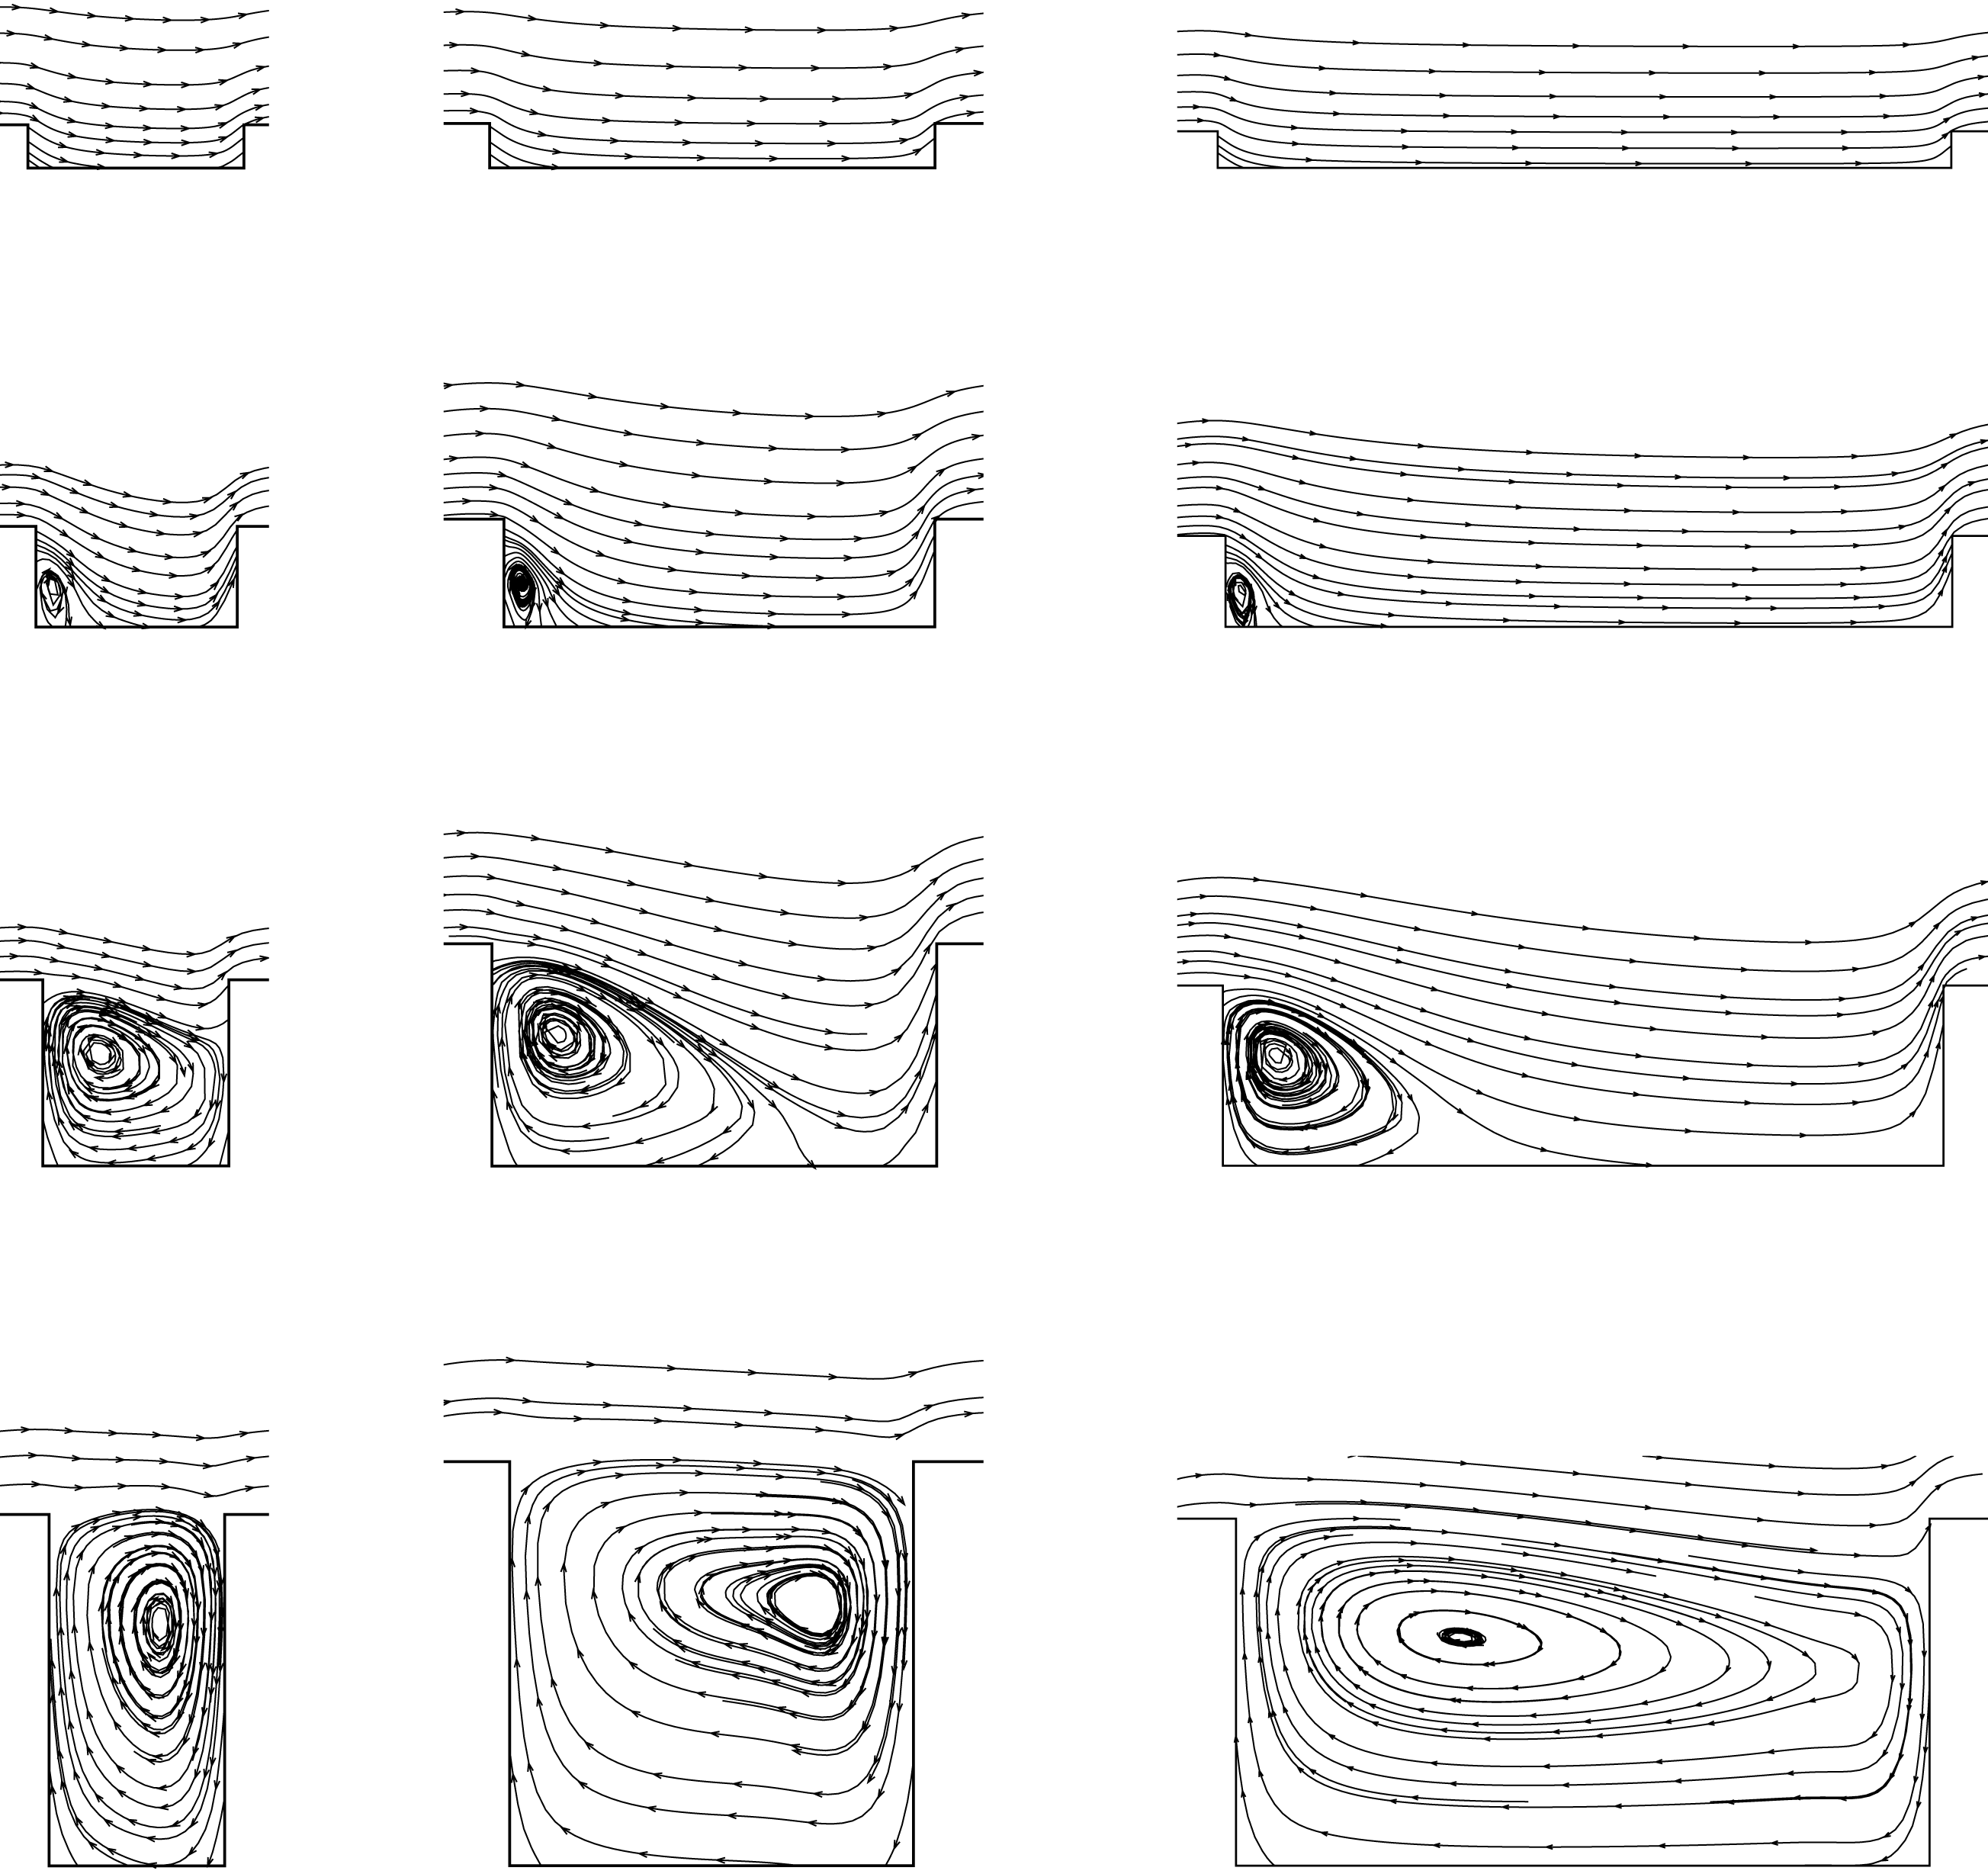
Figures 8 and 9 present the flow patterns in the vicinity of each roughness element. For
 $k/D=0.01$
, there is no obvious recirculation region anywhere and, as we have seen, the friction coefficient is approximately equal to that in the smooth wall case. If we define a characteristic velocity scale
 $V_{k}$
as the average velocity at a height
 $k$
above the roughness element, then by using figure 7(b) we obtain a local Reynolds number
 $kU_{k}/\unicode[STIX]{x1D708}\approx 2$
for this roughness height, and so viscous effects in the vicinity of the roughness element dominate (almost creeping flow).
When the roughness height increases (and the local Reynolds number concurrently increases), a clockwise rotating recirculation zone appears near the back-facing wall of the roughness element. With increasing roughness height the size of this recirculation zone increases, and then a stagnation point appears on the front-facing wall of the element, depending on the spacing, which leads to higher pressure losses and increased drag. When
 $k/D=0.1$
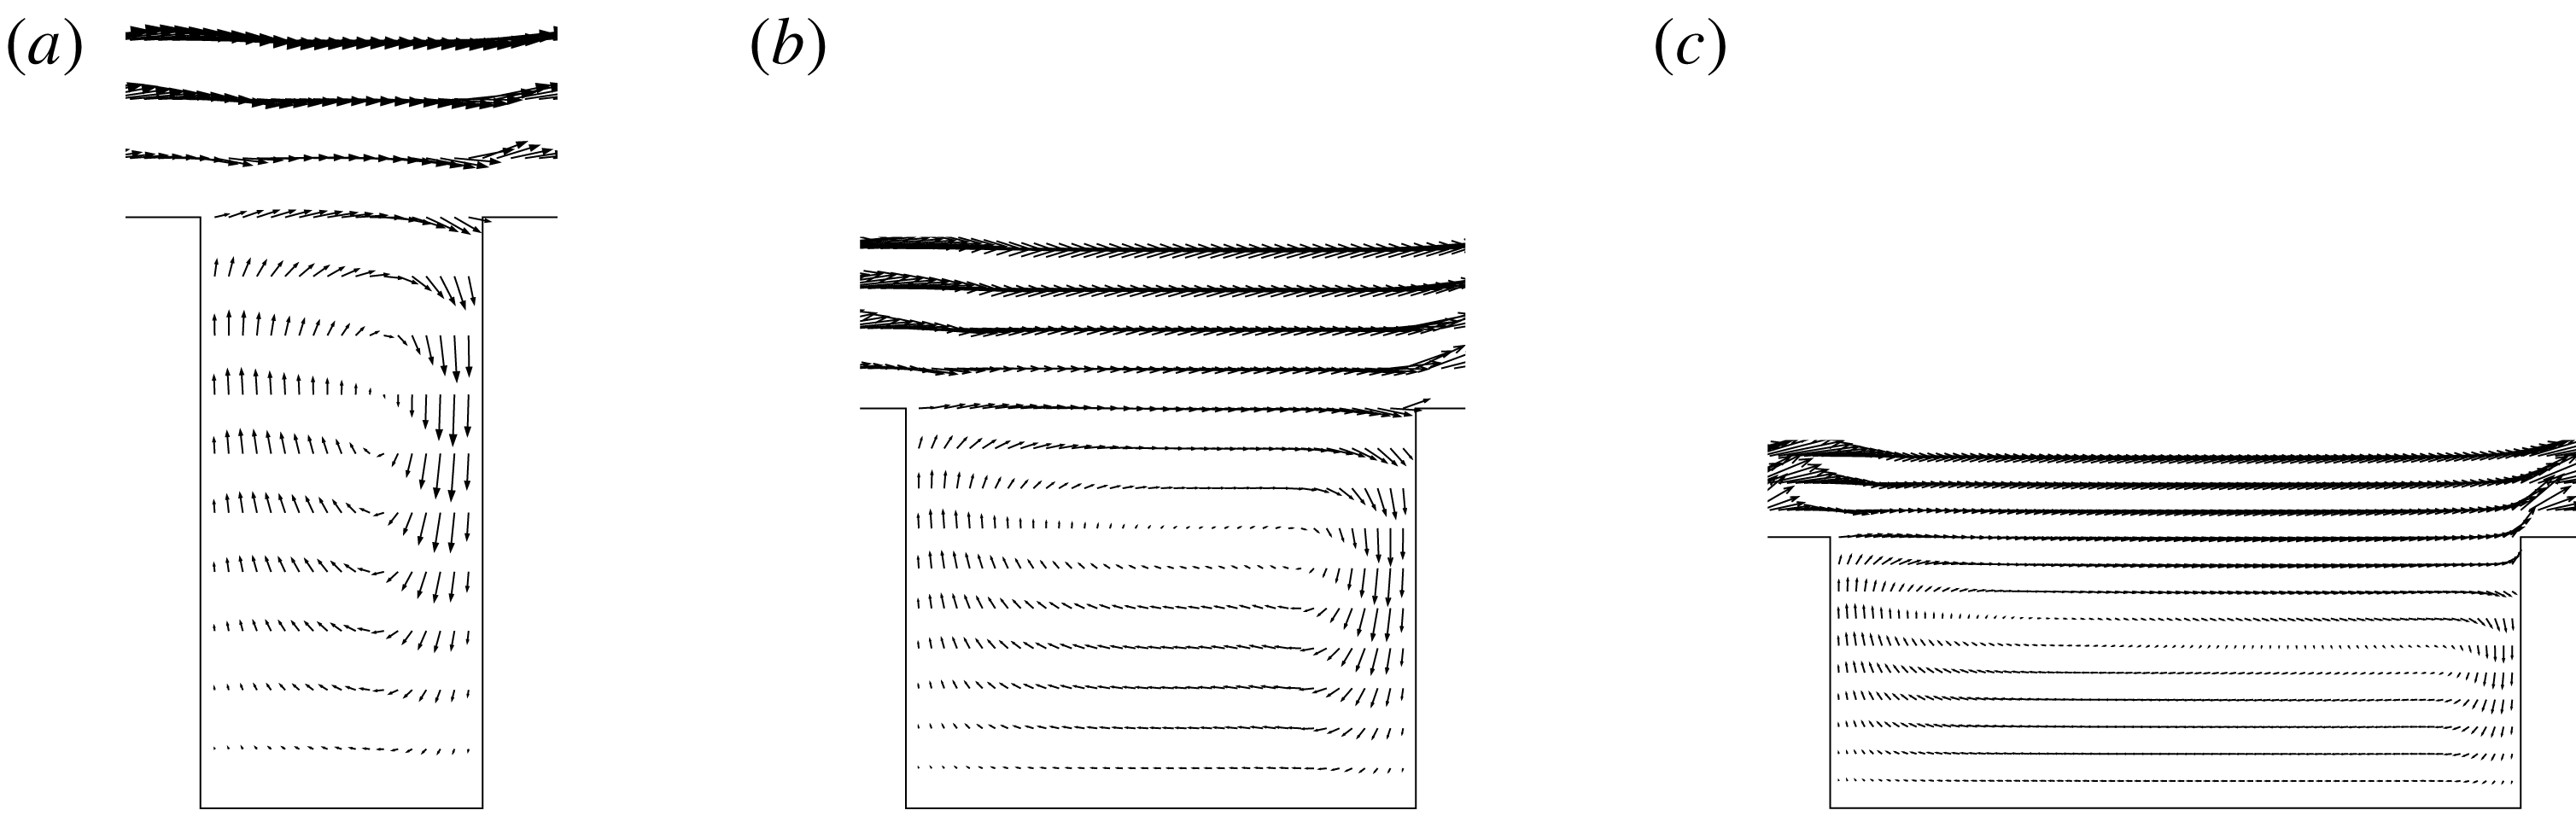
, the recirculation zone occupies nearly the entire space between roughness elements, and there is very little penetration of the external flow into the cavity. The flow was always steady. In this circumstance, the pressure losses are approximately equal to those in a smooth channel with the same constricted diameter and maximum velocity, as shown in figure 7(b), which further helps to explain the relative success in using the constricted diameter in the definition of the friction factor ((4.2) and figure 7
a).
Streamline distributions. Rows, top to bottom:
 $k/D=0.01$
, 0.025, 0.05, 0.1. Columns, left to right:
 $\unicode[STIX]{x1D706}/w=2$
, 4, 8. Vertical dimension amplified by a factor of 4 relative to the horizontal dimension.

Velocity vectors with
 $k/D=0.1$
. (a–c)
 $\unicode[STIX]{x1D706}/w=2$
, 4, 8. Vertical dimension amplified by a factor of 4 relative to the horizontal dimension.

5.1 Distributions of skin friction
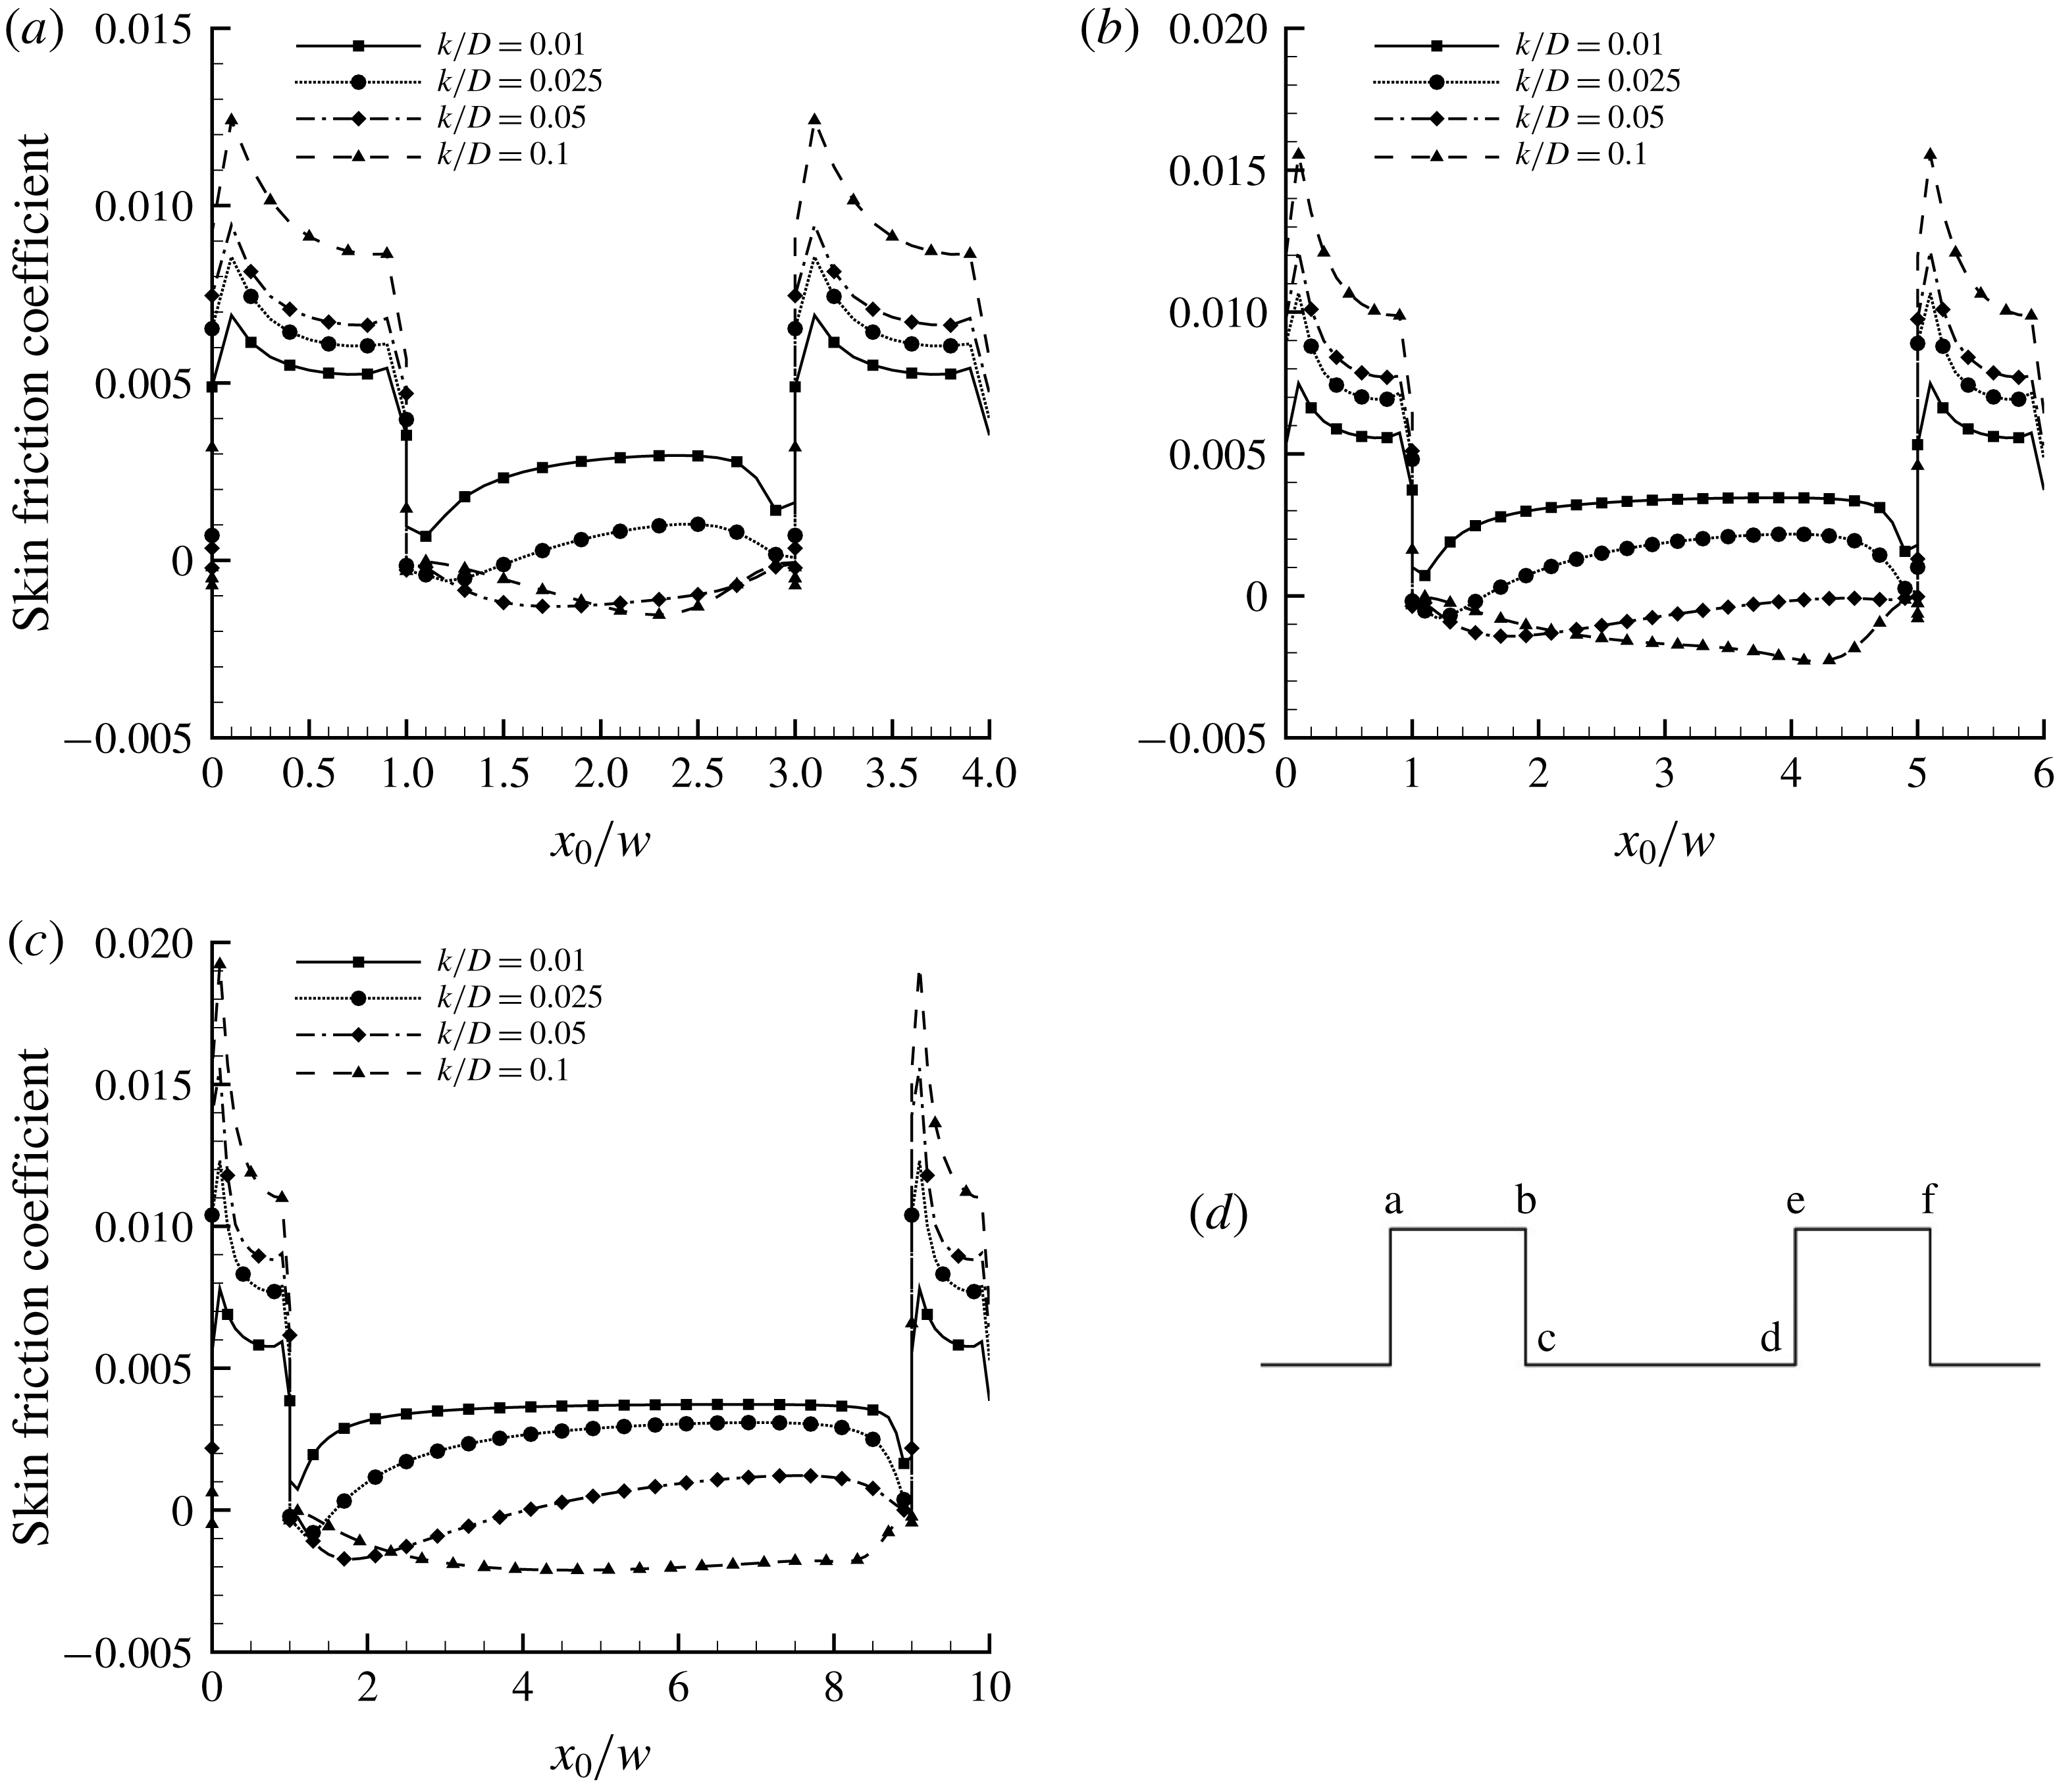
To more clearly illustrate the wall roughness effect on the flow characteristics, figure 10 shows the wall friction distributions in the vicinity of each roughness element in the fully developed rough region, where the friction coefficient is given by
 $C_{f}=\unicode[STIX]{x1D70F}_{w}/{\textstyle \frac{1}{2}}\unicode[STIX]{x1D70C}V^{2}$
and
 $\unicode[STIX]{x1D70F}_{w}$
is the wall stress in the
 $x$
-direction. In each case, on the top surface (ab), the skin friction starts high before quickly decreasing to achieve an approximately constant value, reflecting an acceleration of the flow near the leading edge of each element, followed by a rapid approach to equilibrium (remember that
 $w/D=0.1$
for all cases considered here). The peak level of the friction on the top surface follows the increase in flow speed near the wall because of the constriction of the channel height by the roughness.
Wall shear stress distributions with varying roughness. (a)
 $\unicode[STIX]{x1D706}/w=2$
; (b)
 $\unicode[STIX]{x1D706}/w=4$
; (c)
 $\unicode[STIX]{x1D706}/w=8$
; (d) notation (
 $x_{0}$
is defined such that
 $x_{0}=0$
at point a).

The skin friction within the cavity is always significantly smaller than that on the top face of the roughness element, as expected, but its magnitude and behaviour depend strongly on the roughness height. Also, negative values indicate reversed flow, so that the skin friction distribution is a good indicator of the extent of any recirculating region. For
 $k/D=0.01$
,
 $C_{f}$
is always positive, which corresponds well with the absence of a recirculating region for this roughness height, as seen in the streamline patterns, figure 8. For the other roughness heights, regardless of the spacing, we see a similar correspondence between the flow pattern and the distribution of skin friction; that is, the distance over which
 $C_{f}$
is negative agrees well with the size of the recirculating region deduced from flow visualization. For
 $k/D=0.025$
the region of negative skin friction occurs for a distance of
 $0.5w$
–
 $0.6w$
; for
 $k/D=0.05$
, when the cavity is of a sufficient length, the region of negative skin friction is about
 $3w$
in extent; while for
 $k/D=0.1$
the region of negative skin friction spans the entire length of the cavity.
As for the effects of spacing, increasing
 $\unicode[STIX]{x1D706}/w$
for a fixed
 $k/D$
results in a higher skin friction within the cavity. When the spacing increases, the number of roughness elements per unit flow length decreases, reducing the interaction between roughness elements. The distributions of streamlines also reflect this behaviour.
5.2 Distributions of wall pressure
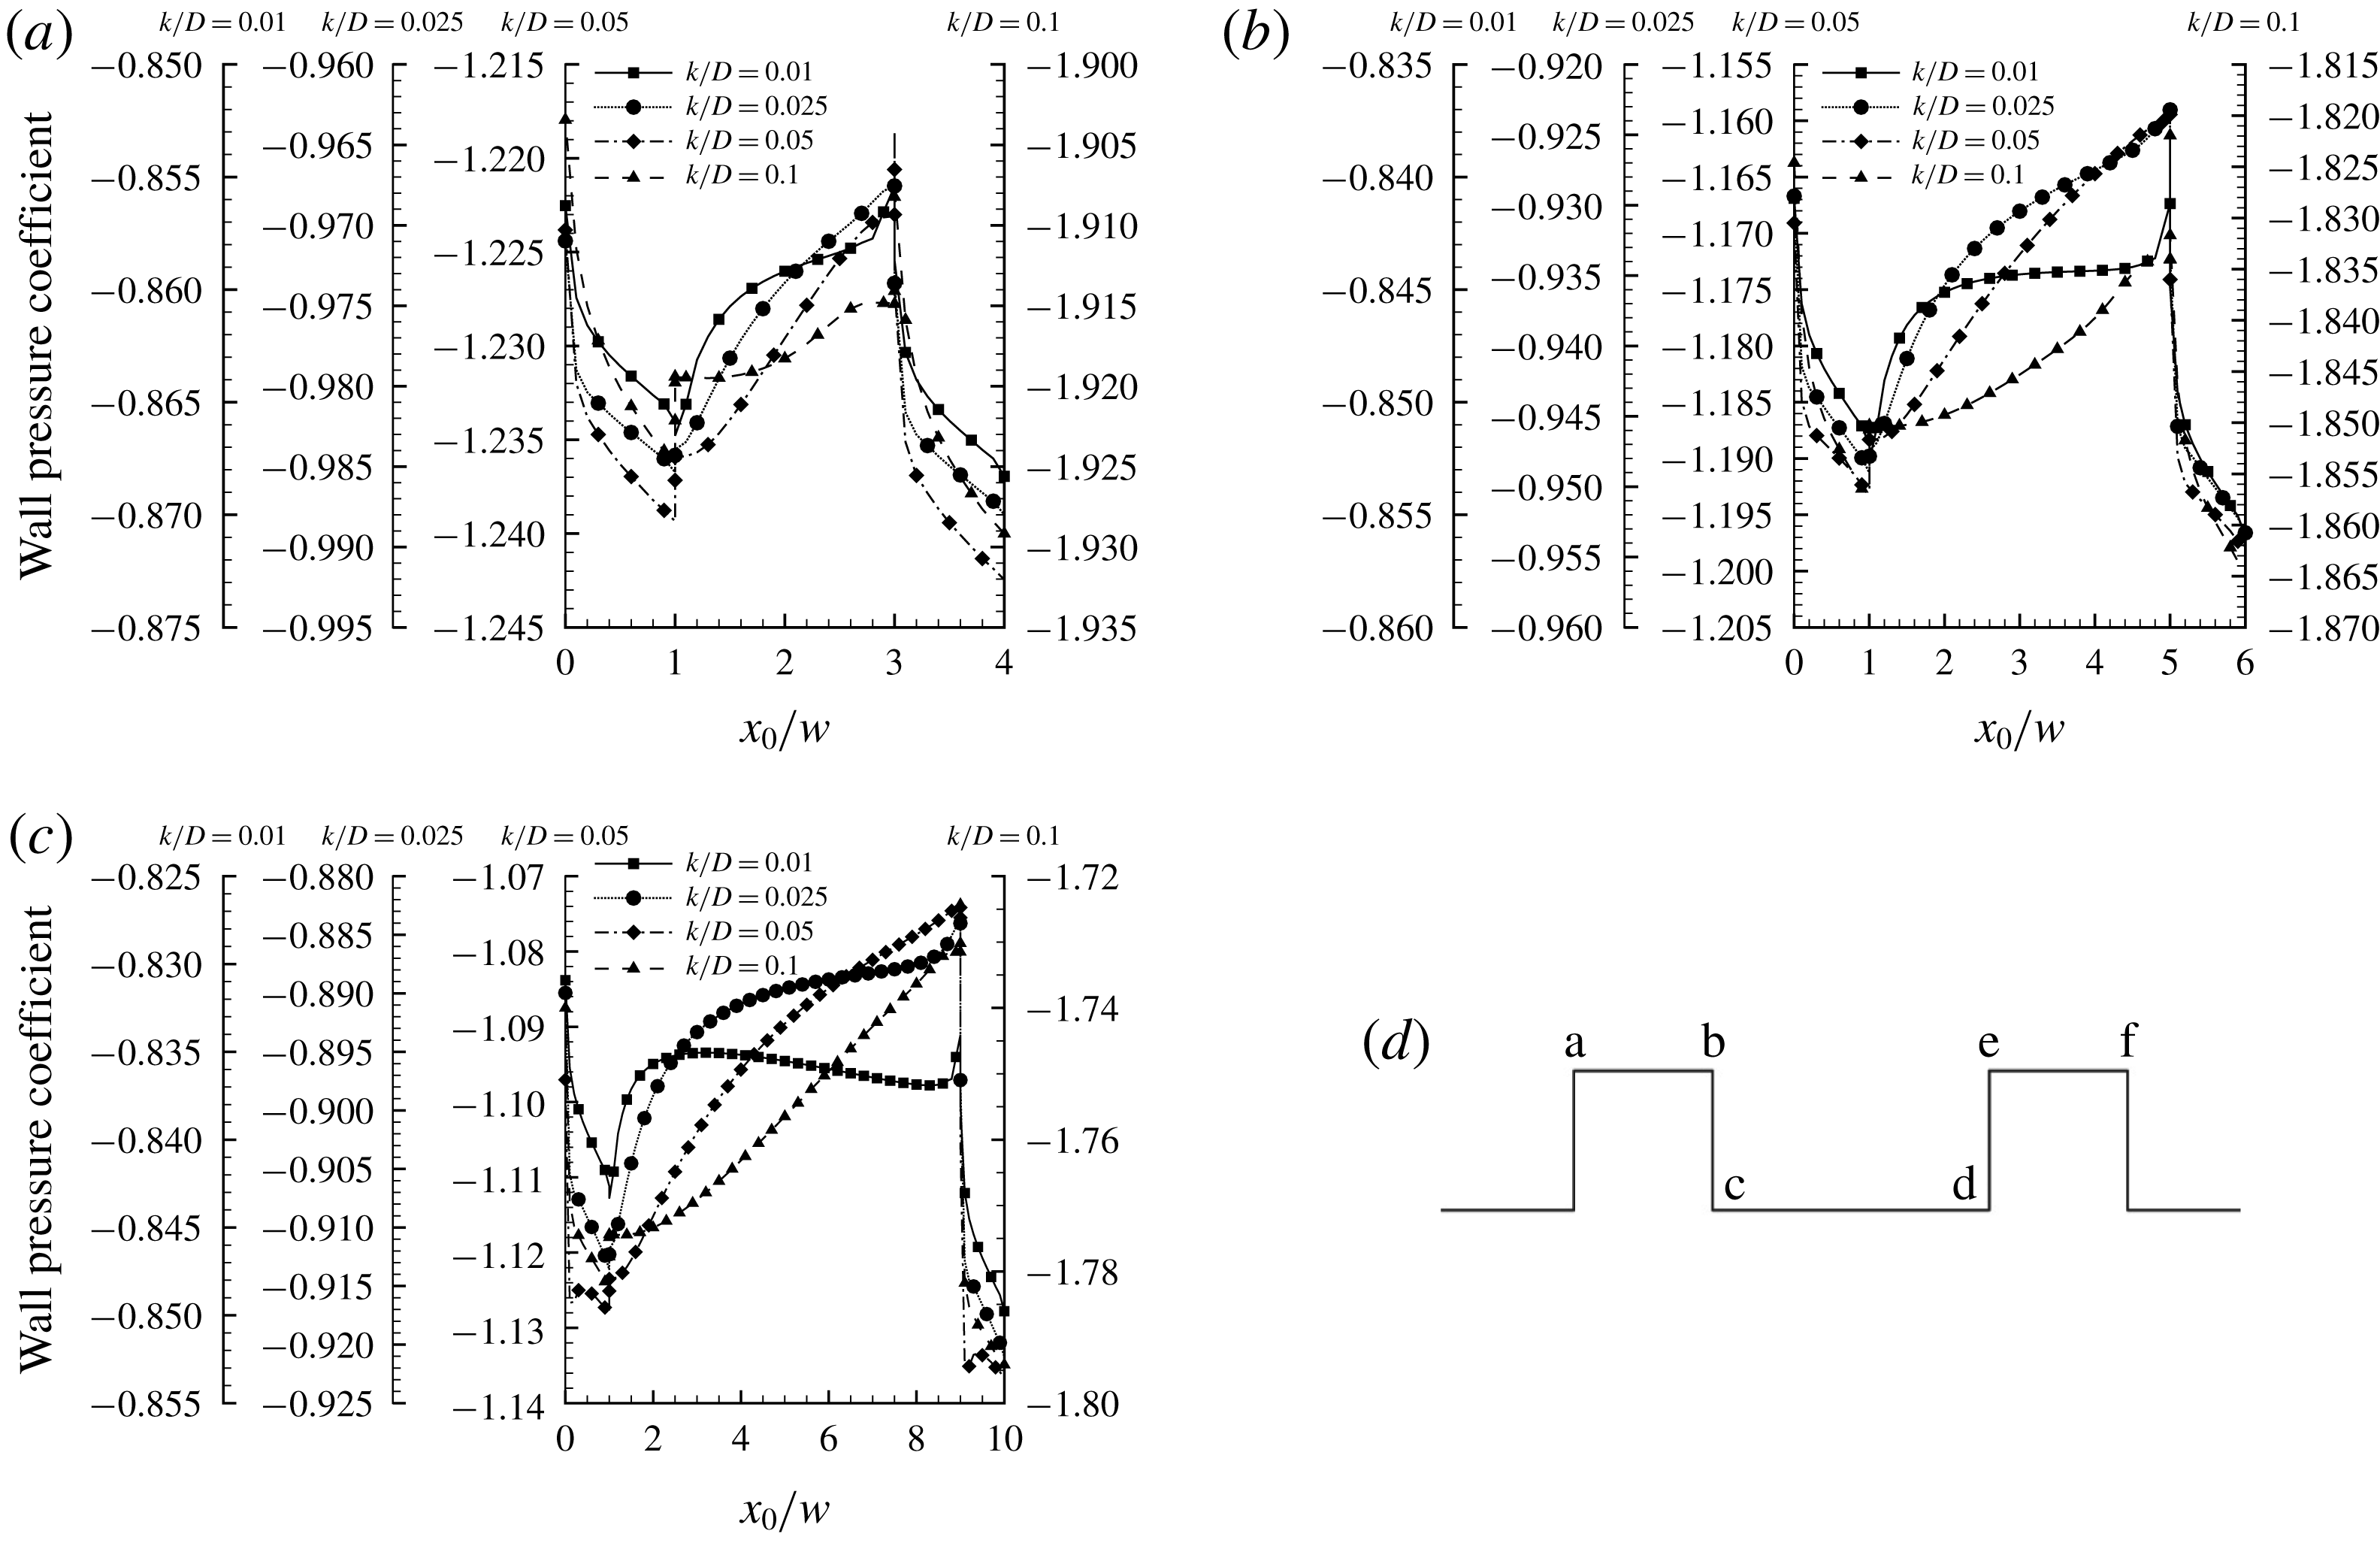
The corresponding pressure distributions with different roughness heights are shown in figure 11. The pressure coefficient is defined in the usual way according to
 $C_{p}=(p-p_{\infty })/{\textstyle \frac{1}{2}}\unicode[STIX]{x1D70C}V^{2}$
where
 $p_{\infty }$
is the static pressure of the incoming flow.
Pressure distributions with varying roughness. (a)
 $\unicode[STIX]{x1D706}/w=2$
; (b)
 $\unicode[STIX]{x1D706}/w=4$
; (c)
 $\unicode[STIX]{x1D706}/w=8$
; (d) notation (
 $x_{0}$
is defined such that
 $x_{0}=0$
at point a).

Figure 11 confirms that the larger roughness elements produce greater pressure losses and that the height of the roughness element plays a more important role than the spacing. Here, we note a significant difference in the distribution of the pressure coefficient from that of high Reynolds number flows: instead of staying relatively constant after the downstream corner due to flow separation, the pressure coefficient drops steeply on the downstream face of the roughness element (face bc in figure 11 d). Conversely, the pressure coefficient rises sharply on the downstream face (face de), and so the effects of viscosity are important for all roughness heights considered here. Similar results were obtained by Gonzalez (Reference Gonzalez2017) using the method of regularized Stokeslets to analyse the creeping flow over a cube in an unbounded fluid.
For each case, there is a drop in pressure along the horizontal surface of the roughness element (face ab), which is significantly stronger than that due the average pressure gradient. At higher Reynolds numbers, that would suggest a local flow acceleration, but as figure 10 makes clear the skin friction is also dropping so that viscous effects are important here also. Along the bottom surface (face cd) the pressure rises in almost every case, except for the case with
 $k/D=0.01$
, where, when
 $\unicode[STIX]{x1D706}/w$
is large enough, the pressure reaches a maximum before slowly decreasing with further distance downstream. Also, for the case with
 $k/D=0.1$
, there is a small plateau just downstream of the roughness element, most obviously when
 $\unicode[STIX]{x1D706}/w=2$
, which is typically associated with a separation bubble. However, although there is a clear recirculation zone present for all cases with
 $k/D\geqslant 0.025$
(see figure 8), this plateau region is not apparent in the pressure distributions for
 $k/D<0.1$
. In the cases studied here, therefore, the pressure distribution is not a reliable indicator of separated flow, undoubtedly because of the continued importance of viscous effects.
5.3 Relative contributions of pressure drag and skin friction
We can gain further insight into the flow evolution by considering the local drag distribution, where the local drag is given by the sum of the skin friction and form drag associated with a single roughness element. For each element, therefore, the forces in the flow direction due to the pressure differences integrated over the vertical surfaces of the roughness element (bc and de), and the viscous stress integrated over the horizontal surfaces (ab and cd), were computed.
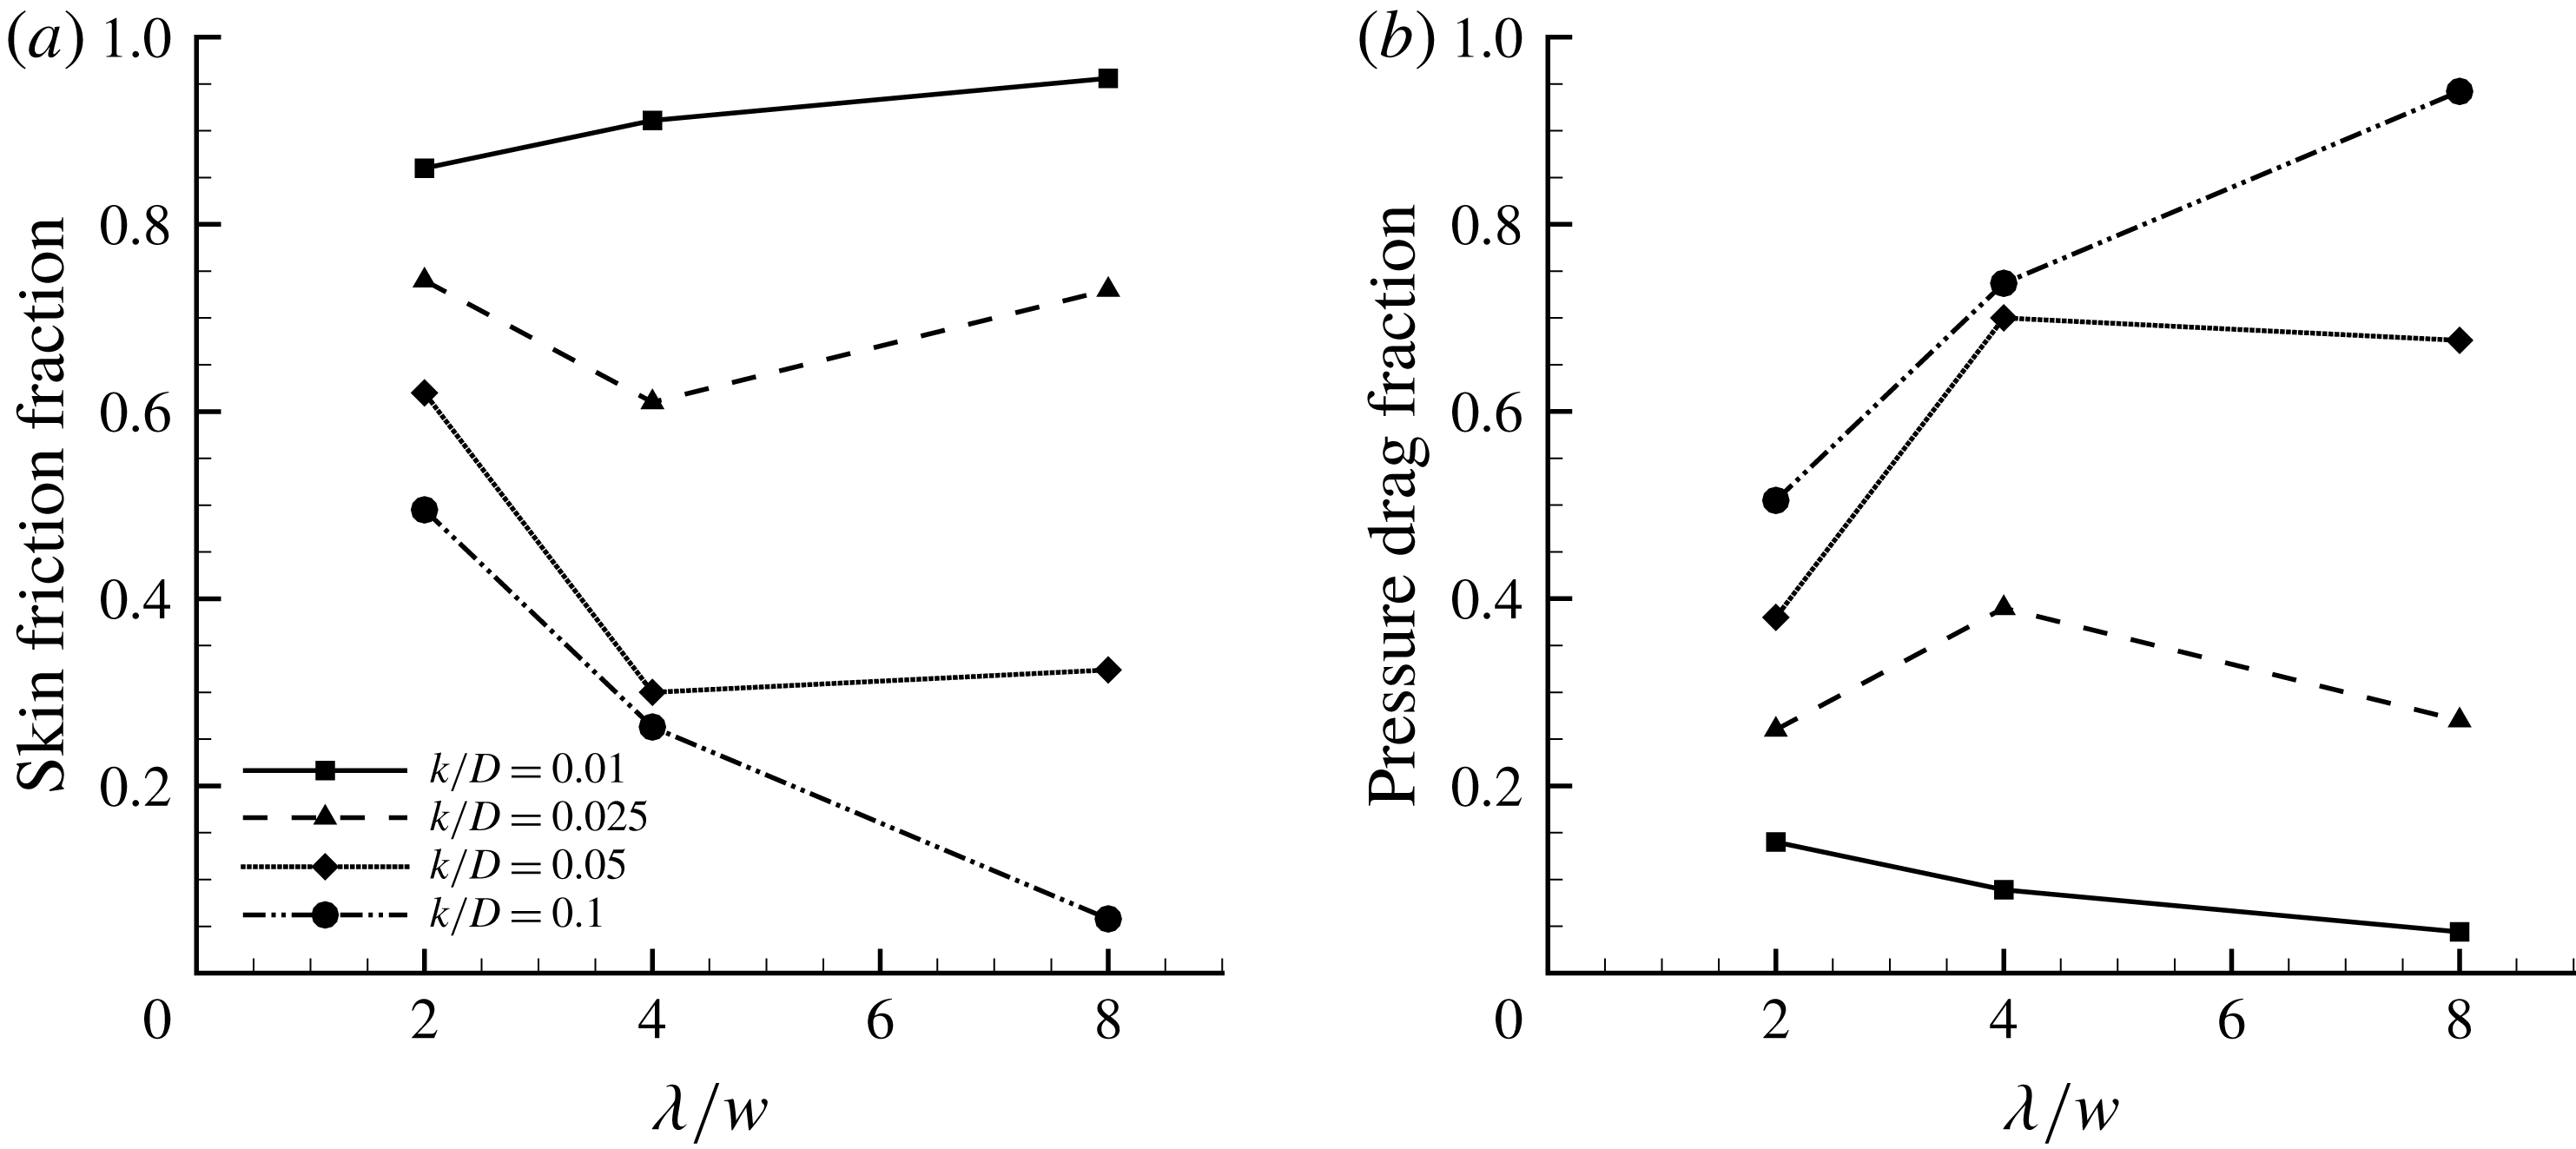
Figure 12 shows the fraction of the total drag due to either skin friction or form drag. For all cases, as the roughness height increases the fraction of the drag due to pressure differences increases. The effect of spacing, however, is more ambiguous, and it depends very much on the amount of reversed flow present in the cavity. When the recirculation region is small or negligible, as in the case of
 $k/D=0.01$
, the skin friction dominates, and so the overall drag is close to that given by the smooth wall case, especially for the largest spacing. When the cavity flow is dominated by the recirculation, as in the case of
 $k/D=0.1$
, the form drag dominates, although it is somewhat surprising to see that for
 $\unicode[STIX]{x1D706}/w<8$
the skin friction drag still makes a significant contribution to the total drag. This contribution comes primarily from the flow over the top surface of the roughness element, and so it decreases almost linearly with the spacing (at least for
 $k/D=0.1$
). It is, therefore, only for the largest roughness height with the largest spacing that the contribution due to skin friction is essentially negligible. Under these conditions, we expect the drag to be independent of Reynolds number, and so it corresponds to what we propose to call ‘fully rough’ laminar flow.
Effect of pitch on (a) skin friction and (b) pressure (form) drag.

As to the effects of spacing, we see that the trend depends on the roughness height. The behaviours for
 $k/D=0.01$
and 0.1 with spacing are monotonic, and the underlying mechanisms have already been addressed. However, for
 $k/D=0.025$
and 0.5 with
 $\unicode[STIX]{x1D706}/w=4$
the balance between friction and form drag is not monotonic, and speaks to the complexity of the flow behaviour in this intermediate regime. The complexity arises from the competing trends in: (1) the friction on the top surface of the roughness element, which decreases with increasing spacing; (2) the friction on the bottom surface of the cavity, which increases with spacing but reduces with roughness height; and (3) the pressure loss associated with the recirculation, which increases with increasing roughness height and decreases with increasing spacing.
Based on these general considerations, we can now identify
 $k/D$
with the form drag and
 $\unicode[STIX]{x1D706}/k$
with the cavity component of the viscous drag. The broad argument is that the height of the roughness element determines the form drag and that the length of the cavity determines how much the shear stress acting on the cavity floor contributes to the overall viscous drag (given that there is always a high background level of shear force acting on the top of the roughness elements since the top is exposed to the main flow). As
 $\unicode[STIX]{x1D706}/k$
becomes large, the length of the separated flow region
 $L_{s}$
becomes small compared to the length of the cavity (we expect
 $L_{s}\propto k$
). Referring to table 1, for
 $k/D=0.01$
, for example,
 $\unicode[STIX]{x1D706}/k$
varies from 20 to 80. For this roughness height, we expect the flow over the bottom of the cavity to have an increasing drag due to viscous shear as
 $\unicode[STIX]{x1D706}/k$
increases, while the size of the separation bubble should remain more or less fixed and small compared to the length of the cavity. Hence the effect of the
 $\unicode[STIX]{x1D706}/k$
term in the correlations given by (3.1) and (4.5) becomes more pronounced compared to the form drag factor
 $k/D$
. Contrast this to the case where
 $k/D=0.1$
and
 $\unicode[STIX]{x1D706}/k$
varies from 2 to 8. Here the cavity is basically filled by the separation bubble. The viscous shear on the bottom of the cavity is negative and not so small compared to, say, the contribution due to the top of the roughness element, especially when taking into account that the length of the cavity goes up to
 $8w$
. However, it should be compared to the form drag which dominates the flows at this roughness height, and so the
 $k/D$
term dominates.
6 Conclusions
The effects of roughness on the frictional drag and the pressure drop in laminar channel flow were investigated. The inflow was fully developed smooth wall flow and the square rib roughness, aligned normal to the bulk flow direction, was introduced as a step change. We found that the response of laminar channel flow to the introduction of roughness (the developing region) depends strongly on the relative roughness height. The effects of roughness spacing become more important as the roughness height decreases, and for the roughness parameters studied here (
 $0.01\leqslant k/D\leqslant 0.1$
,
 $2\leqslant \unicode[STIX]{x1D706}/w\leqslant 8$
) the variation of the development length could be expressed by a simple correlation that depends only on
 $k/D$
and
 $\unicode[STIX]{x1D706}/k$
. This is the first time the evolution of a laminar channel flow in response to a step change in roughness has been reported.
In the fully developed rough wall region, the friction coefficients always increase with roughness when compared to the smooth wall case, and the increase depends crucially on the roughness height and to a lesser extent on the spacing. We showed that the friction factor
 $f_{c}$
based on the constricted diameter collapsed the data on the smooth wall value to within 10 % for all roughnesses studied here, even for the case where
 $k/D=0.1$
. Here,
 $f_{c}$
depends only on
 $k/D$
. The remaining deviation increased approximately linearly with roughness spacing, and an empirical (linear) correction for the spacing improved the collapse to within about 2 %. The correction expresses the dependence of the friction factor on
 $\unicode[STIX]{x1D706}/k$
. The Reynolds number dependence for the rough wall channel was the same as for the smooth wall channel where the friction factor is inversely proportional to Reynolds number, as also found for rough wall pipe flow by Sentürk & Smits (Reference Sentürk and Smits2019).
The effects of viscosity were found to be important for all roughness heights considered here. By examining the flow in the region of the roughness elements, we were able to identify the respective roles of: the friction on the top surface of the roughness element, which decreases with increasing spacing; the friction on the bottom surface of the cavity, which increases with spacing but reduces with roughness height; and the pressure loss associated with the recirculation, which increases with increasing roughness height and decreases with increasing spacing. We can identify two extremes, one where the flow is essentially unaffected by the roughness (the smallest roughness with the largest spacing) and the other where the total drag is dominated by the form drag on the roughness elements (the largest roughness with the largest spacing). For this latter condition, we propose the term ‘fully rough laminar flow’. All other cases might be called transitionally rough, in analogy with the behaviour of rough wall channels in the turbulent regime.
Acknowledgements
This research was supported by the National Natural Science Foundation of China (grant no. 51436002) and the State Key Laboratory of Explosion Science and Technology (ZDKT17-01). Additional support under ONR Grant N00014-17-1-2309 is also acknowledged.