I. INTRODUCTION
Thermal barrier coatings (TBCs) spallation and delamination are well-known problems that have been addressed by a number of experimental and theoretical studies.Reference Mumm and Evans1–Reference Wei and Hutchinson8 Premature failure often occurs along the interface between bond coat and thermally grown oxide (TGO) by microcrack nucleation, propagation, and coalescence, leading eventually to spalling and delaminating of the TBC. To prevent these premature failures in TBCs, it is important to improve the adhesion strength between the bond coat and the TGO. Recalling that the exact structure and composition of real interfaces between the bond coat metal (typically made of a Ni-based alloy) and the TGO (predominantly α-alumina) could be very complicated, this study focuses on modeling of Ni/α-Al2O3 interfaces.
To give a quantitative evaluation of interfacial adhesion strength, many researchers resorted to the parameters such as work of separation and ideal tensile strength.Reference Zhang, Smith and Evans9–Reference Shi, Tanaka and Kohyama11 Meanwhile, the ideal shear strength, i.e., the maximum shear stress that materials or structures can withstand before yielding, would also provide a reliable evaluation of interfacial adhesion strength. It has been accepted as a basic parameter for strength property of materials or structures. Extensive studies have been carried out on shear behavior in metals and ceramicsReference Ogata, Li, Hirosaki, Shibutani and Yip12 or the heterogeneous materials interface.Reference Aouadi, Basnyat, Zhang, Ge and Filip13, Reference Nakamura, Mizoguchi, Shibata, Matsunaga, Yamamoto and Ikuhara14 However, little work has been reported on the shear behavior of Ni/α-Al2O3 interfaces by using first-principle calculations so far. The difficulty of this kind of study mainly comes from the structural complexity of Ni/α-Al2O3 interfaces and the fact that the modeling of shear process involves typically rather heavy calculations. Recently, Jiang et al.Reference Jiang, Wei, Smith, Hutchinson and Evans15 conducted first-principle shear calculations to predict the macroscopic toughness of the Al-terminated O-site γ-Ni(Al)/α-Al2O3 interface model. To provide a comprehensive understanding of the mechanical properties of Ni/α-Al2O3 interfaces that underwent shear loading, it is essential to perform more extensive first-principle shear calculations on other interface models such as the O-terminated Al-site one.
In this study, we performed the first-principle shear simulations for two types of Ni(111)/α-Al2O3(0001) interface models that displace along <110> and <112> directions of the Ni lattice. The evolution of atomic structures of these interface models are observed, and their sliding mechanisms are elaborated from the computational results. Furthermore, their mechanical properties such as ideal shear strength and unstable stacking energy are obtained and discussed in detail. In addition, a comparative analysis between the shear and tensile results obtained by our first-principle calculations was presented.
II. METHODOLOGY
The first-principle shear calculations presented here have been carried out using the VASP code.Reference Kresse and Hafner16, Reference Kresse and Furthmuller17 The generalized gradient approximation of projector augmented wave method is adopted for parametrization of the exchange-correlation functional. The k-point sampling was attained upon using 5 × 5 × 1 points in a regular Monkhorst–Pack scheme. The plane-wave cutoff energy of 500 eV and an energy convergence criterion of 10−5 eV for self-consistency are adopted throughout all the calculations. Relaxation is done until the Hellman–Feynman forces are less than 0.01 eV/Å using a conjugate gradient algorithm.
The coherent Ni(111)(√3×√3)/α-Al2O3(0001)(1 × 1) interface models given in Ref. Reference Guo and Shang18 are dealt with in present work. Focus was put on the two most stable interface models, namely, Al-terminated O-site model and O-terminated Al-site model (in short, Al–O model and O–Al model hereafter). As pointed out by Zhang,Reference Zhang, Smith and Evans9 it is reasonable that lattice misfits are about 11% for all these candidate interface models, although the experimental misfit is 9.488%. Figure 1 presents the atomic structure of the typical simulation cell and the settings for the applied shear loading. The supercell is constructed by a slab of α-Al2O3(0001) layers consisting of five O atomic layers and ten Al atomic layers for the Al-terminated O-site model while both sides are removed for the O-terminated Al-site one, sandwiched between two Ni slabs (each consisting of five Ni (111) atomic layers). Preliminary calculations showed that relaxation have been sufficient for two interfacial rows of Ni atoms, as well as six- and five-layer atoms of α-Al2O3 for the Al–O model and the O–Al model, respectively. In the present simulations, the interfaces shear was simulated in a quasistatic way, where shear strains were applied by displacements of a group of Ni atoms in the bulk region. First, the Ni bulk region containing nine atoms in the supercell, which is surrounded by the rectangle in Fig. 1(b), was rigidly translated a distance of δ relative to the α-Al2O3 block along <110> or <112> direction of the Ni lattice. Second, the atoms out of the rectangles were fully relaxed until the Hellman–Feynman forces are less than 0.01 eV/Å. During the relaxation, the positions of the rigidly translated atoms in the bulk region were fixed.
Simulation cell for the Ni(111)/α-Al2O3(0001) interface. The Ni, Al, and O atoms are represented by blue, purple, and red spheres, respectively. Note that the models have been duplicated in the lateral direction to better show the system.

III. RESULTS AND DISCUSSION
A. Shear stress–shear displacement curves
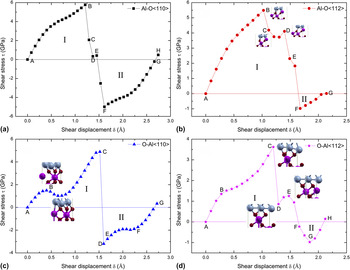
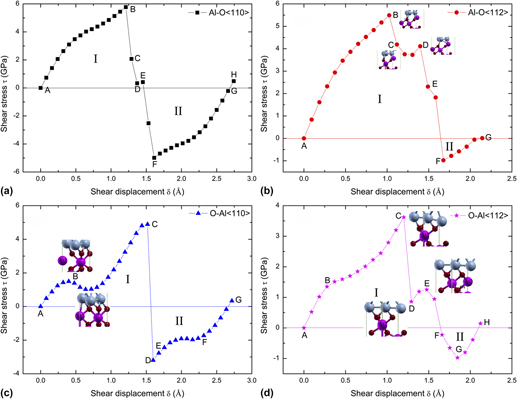
The shear stress–shear displacement curves for the two interface models along <110> and <112> directions of the Ni lattice are shown in Fig. 2. The maximum shear stress for the Al–O model in <110> and <112> slip directions is determined to be 5.77 and 5.49 GPa [see Figs. 2(a) and 2(b)], respectively, which are in good agreement with the first-principle results in Ref. Reference Jiang, Wei, Smith, Hutchinson and Evans15. Further, it can be seen from Figs. 2(c) and 2(d) that the maximum shear stresses for the O–Al model are relatively smaller than that for the Al–O models, i.e., 4.89 and 3.62 GPa in <110> and <112> directions, respectively. According to Farkas,Reference Farkas19 a transition to a different crystalline structure occurs when the local shear stress at the grain boundaries (GB) reaches a critical level, which is an indispensable process for the GB sliding. From this point of view, it is reasonable to choose the above maximum shear stresses as the critical shear stresses that induce sliding of Ni(111)/α-Al2O3(0001) interfaces along <110> or <112> direction of the Ni lattice. It is also noticed that the critical shear displacements, δ c, the displacement when the shear stress reaches its maximum, are 1.21 and 1.02 Å [point B in Figs. 2(a) and 2(b)], for the Al–O model in <110> and <112> slip directions, respectively. For the O–Al model, the values of δ c are a bit larger, i.e., 1.52 and 1.20 Å [point C in Figs. 2(c) and 2(d)] in <110> and <112> directions, respectively. This could be due to the ionic Ni–O bonding in the O–Al interface model, which is harder than the metallic Ni–Al bonding in the Al–O interface model. From the piecewise slopes of the shear stress–shear displacement curves, the theoretical shear modulus of these supercell are estimated to be 7–37 GPa, which are much less than the shear modulus of α-Al2O3 single crystal and Ni single crystal (161 and 163 GPa for α-Al2O3 obtained by theory and experiment, respectivelyReference Duan, Karki and Wentzcovitch20, Reference Gieske and Barsch21; 84.1 and 77.8 GPa for Ni obtained by theory and experiment, respectivelyReference Liu, Zhang, Zhou, Lu and Kohyama22). It is demonstrated that the mechanical properties of the Ni(111)/α-Al2O3(0001) interfaces are not the simple complementation or complex of material composition. The rippled nature of the Ni(111)/α-Al2O3(0001) interfaces might be one reason, and these interfaces are generally weak compared to the pristine bulk material.
The shear stress versus shear displacement curves for Ni(111)/α-Al2O3(0001) interface models: (a) Al–O<110>, (b) Al–O<112>, (c) O–Al<110>, and (d) O–Al<112>. The horizontal lines are the boundaries between region I and II. The shear stresses in region I are positive values, instead those in region II are negative. Specific Al–O bonds around the Al2 or Al3 atom inside the α-Al2O3 are also depicted at some stages.

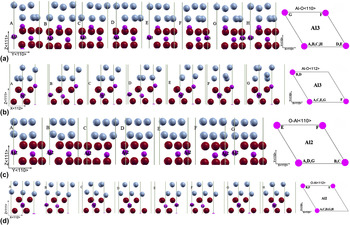
Figure 3 shows a series of snap shot for notable changes in the Ni(111)/α-Al2O3(0001) interface structures during the shear deformation process. In particular, the shifting of Al atomic location (Al2 and Al3 for the O–Al mode and the Al–O model, respectively.) is displayed in the right. The atom index Al2 denotes the second Al layer atom in the α-Al2O3 block from the interface of the O–Al model, and similarly the Al3 represents the third Al layer atom for the Al–O model. The capital letters X (A, B, C, ...) labeled in Fig. 3 are corresponding to that in Fig. 2. As shown in Fig. 2, the shear stresses at region I were continuously increasing until the displacements reach to δ c except for the case of O–Al <110> model. As shown in Fig. 2(c), the shear stress reduces a little after point B in the O–Al <110> model due to the breaking of Al2–O1 bond and Al2–O2 bond, the shear stress is not the maximum value. Before the shear stresses reach to their maximum values, the Ni atomic layers slide along the shear direction accompanying the shifting of Al atoms, as shown in Fig. 3. In fact, the movement of Al atoms represents the breaking and rebonding process of the specific Al–O bond in the vicinity of the interface. When exceeding their maximum values, the shear stresses drop abruptly. For the Al–O <110> model, the Ni atom layers undergo a reconstruction along the –Y-direction, as shown in Fig. 3(a) from point B to C. It is apparent that the Al–O <110> model failed within the Ni atomic layers. Similar phenomenon is also observed clearly in the O–Al model, see Figs. 3(c) and 3(d) from point C to D. Especially, the Ni atom layers have reconstructed intensively along the –Y-direction in the O–Al <110> model while the Al2 atom moves along –X-direction, these could lead to a sharp drop in the shear stress.
Variations of the atomic structures during shear for Ni(111)/α-Al2O3(0001) interface models: (a) Al–O<110>, (b) Al–O<112>, (c) O–Al<110>, and (d) O–Al<112>. The Ni, Al, and O atoms are represented by blue, purple, and red spheres, respectively. In particular, the change of Al atomic location (Al2 and Al3 for O–Al mode and Al–O model, respectively.) are shown in the right.

Another interesting phenomenon is that, for both the Al–O and O–Al models, there is an evident reversal of shear stresses in region I along the <112> shear direction, see Figs. 2(b) and 2(d). In other words, there exists certain subtle difference between the sliding behaviors in <112> direction and <110> direction for both the Al–O and O–Al models. When the shear stress exceeds its first peak value, for example point B in the Al–O<112> model, and starts to decrease (point C) but followed by a moderate increase (point D), then gradually decreases again to negative values. This rebound in shear stress is mainly due to the breaking of Al3–O1 bond and Al3–O3 bond as well as the rebonding of the Al3–O2 bond and Al3–O4 bond, as displayed in Fig. 2(b). Similar breaking/rebonding of the Al–O bonds around the Al2 atom is seen in the O–Al<112> model as well, Fig. 2(d) (i.e., breaking of the Al2–O1 bond and Al2–O3 bond along with the rebonding of the Al2–O2 bond and Al2–O4 bond). When looking into more details, it is found that, near the first and second peak values of the shear stresses, the transformation of the interfacial atomic configuration is an inevitable. However, even with these changes of atomic structures, the shear stresses may not consequentially reach the peak values, see e.g., the snap shot E in Fig. 3(b). From these findings, it could be reasoning that the reconstruction of crystalline structure is crucial for the mechanical strength resisting the sliding deformation in the interface region. Specifically, the sliding of the Ni atomic layers and the breaking/rebonding of the Al–O bond around the Al2 or Al3 atom within the α-Al2O3 block play dominant roles in the shear deformation process of the Ni/Al2O3 interfaces.
As shown in Fig. 2, the values of the maximum shear stress τ max at region II for (a), (b), (c), and (d) are 4.99, 0.98, 3.20, and 0.97 GPa, respectively. Recalling those stress levels in region I, it is clear that the maximum shear stresses at region II are smaller than that at region I. The origin of this difference could be the stability of the interface before the sliding. The snap shots A in Fig. 3 correspond to the initial structures for the shear region I, which are the equilibrium stable structures without lateral stresses. Approximately speaking, if the reverse loading was applied from the final state, the last snap shot for each interface model can be recognized as the initial structures for the shear region II, i.e., the snap shot H for Figs. 2(a) and 2(d), the snap shot G for Figs. 2(b) and 2(c). And the interface structures at the final shearing state should be more disordered than the initial structures; therefore, they are more unstable and could be deformed more easily.
B. Unstable stacking energy
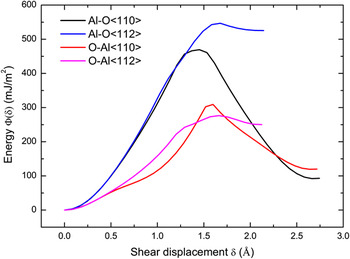
Next, a solid state parameter, i.e., the unstable stacking energy γ us will be discussed, in connection with the sliding behavior of the above Ni/Al2O3 interface models. The parameter γ us is the energy barrier to be overcome in the block-like shear of one half of a crystal relative to the other, along a slip plane in the direction of shear which forms a lattice dislocation. This concept was firstly developed by RiceReference Rice23; it is identified as the area under the shear stress τ versus shear displacement δ curve between δ = 0 and δ = b/2, where b equal to the Burgers vector (more generally, γ us is the area between δ = 0 and the first δ = δ t at which τ = 0 again). Also, γ us is the maximum value of the energy per unit area, Φ, of the slip plane, where . By adopting this concept, we may make use of γ us to measure the resistance to sliding of the Ni/Al2O3 interfaces. And it is expected that, the unstable stacking energy, together with the ideal shear strength, would provide a more comprehensive understanding of the mechanical properties of the Ni/Al2O3 interfaces. Figure 4 shows the variation of the energy Φ with the shear displacement δ for both of the Ni(111)/α-Al2O3(0001) interface models along <110> and <112> directions of the Ni lattice. When the energy function Φ rises to its peak value, the shear displacement δ corresponds to another critical displacement, denoted δ t and also the first δ at which τ = 0 again. The unstable stacking energy γ us for the Al–O model in the <110> and <112> slip directions are calculated to be 469 and 547 mJ/m2, respectively, which is much larger than the corresponding values of 309 and 276 mJ/m2 for the O–Al model. And the critical displacements δ t for the Al–O model are 1.45 and 1.68 Å, respectively, along the <110> and <112> directions, while the δ t for the O–Al model are 1.60 and 1.66 Å along the <110> and <112> directions, respectively. Remembering that the ideal shear strength and the critical displacement δ c for both the interface models sliding along <110> direction are larger than that along <112> direction (Fig. 2), the critical displacements δ t for the same model in the <110> direction are smaller than that in the <112> slip direction. This is due to that the shear stresses for both the interface models sliding along the <110> direction drop quickly to zero after δ c, and those along the <112> direction undergo a rebound stage before δ t. Comparing the calculated results of the two interface models, the Al–O model possesses much higher ideal shear strength and so does the unstable stacking energy, which indicates that the Al–O model is more superior in the shear resistance and the O–Al model is relatively easier to slip. Based on the present results, it might be more proper to consider the ideal shear strength, 3.62 GPa, of the O–Al <112> model as a theoretical upper limit of shear strength for the Ni/Al2O3 interface. Similarly, the unstable stacking energy γ us for the Ni/Al2O3 interface should be that of the O–Al<112> model, i.e., 276 mJ/m2. On the other hand, our computational results imply that, from the viewpoint of interface material engineering, one should better design and fabricate the Al-terminated O-site Ni(111)/α-Al2O3(0001) interface. This particular type of Ni/α-Al2O3 interface has a higher theoretical shear strength as well as better resistance to plastic slip; as a consequence, the TBC system consisting of this interface would be superior in terms of mechanical reliability and durability.
The energy per unit area Φ of the slip plane as function of the shear displacement δ along <110> and <112> directions for the Ni(111)/α-Al2O3(0001) interface models.

C. Comparison between ideal tensile strength and shear strength
Before this first-principle shear study, we also have performed a detailed reinvestigation of the tensile strength and failure property of the Ni/Al2O3 interfaces by first-principle calculations, see Ref. Reference Guo and Shang18. In that work, truly uniaxial tension as well as uniaxial extension without relaxation along lateral directions are simulated for the Al–O and O–Al interfaces, from which the ideal tensile strengths and work of separation of the interfaces are derived explicitly. All these results are summarized in Table I, together with the ideal shear strengths and unstable stacking energy obtained in this present study. Several interesting points could be observed from this comparison.
Mechanical properties of the Ni(111)/α-Al2O3(0001) interfaces under tensile and shear loadings, including the tensile strength (σ max), the shear strength (τ max), the work of separation (W sep), and the unstable stacking energy (γ us).

First, the values of the shear strengths are much smaller than that of the tensile strengths, indicating that the Ni/Al2O3 interfaces are relatively weaker in resisting shear deformation. In particular, the O-terminated Al-site interface model has the highest tensile strength but the lowest shear strength. The smallest shear strength is found to be 3.62 GPa for the O–Al interface slipping along <112> direction, which is about six times smaller than the tensile strength (23.38 GPa, the O–Al model under uniaxial tension). Moreover, the work of separation for this interface model is about 12–15 times larger than its unstable stacking energy. Due to the limited volume of the simulation cell and periodic boundary condition used for the interface, the interface cleavage requires the breaking of all the atomic bonds across the interface. The fracture of the O–Al interface model under tension typically occurs along the sublayer between the inplane Ni–Ni atomic bonds, and the Al–O model fails by breaking along the interlayer between the Ni–Al layers. On the contrary, the failure of the interface under shear loading conditions generally takes place within the Ni atomic layers. Furthermore, the shear process of the Ni(111)/α-Al2O3(0001) interfaces always accompany the sliding of the Ni atomic layers and the breaking/rebonding of the Al–O bond around the Al2 or Al3 atom inside the α-Al2O3 block, as displayed in Fig. 3, which means that at any given step only a fraction of atomic bonds need to be broken or rebonded during sliding deformation. Thus, less energy and lower stress are required for shearing than the breaking of all the atomic bonds across the interface in tensile deformation.
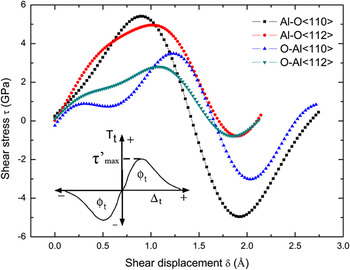
Second, noticing the remarkable differences exist between the order of magnitude in the above shear strength and tensile strength, unstable stacking energy, and work of separation, one should be cautious in developing interface properties for continuum modeling. For example, one may use the first-principle results to construct the widely used cohesive zone models (CZMs) in continuum mechanics framework,Reference Barenblatt24–Reference Needleman26 in this case both the tension and shear properties of the interfaces need to be considered, and the shear properties of the interface are particularly required. From our present study, the Fourier series fitting of the shear stress–shear displacement curves are in good agreement with the exponential CZM, a popular type of CZM, as shown in Fig. 5. The parameters τ max and γ us can somehow represent the cohesive shear strength τ’ max and the work of shear separation φ t in the exponential CZM, respectively. Certainly, there exists many different ways to develop a material-dependent CZM, and its core task is to extract the material parameters such as the cohesive energy and the maximum cohesive strength in the cohesive laws. Not difficult to understand, the CZM developed from the first-principle results will naturally possess a more reliable physical foundation.
The Fourier series fitting curves of the shear stress–shear displacement curves for the Ni(111)/α-Al2O3(0001) interface models. The shear stress–shear displacement curve for the exponential cohesive zone model proposed in Ref. Reference Xu and Needleman27 is shown in the inset panel.

Finally, it should be mentioned that the shear displacement in the present simulation was not applied by a full Burgers vector, and the shear directions were limited to <110> and <112> directions of the Ni lattice. In reality, the actual sliding deformations of the Ni/Al2O3 interfaces might take place along other shear directions and bring about more structural transformations, therefore, their sliding behaviors could be more involved. Toward a deeper understanding of the realistic sliding behaviors of the Ni/Al2O3 interface, further investigations into its other shearing modes are still necessary. Moreover, since the simulation method of a constrained shear was implemented, it is inevitable to induce the normal stress in the interface models. According to Umeno,Reference Umeno and Kitamura28 the normal stresses and the inner displacement of atoms in the cell are two factors that affect the mechanical property of silicon. Similarly, it is feasible to examine the effects of the two factors on the ideal shear strength of the Ni/Al2O3 interface. These will be our future topics.
IV. CONCLUSIONS
In this study, shear simulations of the Ni(111)/α-Al2O3(0001) interfaces by first-principle approaches are performed to examine their mechanical strength and failure property. Two types of the Ni/α-Al2O3 interface models were considered, i.e., the Al-terminated O-site and O-terminated Al-site models, and the shear displacements were applied along <110> and <112> directions of the Ni lattice. Several mechanical properties and the sliding mechanisms of these interface models were carefully investigated. From our computational results and also comparisons with available results in literatures, the following conclusions can be reached:
(i) The interface atomic configuration and shear direction have significant effects on the mechanical properties of the Ni(111)/α-Al2O3(0001) interfaces, such as the theoretical shear strength, unstable stacking energy, and critical displacement. Among the four cases calculated in this study, the O-terminated Al-site interface sliding along the Ni <112> direction is the lowest in both the shear strength and unstable stacking energy, 3.62 GPa and 276 mJ/m2, respectively. On the other hand, the Al-terminated O-site interface sliding along the Ni <110> direction has the highest shear strength (4.99 GPa) and the Al-terminated O-site interface sliding along the Ni <112> direction has the highest unstable stacking energy (547 mJ/m2). Relatively speaking, the Al-terminated O-site interfaces demonstrate a superior shear resistance than the O-terminated Al-site interfaces, and the former should be more favorable in designing and fabricating the related TBC systems.
(ii) The shear process of the Ni(111)/α-Al2O3(0001) interfaces always accompany the sliding of the Ni atomic layers and the breaking/rebonding of the Al–O bonds around the Al2 or Al3 atom in the α-Al2O3 block, and the failure under shear loading generally takes place within the Ni atomic layers. Moreover, it is inevitable that the critical shear stress leads to the crystalline transformation of interfacial atomic configuration, but not vice versa.
(iii) The theoretical shear strength of the Ni(111)/α-Al2O3(0001) interface were significantly lower than its theoretical tensile strength, for example, for the O-terminated Al-site Ni/α-Al2O3 interface, the former is 3.62 GPa (sliding along the Ni <112> direction), while the latter is 23.38 GPa (in truly uniaxial tension). This contrast is understandable since different failure mechanisms are involved in shear and tension. Generally, cleavage under tension occurs by breaking of the atomic bonds across the interfaces, which is more difficult than the relative sliding of slip planes of the lattices. Corresponding to these physical processes, the fracture energies of the interfaces under shear and tension are also considerably different, e.g., for the O-terminated Al-site model, the unstable stacking energy of 276 mJ/m2 versus the work of separation of 4170 mJ/m2.
(iv) Besides the above findings, the above first-principle results have importance in developing interface properties for atomistic or even continuum-level modeling. For example, the calculated parameters such as the ideal strength and fracture energy can be used to identify the cohesive strength and the work of separation in the cohesive law for a continuum mechanics-based CZM, which is commonly used in finite element method calculation of bi-material interfaces. For this purpose, the mechanical properties under both shear and tension must be considered; therefore, it is essential to capture their basic properties such as theoretical tensile strength, shear strength, work of separation, unstable stacking energy, and so on.
ACKNOWLEDGMENTS
This work was supported by New Century Excellent Talents from Ministry of Education of China (No. NCET-08-0445) and Specialized Research Fund for the Doctoral Program of Higher Education of China (No. 20110201110019).