There is always considerable debate among political scientists about how we should evaluate and rank political science departments, particularly those that grant the doctorate. How do we measure the relative positioning of doctoral programs in political science? Which standards do we use to differentiate departments in terms of their quality? Perhaps the best-known approach involves reliance on reputational or impressionistic measures of department quality, best represented in the regular rankings of departments within disciplines (including political science) by U.S. News & World Report (USNWR) (2022) and in a previous iteration of analyses by the National Research Council (NRC) (1993). This approach involves contacting disciplinary experts (e.g., department chairs and graduate advisors) and asking them to rate doctoral programs on typically a five-point scale. The mean rating for each department becomes the measure of perceived quality. Of course, these ratings are highly subjective, but subjective assessments represent real views about the reputations of various political science programs. Other scholars have adopted an approach that uses “objective” measures of department quality, such as publications in leading scholarly journals (Ballard and Mitchell Reference Ballard and Mitchell1998; Garand and Graddy Reference Garand and Graddy1999; Hix Reference Hix2004; McCormick and Rice Reference McCormick and Rice2001; Peress Reference Peress2019; Teske Reference Teske1996); citations (Peress Reference Peress2019); job placements and graduate training (McCormick and Rice Reference McCormick and Rice2001); and other available indicators that represent what departments actually produce rather than how others subjectively perceive those departments.
Of course, we might expect to see a strong relationship between what departments produce of value and how others in the discipline perceive the quality of those departments. Simply stated, we would expect that departments with productive faculty members who regularly publish their work in the leading scholarly outlets also would be those departments ranked most highly in terms of reputation. The relationship between department research productivity and reputation measures has not been ignored by political scientists. Most of the prevailing work on the topic relates to the 1993 NRC ratings of PhD-granting political science departments (Garand and Graddy Reference Garand and Graddy1999; Jackman and Siverson Reference Jackman and Siverson1996; Katz and Eagles Reference Katz and Eagles1996; Lowry and Silver Reference Lowry and Silver1996). For instance, Garand and Graddy (Reference Garand and Graddy1999) find that publications in leading political science journals have strong and significant effects on the reputations of PhD-granting political science departments beyond the effect of department citations.
Our study contributes to this body of research by reporting the first set of results from a large-scale project on department research productivity in 19 leading general and subfield political science journals from 1990 to 2018. We compile a count of department publications in these journals, weighted by the number of authors, department faculty size, and journal impact measures reported by Garand et al. (Reference Garand, Giles, Blais and McLean2009). Based on these results, we present a new ranking of journal research productivity for 120 PhD-granting political science departments, and we show how this measure is strongly but imperfectly related to the USNWR (2022) reputational ratings of PhD programs in political science.Footnote 1
Our study contributes to this body of research by reporting the first set of results from a large-scale project on department research productivity in 19 leading general and subfield political science journals from 1990 to 2018.
DATA AND METHODS
The data used in this study are from a large-scale project involving the collection of data on each article published in 19 political science journals from 1960 to 2018 (Garand, Qi, and Magana Reference Garand, Qi and Magana2023). With the assistance of a team of undergraduate and graduate research assistants in the past decade, the lead author compiled the following data on each article published during this time period, as well as for each coauthor: (1) year published; (2) university name; (3) author name; (4) issue number within year; (5) starting and ending page numbers; (6) total number of coauthors; and (7) individual author positions (e.g., first author, second author). We used the university-name variable to code whether a given coauthor was affiliated with a PhD-granting department at the time of publication. We truncated the dataset to include only those coauthors affiliated with a PhD-granting department. Using these data, we were able to count the number of articles—for each journal and in total—that were designated as having a coauthor affiliated with each of the 120 PhD programs in the United States.
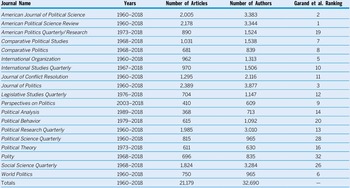
Table 1 presents descriptive information about the journals used in our study. In selecting journals, we focused attention on a combination of factors: (1) journals highly ranked among American political scientists on the Garand et al. (Reference Garand, Giles, Blais and McLean2009) journal impact rankings; (2) general journals that regularly publish articles across political science subfields; and (3) highly ranked subfield or specialty journals. We suggest that the list of journals is a reasonable representation of a wide range of high-visibility and reputable scholarly outlets for scholars publishing in various subfields and methodological traditions.
Sample Information: Years of Coverage, Number of Articles Including an Affiliate of a PhD Department, and Number of PhD Department Authors

Notes: The number of authors represents the number of affiliates of PhD-granting departments that published in these journals. The number of articles reflects those with at least one coauthor from a PhD-granting department.
Using the dataset with author- and article-level data for PhD-affiliated coauthors, we created a summary dataset for PhD-granting political science departments, with variables representing (1) the number of first-, second-, third-, fourth-, and fifth- or more-authored articles published by PhD department affiliates for each of the 19 scholarly journals; (2) the Garand et al. (Reference Garand, Giles, Blais and McLean2009) journal-impact score for each journal, representing the combined reputation and familiarity impact among political scientists in the United States; and (3) the mean number of faculty in each PhD-granting department from 1990 to 2018. We weighted each article by the number of coauthors and journal impact, summed the total for each department, and created both per-faculty and total author-/journal-weighted measures of research productivity in these 19 journals for 120 PhD-granting political science departments. A more detailed summary of our data and methodology is in online appendix 1.
EMPIRICAL RESULTS
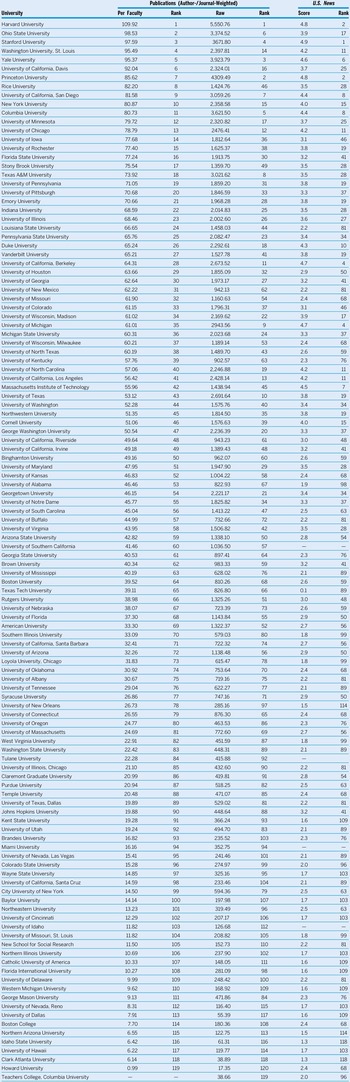
Table 2 presents the measures of research productivity for 120 PhD-granting political science departments, ranked by our per-faculty author- and journal-weighted summed publication measure. For comparison purposes, the table also lists the raw-total author- and journal-weighted publications measure and the 2021 USNWR ranking. As shown in the table, there is considerable face validity to these rankings. The leading political science department in terms of research productivity in 19 major political science journals is Harvard University, followed by Ohio State University, Stanford University, Washington University at St. Louis, Yale University, University of California at Davis, Princeton University, Rice University, University of California at San Diego, and New York University. In general, there are few surprises, with prestige departments (i.e., Harvard, Stanford, and Princeton) ranking very highly. However, some departments ranked lower in terms of reputation—for example, Ohio State (17th), UC–Davis (25th), and Rice (28th)—thereby earning research productivity rankings above their reputational rankings. All of these departments—along with Columbia University (ranked 11th on this list) had at least 80 journal publication points per faculty member from 1990 to 2018. Departments that were ranked from 12th to 27th all had at least 65 journal publication points per faculty member and included a mix of highly regarded private universities (e.g., University of Chicago, University of Rochester, University of Pennsylvania, Emory University, and Duke University) as well as a range of respected public universities (e.g., University of Minnesota, University of Illinois, Stony Brook University, and Texas A&M University). Conversely, toward the bottom of the list are political science departments with either newer PhD programs (e.g., Florida International University), PhD programs that have been discontinued (e.g., University of New Orleans), or other relatively underfunded or underdeveloped PhD programs.
Ranking of US Political Science Departments, Per-Faculty and Raw Author- and Journal-Weighted Publications in 19 Major Political Science Journals, 1990–2018, with 2021 U.S. News & World Report Ranking

There are surprises in the list. Some universities seemed to overpunch their weight, with higher per-faculty journal publication rankings than what was suggested by their reputational rankings among political scientists. This list would include political science departments housed in public universities, including the University of Iowa (ranked 14th on the productivity list, with a USNWR ranking of 46); Florida State University (16th and 41st); Louisiana State University (24th and 81st); University of Houston (29th and 50th); University of New Mexico (31st and 81st); University of Missouri (32nd and 68th); University of Wisconsin, Milwaukee (37th and 68th); University of Kentucky (38th and 76th); and University of North Texas (38th and 59th), among others. In some cases, these are poorly funded departments with relatively small faculties but with strong norms of research productivity. These universities may be able to hire productive faculty members at junior ranks but are unable to retain them over time. When the productive faculty leave to take positions elsewhere, these productive departments lose the reputational points that come with having productive senior faculty. In other cases, these may be departments housed in mediocre universities, with the “halo effect” (i.e., the overall reputation of a university props up the reputation of a given department) acting in reverse by dragging the reputations of these productive departments below what they otherwise would be. In other cases, small faculty size may be impairing the overall scholarly impact of these departments. As shown in table 2, in most cases, the productive departments with weaker reputations exhibit a substantial gap between per-faculty and raw-total publication counts.
There also are surprises in the other direction on the list. Some departments have lower levels of journal-research activity than would be suggested by their reputation, as measured by USNWR ratings. This would include the University of California at Berkeley (ranked 28th in terms of per-faculty journal impact but fourth in reputation by USNWR); University of Michigan (35th and fourth); University of North Carolina (40th and 11th); University of California at Los Angeles (41st and 11th); Massachusetts Institute of Technology (42nd and sixth); University of Texas (43rd and 19th); Northwestern University (45th and 19th); Cornell University (46th and 15th); Syracuse University (77th and 50th); University of Massachusetts (81st and 56th); and Johns Hopkins University (90th and 41st).
There are many reasons why PhD-granting departments with a strong reputation might have a lower level of per-faculty journal-research activity. Whereas faculty members in many departments are research active in publishing both books and articles in leading scholarly journals, some higher-prestige political science departments may be either book driven or prioritize publishing fewer high-impact, high-citation articles over numerous journal publications with lower citations and impact. Hence, the level of journal-research activity may reflect the mix of books and the type of journal articles published by the faculty and other affiliates. For high-prestige departments with large faculties, the research impact also may be realized more in the total publications in leading journals than in the per-faculty publication rates. However, it also is possible that there are political science departments housed in prestigious universities that have a strong reputation based more on the halo effect than on research productivity in leading scholarly journals and presses.
There are many reasons why PhD-granting departments with a strong reputation might have a lower level of per-faculty journal research activity.
Table 2 also reports the raw total of author- and journal-weighted publications and the relevant ranking of each PhD-granting political science department. The per-faculty measure accounts for productivity differences due to department size, and the total raw measure (arguably) captures the broad impact that department faculty members and other affiliates collectively have on scholarly communication in the discipline. The gap closes somewhat between the total research productivity measure for 19 leading scholarly journals and the USNWR ranking, particularly for larger political science departments. All but two of the top 10 departments on the USNWR reputational measure were ranked within the top 11 departments in terms of total author- and journal-weighted publications in our 19 political science journals. The two exceptions are Duke University (ranked 10th by USNWR and 18th on total journal research productivity) and Massachusetts Institute of Technology (ranked seventh and 45th). Although there are other surprises and numerous discrepancies, the rankings of political science departments in terms of total author- and journal-weighted publications in 19 political science journals seem to fit more closely with USNWR rankings.
RELATIONSHIP BETWEEN JOURNAL RESEARCH PRODUCTIVITY AND DEPARTMENT REPUTATION
What is the connection between per-faculty publications in 19 leading political science journals and the reputation of PhD-granting political science departments? We might assume that the most prestigious departments also would be the most productive. Exploring this question would be done best in the context of a full multivariate model (e.g., Garand and Graddy Reference Garand and Graddy1999), but a full complement of data for important independent variables is not available. Instead, we show the simple bivariate relationship between per-faculty journal research productivity and department reputation.
Figure 1 presents a scatterplot of the relationship between per-faculty author- and journal-impact weighted publications (x-axis) and the USNWR department reputational measure. The figure shows that there is a reasonably strong positive relationship between these two variables, which suggests that department reputation is associated with per-faculty journal research productivity. Simply stated, departments with high per-faculty publication rates in 19 leading political science journals are more likely to having higher USNWR ratings than those with lower publication rates. We generate predicted values on the dependent variable (represented by the regression line) based on the following ordinary least squares (OLS) regression estimates:
 $$ {\displaystyle \begin{array}{l}\mathrm{Reputation}=1.606+0.029\;\left(\mathrm{Journal}\ \mathrm{Research}\ \mathrm{Productivity}\right)\\ {}\hskip9.35em (21.80)\;(17.65){\mathrm{R}}^2=0.664\;\left(\mathrm{z}\;\mathrm{statistics}\ \mathrm{in}\ \mathrm{parentheses}\right)\end{array}} $$
Scatterplot for Relationship Between Per-Faculty Author-/Journal-Weighted Publications in 19 Political Science Journals and U.S. News & World Report Ratings of Doctoral Programs in Political Science
The relationship between per-faculty author- and journal-weighted publications and U.S. News & World Report ratings is represented by the following OLS regression estimates:
 $$ {\displaystyle \begin{array}{l}\mathrm{Reputation}=1.606+0.029\;\left(\mathrm{Journal}\ \mathrm{Research}\ \mathrm{Productivity}\right)\\ {}\hskip10em (21.80)\;(17.65){\mathrm{R}}^2=0.664\;\left(\mathrm{z}\;\mathrm{statistics}\ \mathrm{in}\ \mathrm{parentheses}\right)\end{array}} $$
Z statistics are calculated based on heteroskedastic robust standard errors.

Departments that are above the regression line are more highly evaluated by USNWR than what would be suggested by their journal-based research productivity; those departments below the line are less highly evaluated than their research productivity would suggest. This is all based on a simple bivariate model—no doubt there are other variables that predict reputational ratings that must be considered.
One way to ascertain the degree to which political science departments are ranked more or less highly than their journal research productivity suggests is to compare department rankings on the USNWR rating with department rankings on both the per-faculty and the raw total of author- and journal-weighted publications. Online appendix table A1 presents these comparisons, ranked by differences in prestige rankings and the raw-total publication rankings.Footnote 2 Small differences in rankings are inconsequential but larger differences suggest that a given department is outperforming or underperforming its USNWR rating. As shown, there are political science departments that are productive in terms of publications in leading political science journals but that are not highly rated by USNWR. These departments include Louisiana State University (ranked 44th in total weighted publications, ranked 81st by USNWR, for a ranking difference of 37); University of Alabama (31); Texas Tech University (23); Loyola University at Chicago (21); Texas A&M University (20); Southern Illinois University (19); University of New Mexico (19); University of Houston (19); University of New Orleans (17); and George Washington University (17). With the exception of Texas A&M University and perhaps George Washington University, few would suggest that these are among the leading PhD-granting political science departments in the country. However, in each case, there is a political science department that is reasonably productive in terms of publications in leading political science journals, despite having a lower reputational ranking.
On the flip side of the equation, there are departments whose relative reputations exceed their relative levels of journal research productivity by at least 25 ranking points: Brandeis University (ranked 76th by USNWR, 103rd in terms of journal research productivity, for a difference of ‑27); New School for Social Research (‑29); Northeastern University (‑33); Claremont Graduate University (‑37); Massachusetts Institute of Technology (‑39); Boston College (‑40); Johns Hopkins University (‑47); and Howard University (‑52). As discussed previously, these gaps could be due to various reasons, including a focus on book publication, high levels of funding for excellent graduate education, and the halo effect.
Moreover, the gaps between reputation and research productivity shift somewhat when author- and journal-weighted publications are adjusted for faculty size. Two smaller PhD programs—Louisiana State University and the University of New Mexico—have gaps between the USNWR reputational measure and the per-faculty research productivity measure of at least 50 rating points. Other relatively small departments have gaps of at least 30 points: University of Alabama (45); University of Kentucky (37); University of New Orleans (36); University of Missouri (36); University of Iowa (32); and University of Wisconsin, Milwaukee (31). It seems apparent that several departments with low prestige ratings that do particularly well in terms of journal research productivity on a per-faculty basis.
CHANGES IN JOURNAL RESEARCH PRODUCTIVITY OVER TIME
Because we have data for the period from 1990 to 2018, we also can consider changes in department research productivity in 19 leading political science journals over time and the connection of those productivity changes to the reputation of PhD-granting departments. Therefore, we divided our time frame into three decades (i.e., 1990–1999, 2000–2009, and 2010–2018) and calculated both per-faculty and total author- and journal-weighted publications for each PhD-granting department for each decade. This allows us to trace patterns of department journal research productivity over time. Online appendix table A3 presents data on per-faculty department publications for the entire period and for each of the three decades; online appendix table A4 presents data on total department publications for the same four periods. For the sake of brevity, we do not describe these results in detail; however, these two tables show that there is some movement in department research productivity over time. For example, Harvard University had the highest per-faculty journal research productivity over the entire period from 1990 to 2018 but Harvard was ranked 12th in per-faculty journal research productivity during the 1990s, fifth during the 2000s, and first during the 2010s. In terms of total publications, Harvard was ranked first for all years and for each of the three decades.
Online appendix table A5 reports changes in per-faculty publications from 1990–1999 to 2010–2018. At the top of the list are some of the prestige departments (e.g., Harvard University, Princeton University, and New York University); these are departments with very high rates of per-faculty journal productivity in the most recent decade. Some departments (e.g., Harvard University and Washington University at St. Louis) had reasonably high levels of per-faculty journal productivity in the 1990s and increased their already-high level of productivity, whereas other departments with lower levels of productivity in the 1990s (e.g., New York University and Southern Illinois University) exhibited strong increases as they moved into the 2010s. Conversely, some departments that were very productive in the 1990s (e.g., Stony Brook University, Rice University, University of North Texas, and University of Iowa) experienced a sharp decline in per-faculty publications as they moved into the 2010s. However, most of these departments retained reasonably high levels of per-faculty publications in the 2010s, even as they showed declines in journal-based research productivity from the 1990s.
Is there some level of consistency in research productivity across decades? Figures 2 and 3 are scatterplots of per-faculty journal publications from the 1990–1999 to 2000–2009 periods and the 2000–2009 to 2010–2018 periods, respectively. Figures 4 and 5 are the same scatterplots for the total journal publication measures. As shown in the two figures for per-faculty journal productivity, there is a positive relationship between productivity at time t-1 and productivity at time t. There also is a positive relationship between earlier and later research productivity, albeit with a fair amount of variability—particularly among those departments with the highest levels of research productivity in the earlier period. The model fits are reasonable, but there is substantial room for movement up or down among decades (i.e., R2=0.392 for the 1990s and 2000s; R2=0.598 for the 2000s and 2010s). It is interesting that the relationships between earlier and later journal research productivity are stronger for total journal publications than for per-faculty journal publications. As shown in figures 4 and 5, there is a strong relationship between total journal publications in the preceding and in the current decades. The model fits are stronger for the 1990s and 2000s (R2=0.709) and particularly for the 2000s and 2010s (R2=0.837) for total publication measures. Overall, the figures reveal that research productivity in one period carries over to the subsequent period; however, that relationship is stronger for total journal publications than for per-faculty journal publications.
Scatterplot of Relationship Between Per-Faculty Author- and Journal-Weighted Publications, 1990–1999 and 2000–2009
The relationship between 1990–1998 per-faculty author- and journal-weighted publications and 2000–2009 per-faculty author- and journal-weighted publications is represented by the following OLS regression estimates:
 $$ {\displaystyle \begin{array}{l}\mathrm{Weighted}\ \mathrm{publications}=6.817+0.823\;\left(\mathrm{Journal}\ \mathrm{Research}\ \mathrm{Productivity}\right)\\ {}\hskip18.5em (4.67)\;(8.12)\;{\mathrm{R}}^2=0.392\;\left(\mathrm{z}\;\mathrm{statistics}\ \mathrm{in}\ \mathrm{parentheses}\right)\end{array}} $$
Z statistics are calculated based on heteroskedastic robust standard errors.

Scatterplot of Relationship Between Per-Faculty Author- and Journal-Weighted Publications, 2000–2009 and 2010–2018
The relationship between 2000–2009 per-faculty author- and journal-weighted publications and 2010–2018 per-faculty author- and journal-weighted publications is represented by the following OLS regression estimates:
 $$ {\displaystyle \begin{array}{l}\mathrm{Reputation}=3.009+\mathrm{0.0.625}\;\left(\mathrm{Journal}\ \mathrm{Research}\ \mathrm{Productivity}\right)\\ {}\hskip10em (3.51)\;(11.84)\;{\mathrm{R}}^2=0.598\;\left(\mathrm{z}\;\mathrm{statistics}\ \mathrm{in}\ \mathrm{parentheses}\right)\end{array}} $$
Z statistics are calculated based on heteroskedastic robust standard errors.

Scatterplot of Relationship Between Total Author- and Journal-Weighted Publications, 1990–1999 and 2000–2009
The relationship between 1990–1998 author- and journal-weighted total publications and 2000–2009 author- and journal-weighted total publications is represented by the following OLS regression estimates:
 $$ {\displaystyle \begin{array}{l}\mathrm{Reputation}=40.284+1.101\;\left(\mathrm{Journal}\ \mathrm{Research}\ \mathrm{Productivity}\right)\\ {}\hskip10em (1.67)\;(13.56)\;{\mathrm{R}}^2=0.709\;\left(\mathrm{z}\;\mathrm{statistics}\ \mathrm{in}\ \mathrm{parentheses}\right)\end{array}} $$
Z statistics are calculated based on heteroskedastic robust standard errors.

Scatterplot of Relationship Between Total Author- and Journal-Weighted Publications, 2000–2009 and 2010–2018
The relationship between 2000–2009 author- and journal-weighted total publications and 2010–2018 author- and journal-weighted total publications is represented by the following OLS regression estimates:
 $$ {\displaystyle \begin{array}{l}\mathrm{Reputation}=11.423+0.947\;\left(\mathrm{Journal}\ \mathrm{Research}\ \mathrm{Productivity}\right)\\ {}\hskip10em (0.63)\;(21.79)\;{\mathrm{R}}^2=0.837\;\left(\mathrm{z}\;\mathrm{statistics}\ \mathrm{in}\ \mathrm{parentheses}\right)\end{array}} $$
Z statistics are calculated based on heteroskedastic robust standard errors.

What are the effects of levels of and changes in journal research productivity on changes in a department’s reputation? To consider journal publication effects on reputation changes, it is necessary to have data on department reputations from early in our analytical time frame (i.e., from the early 1990s) to go with our reputational measure from the USNWR in 2021. USNWR data for a full set of PhD-granting political science programs were not available in the 1990s; fortunately, there was an appropriate substitute: the 1993 NRC ratings of PhD-granting political science departments (National Research Council 1993). The NRC ratings are based on mean ratings of “scholarly quality of program faculty” for PhD-granting departments by a sample of political scientists, measured on a scale ranging from 0 (“not sufficient for graduate education”) to 5 (“distinguished”). The evaluation scale is sufficiently similar to the USNWR rating scale for inclusion of this variable in our models to capture consistency of ratings over time.
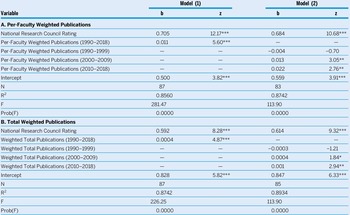
Table 3 reports the results from regression models in which 2021 USNWR ratings are depicted as a function of 1993 NRC ratings, per-faculty weighted journal publications (Part A) and weighted total publication (Part B). We estimate two models in each of Part A and Part B: the first with total publications from 1990 to 2018 as an independent variable and the second with separate measures for the decades 1990–1999, 2000–2009, and 2010–2018. As shown in the table, there was considerable inertia in subjective evaluations of department reputations from 1993 to 2021. The 1993 NRC rating variable has a strong positive effect on 2021 USNWR ratings in all four models, suggesting that a department’s reputation has considerable stability over time—beyond the effects of journal research productivity. Simply stated, departments with a strong reputation in the early 1990s also tend to have a strong reputation in 2021, even factoring in the effects of their relative research productivity. Furthermore, we find that journal publications for the time frame from 1990 to 2018 has a strong positive effect on 2021 USNRW ratings, for both per-faculty weighted publications (b=0.011, z=5.60) and total weighted publications (b=0.0004, z=4.87). This suggests that PhD-granting political science departments with a strong record of research productivity in 19 leading scholarly journals have a strong USNWR reputation, beyond the effect of previous reputations as captured by the 1993 NRC ratings. Moreover, there is a “what have you done lately for me” component to a department’s reputation. Research productivity in the most recent decade (2010–2018) has a stronger effect on 2021 USNRW ratings than research productivity in the immediately preceding decade (2000–2009). However, the later decade does retain some effect for both measures of our dependent variable. Overall, journal research productivity promotes stronger departmental reputations.
OLS Regression Estimates for Models of the Effect of Journal Publications and Previous Reputational Ratings on 2021 U.S. News & World Report Rankings

Notes: ***prob<0.001; **prob<0.01; * prob<0.05. Z statistics are calculated based on heteroskedastic robust standard errors.
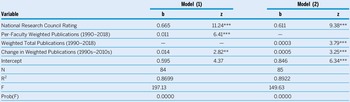
Finally, do departments undergoing rapid change in journal research productivity over time experience a shift in their subjective reputation that is commensurate with the direction of change? Table 4 presents estimates for an OLS regression model in which 2021 USNWR ratings are depicted as a function of 1993 NRC ratings, per-faculty weighted publications (1990–2018) (Model 1); weighted total publications (1990–2018) (Model 2); change in per-faculty weighted publications from the 1990s to the 2010s (Model 1); and change in weighted total publications from the 1990s to the 2010s (Model 2). Again, we find that 1993 NRC ratings are a strong predictor of 2021 USNWR reputational ratings, and both per-faculty weighted publications and weighted total publications have strong positive effects as well. However, to our point, we also find that departments that earn a substantial increase in per-faculty weighted journal publications (b=0.014, z=2.82) and in weighted total journal publications (b=0.0005, z=3.25) from the 1990s to the 2010s also exhibit a significantly higher USNRW rating than those departments with no change or with a decrease in journal research productivity. Indeed, our results also suggest that departments that exhibit a decrease in research productivity also would experience a lower department reputation.
OLS Regression Estimates for Models of the Effect of Journal Publications, Changes in Publications, and Previous Reputational Ratings on 2021 U.S. News & World Report Rankings

Notes: ***prob<0.001; **prob<0.01; *prob<0.05. Z statistics are calculated based on heteroskedastic robust standard errors.
CONCLUSION
This article contributes to previous research on the rankings of PhD programs in political science. Previous studies have differentiated rankings based on subjective evaluations (e.g., U.S. News & World Report 2022 and National Research Council 1993) from those based on “objective” evaluations linked to research productivity, job placement of graduate students, and other performance-based criteria (Ballard and Mitchell Reference Ballard and Mitchell1998; Garand and Graddy Reference Garand and Graddy1999; McCormick and Rice Reference McCormick and Rice2001; Teske Reference Teske1996). For our study, we used data on every article published in 19 leading general and subfield political science journals from 1990 to 2018 to build rankings of PhD-granting political science departments based on both their per-faculty and total publications. We weighted publications by the number of authors and by journal impact, as measured by Garand et al. (Reference Garand, Giles, Blais and McLean2009). We found that there is a reasonably strong relationship between research productivity and reputational rankings, the latter as based on the latest reputational measure from U.S. News & World Report (2022). There are cases in which departments with relatively high (low) journal research productivity have low (high) reputational rankings, which suggests that some research-active departments have weaker reputations than would be suggested by their publication record.
We found that there is a reasonably strong relationship between research productivity and reputational rankings, the latter as based on the latest reputational measure from U.S. News & World Report.
Of course, most evaluative measures of department performance have their limitations, and ours is no exception. We were unable to include data on book publications in measuring department research productivity, and there will be disagreement about which journals should be included in a journal-based productivity measure. Moreover, we weighted journal publications by the number of coauthors and journal impact, and we reported measures for both per-faculty and total weighted journal publications. All of these choices reflect competing values associated with different measures of research productivity. We suggest that our choices are reasonable, but we recognize that a measure of department research productivity will generate disagreement. In the spirit of resolving those disagreements, our summary data are available to interested scholars to consider the effects of different choices on department research productivity measures.
SUPPLEMENTARY MATERIALS
To view supplementary material for this article, please visit http://doi.org/10.1017/S1049096523000100.
ACKNOWLEDGMENTS
We thank Micheal Giles and Brian Hamel for their helpful comments on a previous draft of this article. We also thank the following for their assistance in data collection: Rebecca Bourgeois, Kallie Comardelle, Claire Evans, Scarlett Hammond, Brooke Hathaway, Hannah Lukinovich, Rebekah Myers, Jackie Odom, LaTerricka Smith, Naomi Smith, and Meredith Will. Finally, we thank two anonymous reviewers and the editors of this journal for constructive suggestions.
DATA AVAILABILITY STATEMENT
Research documentation and data that support the findings of this study are openly available at the PS: Political Science & Politics Harvard Dataverse at https://doi.org/10.7910/DVN/FFJWMF.
CONFLICTS OF INTEREST
The authors declare that there are no ethical issues or conflicts of interest in this research.