Introduction
Carbon quantum dots (CQDs) are a new type of carbon nanomaterial with particle sizes <10 nm and have attracted an increasing amount of attention due to their photoluminescence performance since their discovery from carbon nanotubes in 2004 [Reference Xu, Ray, Gu, Ploehn, Gearheart, Raker and Scrivens1]. When compared to traditional metal quantum dots, CQDs show great potential for wide application in the fields of fluorescent probes [Reference Hua, Yang, Zhu, Zhao and Yang2], bioimaging [Reference Zhuang, Guo, Zheng, Lin, Lin, Wang and Ni3], and medical diagnosis [Reference Ding, Du, Liu, Chen and Shen4], because of their excellent photochemical stability, low toxicity and good biocompatibility. In general, CQDs can be synthesized using two approaches, bottom-up and top-down. In the bottom-up process, CQDs are obtained from small-molecular weight substances, such as citric acid [Reference Dong, Shao, Chen, Li, Wang, Chi and Chen5], amino acids [Reference Pei, Zhang, Gao, Wu, Yang and Liu6], and glucose [Reference Yang, Wang, Yong, Wong, Zhang, Tan and Wang7], using hydrothermal synthesis [Reference Zhou, Lin, Ma, Shan, Feng, Chen and Qian8, Reference Liu, Zhang, Shi, Ji, Guo, Yuan and Hu9]. Disadvantages of this process are as follows: it needs high temperature (for hydrothermal), expensive raw materials, and so on. In the top-down process, raw carbon materials are reduced to the size of CQDs using physical or chemical methods, such as chemical oxidation [Reference Qiao, Wang, Gao, Li, Dai, Liu and Huo10], electrochemical oxidation [Reference Liu, Xu, Niu, Gooding and Liu11], laser etching [Reference Hu, Liu, Yang, Wang and Cao12], and arc discharge [Reference Xu, Sahu, Cao, Anilkumar, Tackett, Qian and Sun13]. Compared with the bottom-up method, this process usually uses cheap and environment friendly precursors, so it is widely used by many researchers.
The fluorescence properties of CQDs are mainly determined by their particle size [Reference Loh, Bao, Eda and Chhowalla14], the structure of the carbon atom domain and surface chemistry [Reference Zhu, Song, Wang, Wan, Zhang, Ning and Yang15]. Meanwhile, many methods have been employed to modify the surface of CQDs in order to improve their fluorescence properties. These methods include surface passivation [Reference Liang, Zeng, Cao, Wang, Wang and Sun16], chemical reduction [Reference Zheng, Wang, Long, Zhang, Huang and Zhu17], and heteroatom doping of CQDs [Reference Yeh, Teng, Chen and Teng18, Reference Dong, Pang, Yang, Guo, Shao, Chi and Yu19]. These ways all can change the surface chemistry of CQDs, but the effect of the microstructure on the fluorescence properties of CQDs has been rarely studied. Although Sourov Chandra et al. found a simple route to prepare different fluorescent carbon nanostructures by combustion of carbon xerogel [Reference Chandra, Mitra, Laha, Bag, Das, Goswami and Pramanik20], the reaction time is too long, so it is necessary to find a highly effective approach to obtain CQDs of different microstructures and explore their effect on fluorescence performance.
Chemical oxidation of traditional carbon precursors conventionally uses a top-down process to prepare CQDs due to the ease of availability of the raw materials. HNO3/H2SO4 and HNO3 are the most commonly used oxidants [Reference Wu, Wang, Wu, Hu, Wang, Zheng and Qiu21, Reference Liu, Ye and Mao22]. A variety of carbon precursors, such as petroleum coke, soot, activated carbon, and coal, have been used [Reference Qiao, Wang, Gao, Li, Dai, Liu and Huo10, Reference Wu, Wang, Wu, Hu, Wang, Zheng and Qiu21, Reference Liu, Ye and Mao22, Reference Dong, Lin, Chen, Fu, Chi and Chen23, Reference Hu, Yu, Li, Wang, Yang, Zhao and Qiu24]. Inherently, these carbon materials mainly consist of sp 2 hybridized carbon layers and/or graphite-like crystallites, whose dimensions and contents depend on the preparation process and carbonaceous precursors. The microstructure of CQDs depends on that of carbon precursors. Therefore, different species of carbon materials produce CQDs with different fluorescence properties. Heat treatment at high temperature is a common method to regulate the microstructure of carbon materials. Hu et al. [Reference Hu, Yu, Li, Wang, Yang, Zhao and Qiu24] have successively prepared fluorescent carbon dots with tunable sizes using chemical oxidation of heat-treated coal at temperatures up to 1500 °C. However, this strategy is limited by the oxidation ability of the HNO3 solution, and it is difficult to oxidize heat-treated char up to 2000 or 2500 °C. In fact, the structures of char, such as activated carbon and coal, produce a more pronounced change upon heat treatment at temperature >1500 °C when compared to that at temperature <1500 °C [Reference Kang, Bae and Lee25, Reference Feng, Bhatia and Barry26].
Recently, we developed an efficient oxidation approach using HNO3/HClO4 as the oxidant, which can rapidly decompose bulk char into crystallite-based nanosized materials [Reference Miao, Zuo, Zhao, Wang, Xia, Tan and Gao27]. During the oxidation process, a high yield of CQDs can be obtained in 30 min, which is much shorter than when using HNO3 solution as the oxidant. This oxidant system enabled our group to oxidize raw char that was highly graphitized upon heat treatment at a high temperature up to 2500 °C. Herein, we have employed the HNO3/HClO4 oxidant to etch activated carbon, which was subjected to heat treatment up to 2500 °C, to prepare CQDs with tunable fluorescence.
Results and discussion
Microstructure of the CQDs
Carbon materials with different degrees of graphitization can be obtained by high temperature treatment of activated carbon, and we used HNO3/HClO4 to oxidize these graphitized carbons to synthesize a high yield of CQDs with different microstructures and chemical structures.
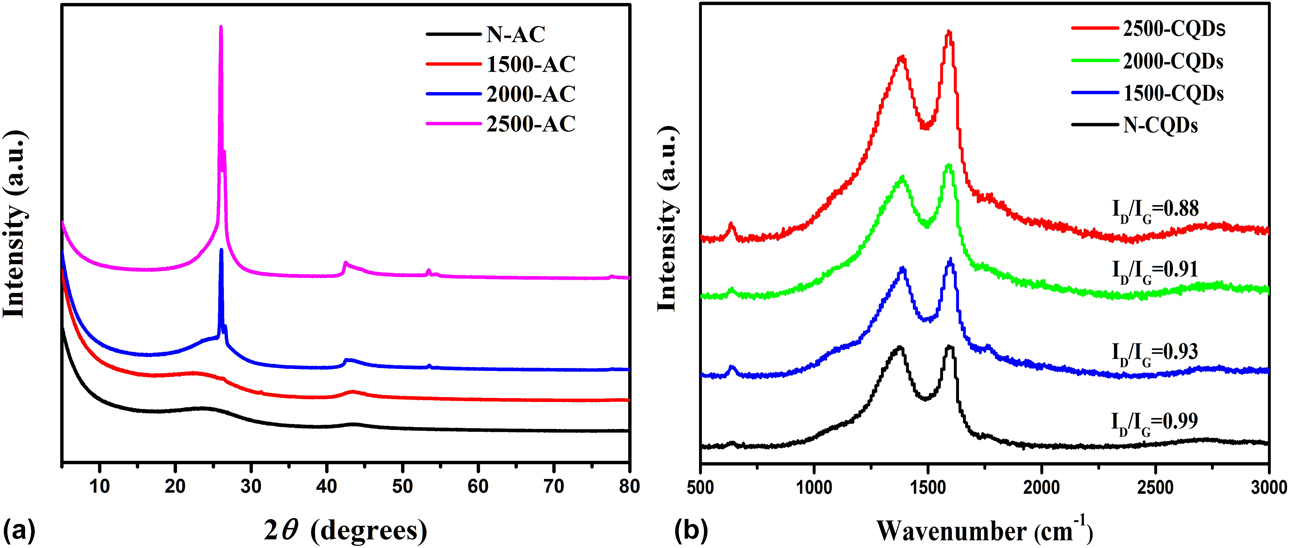
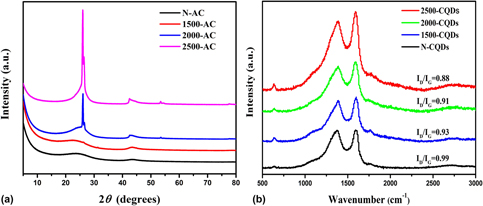
To study the effect of the graphitization degree of activated carbon on the microstructure of the CQDs, X-ray diffraction (XRD) and Raman spectroscopy were employed. Figure 1(a) shows the XRD spectra of the activated carbon precursors before and after the heat treatment step. The XRD patterns clearly show that heat treatment at temperatures >2000 °C results in a remarkable increase in the intensity of the (002) diffraction peak, which is wide and weak for pristine activated carbon and the precursor heat-treated at 1500 °C and becomes extremely sharp for the precursors heat-treated at 2000 and 2500 °C. This implies that heat treatment at >2000 °C triggers a remarkable graphitization of the activated carbon precursor [Reference Zhao, Yang, Li, Yu and Jin28].
(a) XRD patterns of the graphitized active carbon samples. (b) Raman spectra of the CQDs.

Raman spectroscopy [Fig. 1(b)] further confirmed the evolution of the microstructure of the CQDs upon increasing the heat treatment temperature of the activated carbon precursor. The Raman spectra recorded for all the CQDs present two clear bands at ∼1340 cm−1 (D band) and ∼1590 cm−1 (G band). Moreover, the intensity of the G band of the CQDs, which is assigned to the vibration of the conjugated sp 2 hybridized carbon atoms inside the carbon planar layers of the CQDs, was enhanced upon increasing the heat treatment temperature. The intensity ratio of the D to G bands (I D/I G) was decreased from 0.99 to 0.88 when the heat treatment temperature was increased to 2500 °C. These results demonstrate that CQDs with highly ordered carbon structures can be achieved through the high degree of graphitization of the carbon starting materials [Reference Kumar, Gaikwad, Mayyas, Sahajwalla and Joshi29].
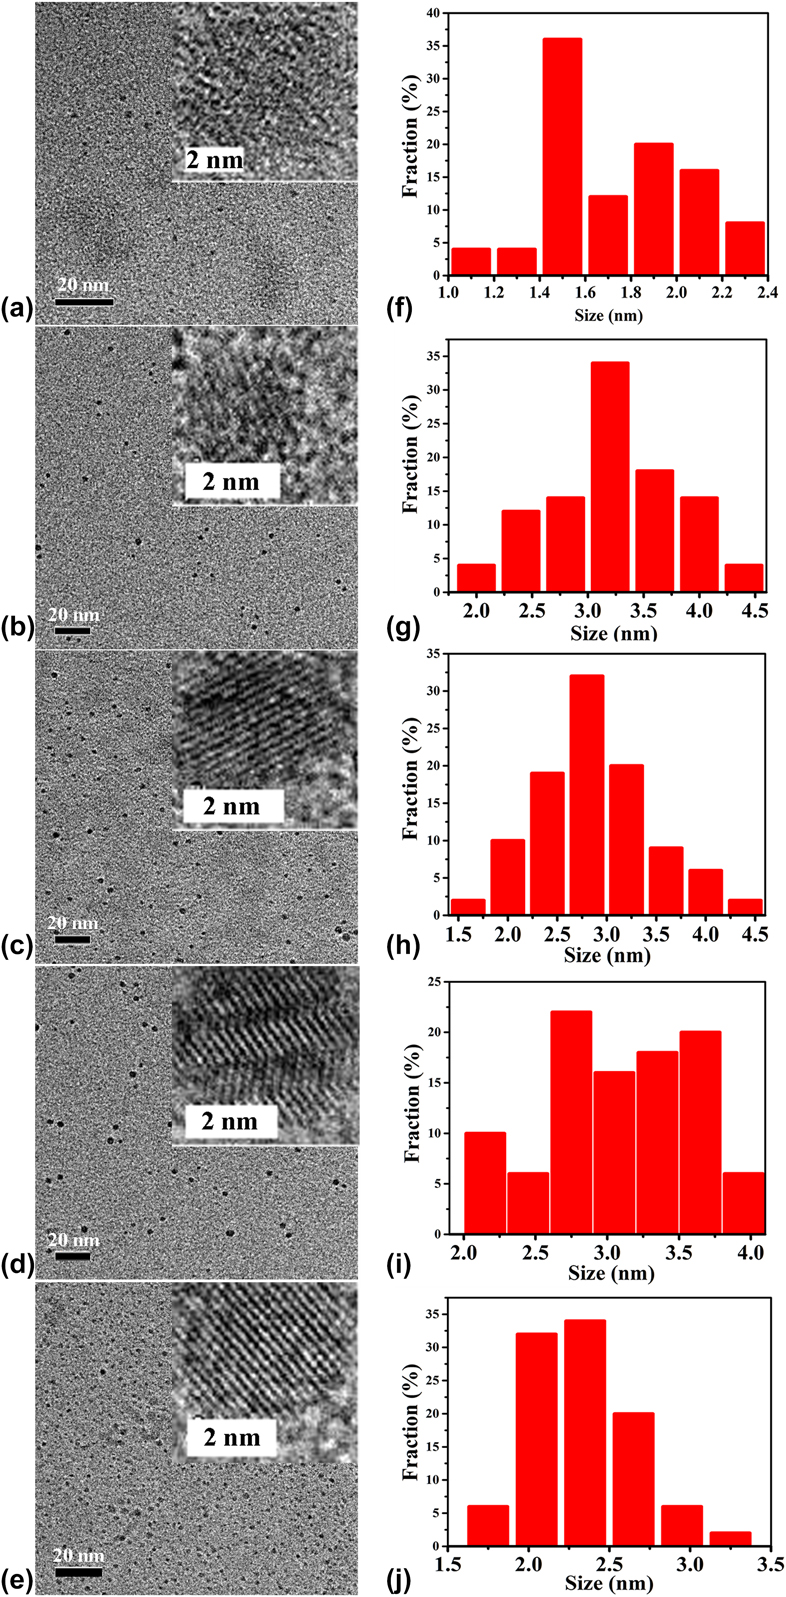
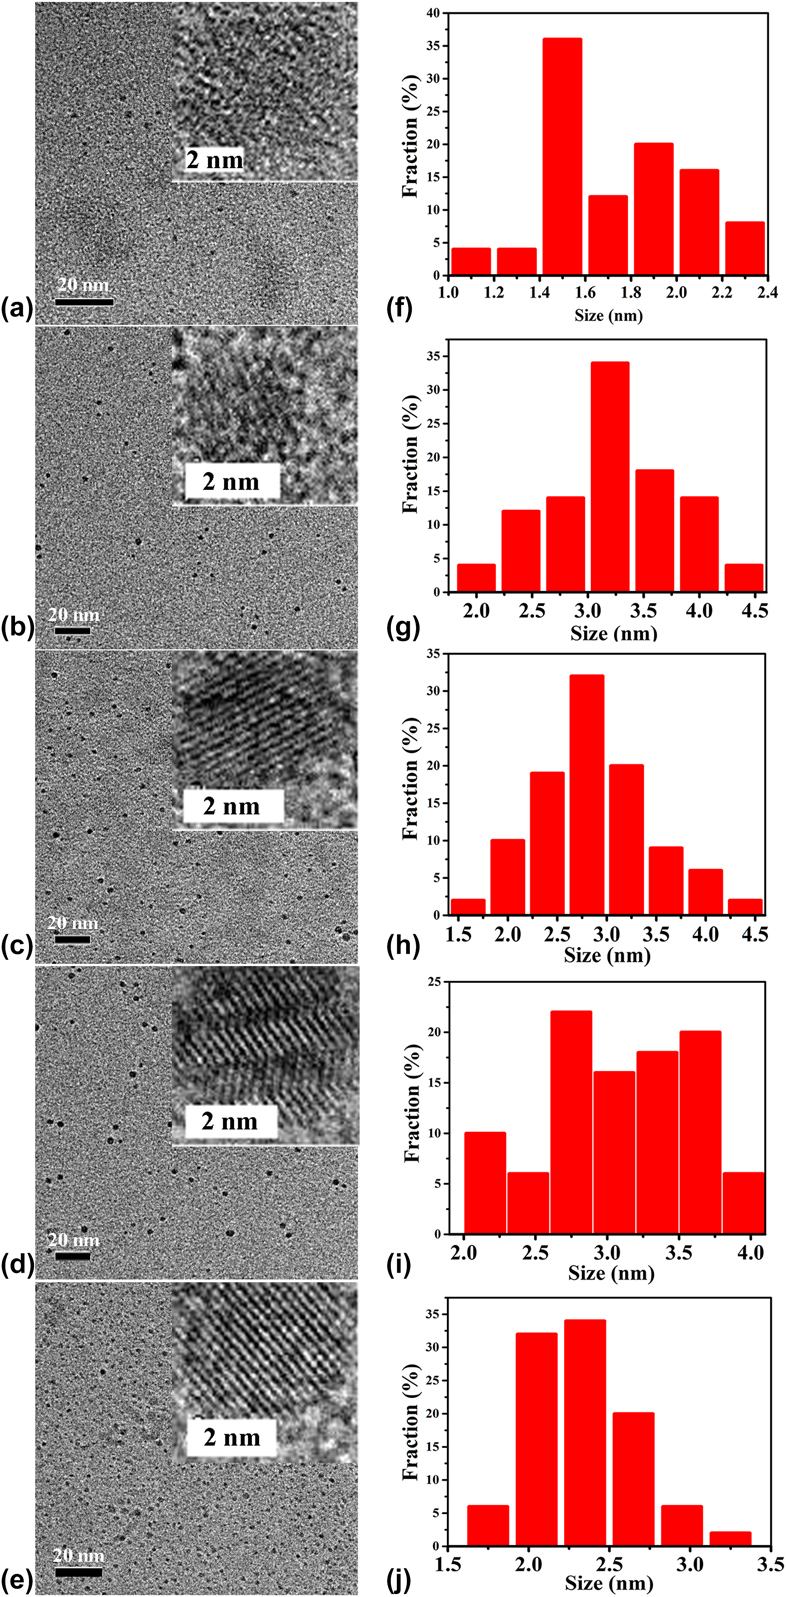
In order to explore the microstructure of CQDs, the CQDs were characterized by high-resolution transmission electron microscopy (HRTEM). Figure 2 shows the HRTEM images of the CQDs. It can be seen that the heat-treated activated carbon precursors produce CQDs of larger size, but the particle sizes of all the CQDs prepared in this study are <5 nm. Significantly, heat treatment of the activated carbon precursor at high temperature (>2000 °C) results in pronounced evolution of the microstructure of the obtained CQDs. It can be seen that the resulting CQDs possess clear lattice fringes when the activated carbon precursor was heat-treated at 2000 and 2500 °C, whereas the N-CQDs do not. This is consistent with the results based on the XRD patterns of the activated carbon precursors [Fig. 1(a)]. Undoubtedly, the CQDs inherit the ordered structure of the graphitized carbon precursor even if a strong oxidant (HNO3/HClO4) is applied to etch the starting carbon materials. A comparison between the HRTEM images of 2000-CQDs and 2000-rCQDs [Figs. 2(c) and 2(e)] shows that the reduction did not result in any change in the microstructure of the CQDs. These phenomena prove that high temperature can impact greatly on the size and order of graphite-like crystallites in activated carbon.
(a–e) HRTEM images of the N-CQDs, 1500-CQDs, 2000-CQDs, 2500-CQDs, and 2000-rCQDs, respectively. (f–j) Size distributions of the N-CQDs, 1500-CQDs, 2000-CQDs, 2500-CQDs, and 2000-rCQDs, respectively.
Surface chemistry of the CQDs
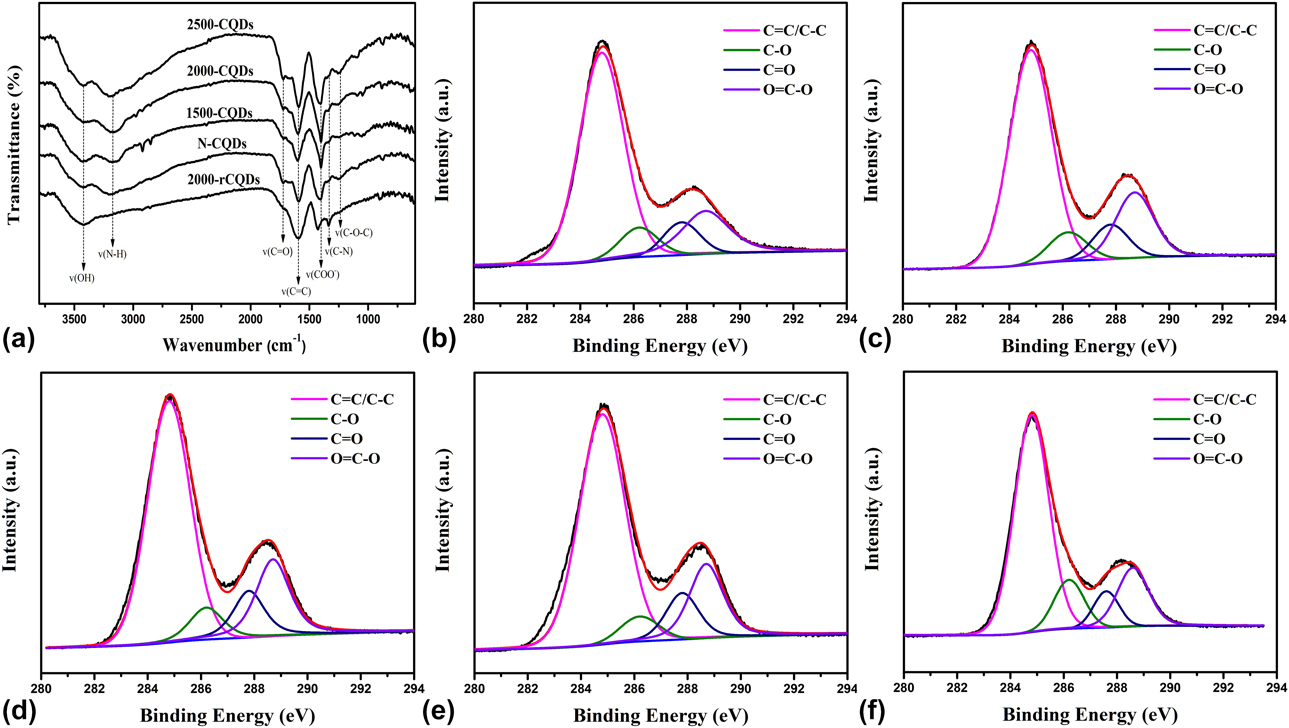
To explore the transformation of the chemical structure, the CQDs were further characterized by Fourier transform infrared spectroscopy (FTIR), X-ray photoelectron spectroscopy (XPS), and solid-state 13C NMR spectroscopy. The CQDs derived from pristine and graphitized activated carbon exhibit similar FTIR spectra [Fig. 3(a)]. They display peaks at 3400, 3175, 1720, 1595, 1400, 1335, and 1245 cm−1 with similar intensities, which are assigned to the vibration of –OH and N–H in NH4+, C=O in the ketones and aldehydes, C=C in the polyaromatic skeleton, –COO− in the carboxylate groups, C–N in the amino, and C–O in the epoxy groups, respectively [Reference Hu, Yu, Li, Wang, Yang, Zhao and Qiu24, Reference Miao, Zuo, Zhao, Wang, Xia, Tan and Gao27]. This implies that all the as-prepared CQDs have similar functional groups, and therefore, the high temperature heat treatment of the carbon precursor exerts a negligible effect on the types of surface functional groups of the CQDs.
(a) The FTIR spectra recorded for the CQDs. (b, c, d, e, f) High-resolution XPS C 1s spectra recorded for the N-CQDs, 1500-CQDs, 2000-CQDs, 2500-CQDs, and 2000-rCQDs, respectively.

XPS analysis of all the CQDs was performed to further investigate the surface chemistry of the CQDs. The XPS spectra show three peaks at 285, 532, and 401 eV (see Fig. S1, Supplementary material), which can be attributed to C 1s, O 1s and N 1s. The high-resolution C 1s spectrum [Figs. 3(b)–3(f)] can be deconvoluted into four peaks, which were assigned to C=C (∼284.8 eV), C–O (∼286.2 eV), C=O (∼287.8 eV), and O=C–OH (288.7 eV) [Reference Li, Hu, Zhao, Shi, Deng, Hou and Qu30]. The relative contents of the different binding energies of carbon atoms in the CQDs are listed in Table SI, which shows that the different CQDs have similar molar fractions of every carbon species with the exception that the relative molar fraction of C–O in the N-CQDs is higher than that of the others. This was attributed to the heat treatment step removing most of the oxygen atoms from the activated carbon precursor. The XPS curves of O 1s (Fig. S2) are deconvoluted into three peaks, including C=O in the carbonyl-containing functional groups (∼531.0 eV), C–O in the ether groups (∼531.6 eV), and hydroxyl (∼533.2 eV) [Reference Xu, Weinberg, Liu, Timpe, Schlögl and Su31]. Table SII shows that the relative molar fraction of C=O was improved from 30.0 to 64.5% upon increasing the graphitization temperature of the active carbon precursor, but the relative molar fraction of C–OH decreases from 37.6 to 14.1%. This indicates that the CQDs prepared from highly graphitized activated carbon have more carboxyl groups than the other oxygen-containing functional groups. The XPS curves of N 1s (Fig. S3) are deconvoluted into three peaks, including amine (∼399.5 eV), ammonium (∼401.4 eV), and nitro (∼405.7 eV). The relative mole fraction contents of nitrogen functional groups of CQDs are listed in Table SIII. As we can see, the CQDs prepared from graphitized carbon have similar nitrogen functional groups, but the content of ammonium in 2000-rCQDs is lower than that in 2000-CQDs; this is because of the reduction of NaBH4.
Figure 3(a) shows that NaBH4 reduction results in the disappearance of the vibration peak at 1715 cm−1 and an obvious decrease in the intensity of the vibration peak at 1215 cm−1, indicating that the carbonyl and epoxy groups were reduced to hydroxyl groups [Reference Zheng, Wang, Long, Zhang, Huang and Zhu17, Reference Zhu, Zhang, Tang, Qiao, Wang, Wang and Wang32]. The reduction in the peak intensity at 3400 and 1400 cm−1 was attributed to the removal of NH4+ by dialysis in the NaBH4 solution. There is a slight enhancement in the peak intensity at 1335 cm−1 because the content of NH4+ decreases. Figure 3(f) shows the C 1s spectrum of 2000-rCQDs, which has an increased molar content of C–O, but less C=O when compared to the 2000-CQDs. These results indicate that the carbonyl and epoxy groups are partially reduced to hydroxyls, which is consist with the FTIR results.
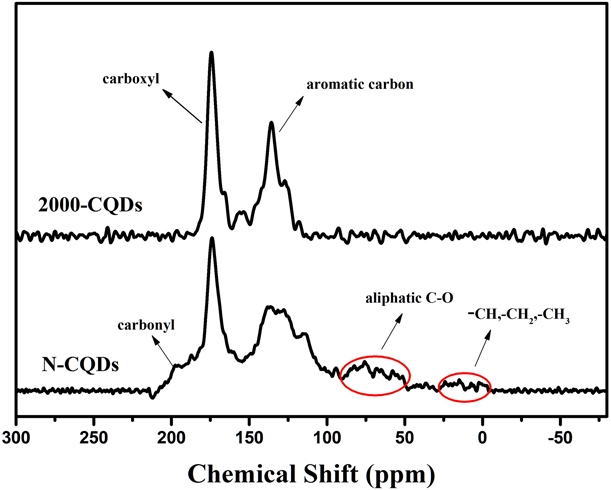
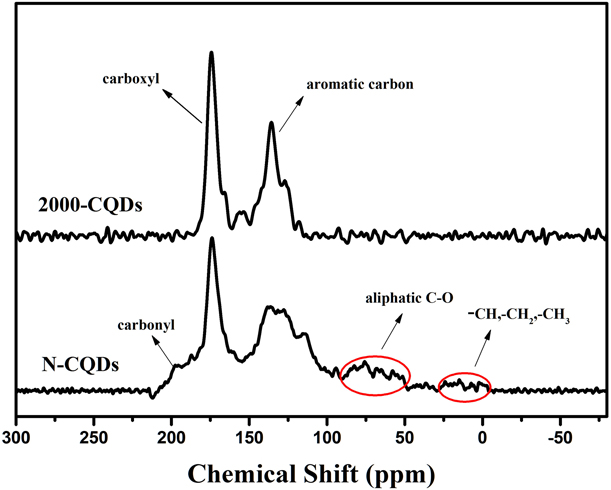
For further confirming the chemical structure of the synthesized CQDs, NMR spectra were also recorded. Figure 4 shows the solid-state 13C NMR spectra of the CQDs. It can be seen that there are two main peaks in the ranges of (100–150 ppm) and (160–186 ppm), which are related to the aromatic carbon and carboxyl atoms, indicative of a large number of carboxyl groups on the surface of the graphite-like microcrystals obtained via chemical oxidation. The 13C NMR spectrum of the N-CQDs displayed another three weak peaks at 0–50, 50–100, and 186–210 ppm, which correspond to aliphatic structures, aliphatic C–O, and carbonyl groups in ketones and aldehydes. However, these weak peaks disappeared in the 2000-CQDs and the peak corresponding to bridged aromatic carbons (130–150 ppm) becomes obvious and sharp. This phenomenon indicates that heat treatment at 2000 °C can remove the oxygen-containing functional groups and alkanes in the carbon structure and increase the aromatic cluster structures [Reference Cheng, Wartelle, Klasson and Edwards33, Reference Chen, Wang, Pan, Yang, Zhang and Zhang34].
Solid-state 13C NMR spectra recorded for the N-CQDs and 2000-CQDs.
Optical properties of the CQDs
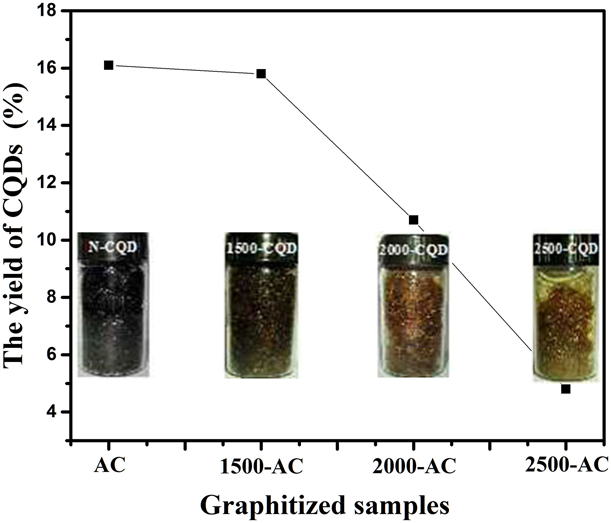
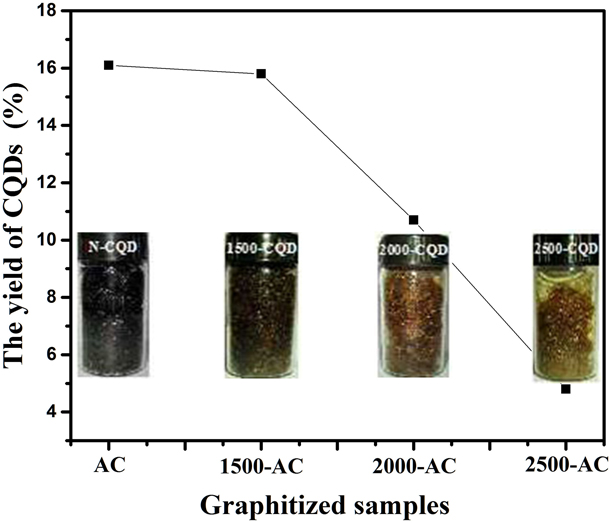
CQDs were produced from the heat-treated activated carbon precursors via oxidation using a HNO3/HClO4 solution for 2 h, and a series of CQD samples with different yields were obtained. Figure 5 shows the yield of CQDs and their optical photographs. The color of the CQDs gradually changed from black to yellow and then golden yellow, revealing that the heat treatment of the activated carbon precursor has a significant effect on the luminescence properties of the CQDs. The yield of CQDs decreased with an increase in the heat treatment temperature because it improved the resistance of carbons to oxidation. However, the yield of the resulting CQDs still reached 11% even if the activated carbon precursor was heat-treated at 2000 °C. Previous investigations have showed that CQDs with a yield of <7% can be produced from heat-treated coal (1500 °C) via HNO3 oxidation for 24 h [Reference Hu, Yu, Li, Wang, Yang, Zhao and Qiu24]. Therefore, it is certain that the oxidization system used herein (HNO3/HClO4) is more effective toward etching the bulk carbon material than the previously used oxidant (HNO3).
The yields of the CQDs prepared from the different graphitized samples.
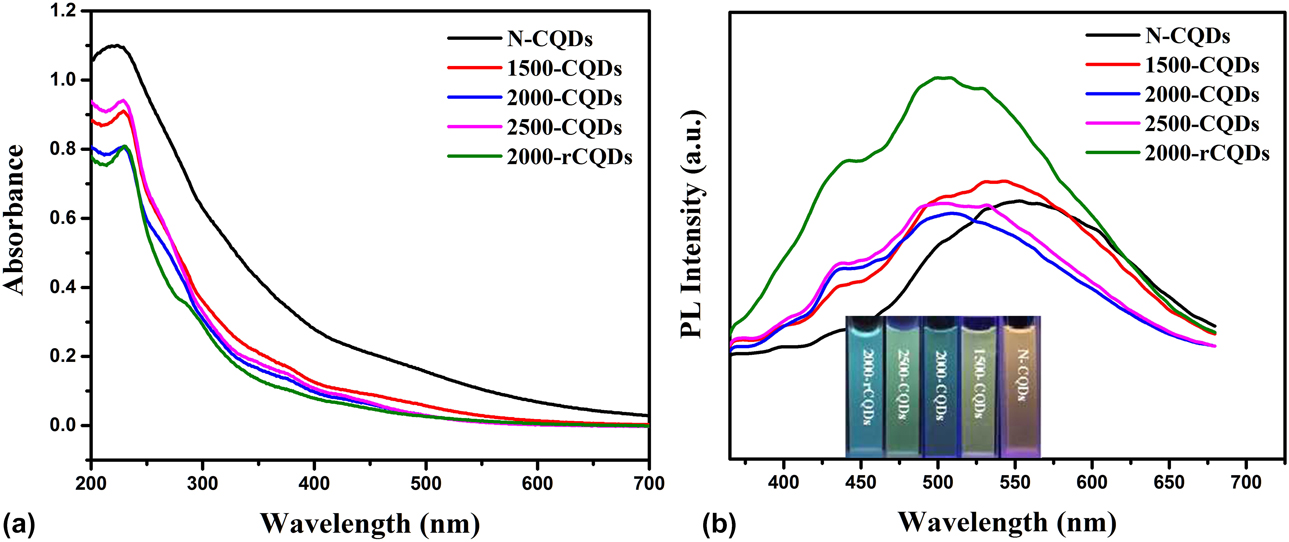
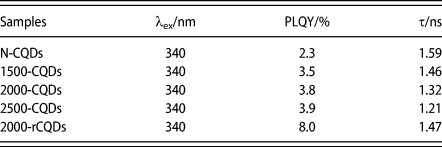
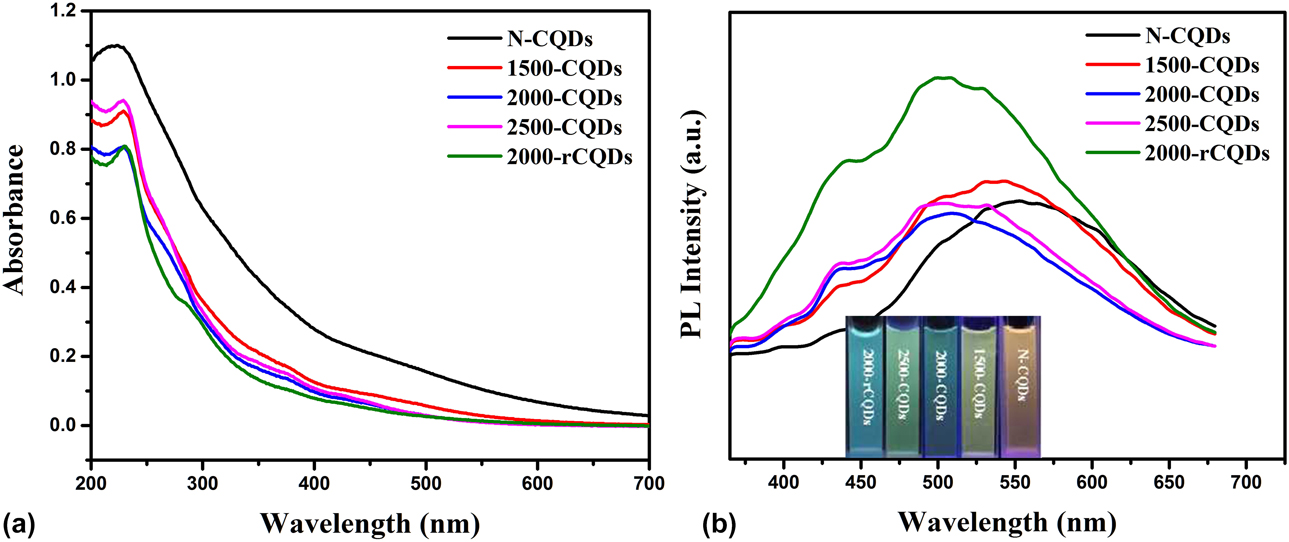
High-temperature heat treatment of activated carbon can affect the microstructure and surface chemistry of CQDs; the CQDs prepared from a higher degree of graphitized carbon have a more ordered microstructure with more carboxyl groups on the surface, which have an important effect on the fluorescence properties of CQDs. Figure 6 shows the UV–visible absorption spectra and the photoluminescence (PL) emission spectra of the CQDs. Figure 6(a) shows that the N-CQDs have an obvious absorption peak at 222 nm, which can be attributed to π–π* electronic transition in the polycyclic aromatic hydrocarbon C=C bonds (sp 2 domains) [Reference Wu, Wang, Wu, Hu, Wang, Zheng and Qiu21]. When the activated carbon precursor was heat-treated at >1500 °C, the absorption spectra of the obtained CQDs show a slight red shift to 230 nm. The reduction, however, did not change the position of the UV–visible adsorption peak. The aqueous solutions of N-CQDs, 1500-CQDs, 2000-CQDs, and 2500-CQDs emit yellow, yellow-green, green, and blue-green fluorescence under UV irradiation at 365 nm [Fig. 6(b)]. The PL spectra of the N-CQDs exhibit a wide and strong emission peak at 555 nm under UV irradiation at 350 nm. However, this major emission peak observed for the 1500-CQDs, 2000-CQDs, 2500-CQDs, and 2000-rCQDs produces a blue shift to 530 nm, 504 nm, 500 nm, and 498 nm, respectively, accompanied by the appearance of a minor peak at around 440 nm. Moreover, the intensity of the minor peak becomes more obvious with an increase in the heat treatment temperature used for the activated carbon precursor. The chemical reduction of the CQDs remarkably strengthened the intensity of the peaks observed at 440 and 498 nm. A previous investigation suggested that the minor emission peaks in the CQDs PL spectra can be ascribed to sp 2-hybridized carbon domains [Reference Hu, Yu, Li, Wang, Yang, Zhao and Qiu24]. Therefore, the increased intensity of the minor peak can be explained by the increase in the ordered structure of the sp 2-hydbrized carbon domains in the CQDs because of the increased heat treatment temperature. The chemical reduction step is beneficial for eliminating the surface defects in the CQDs and thus enhances the photoluminescence intensity of the CQDs [Reference Zhu, Zhang, Tang, Qiao, Wang, Wang and Wang32]. From Fig. S4, we can know that the CQDs we prepared are excitation wavelength-independent. The fluorescence quantum yield (QY) and average lifetime of the CQDs are listed in Table I. It can be seen that the heat treatment of the activated carbon precursor at high temperature led to an increase in the QY of the resulting CQDs; compared with coal [Reference Hu, Yu, Li, Wang, Yang, Zhao and Qiu24], the QY is relatively high; however, it cannot exceed the QY of petroleum coke and graphene quantum dots [Reference Wu, Wang, Wu, Hu, Wang, Zheng and Qiu21, Reference Zhu, Zhang, Qiao, Tang, Li, Yuan and Gao35]. Noticeably, the reduction of 2000-CQDs using sodium borohydride results in a remarkable increase in the QY from 3.9 to 8.0% with a slight increase in the lifetime (Fig. S5).
(a) The UV-visible spectra recorded for the CQDs. (b) The PL photoluminescence emission spectra recorded for the CQDs.
The PLQY and average lifetime values of CQDs.

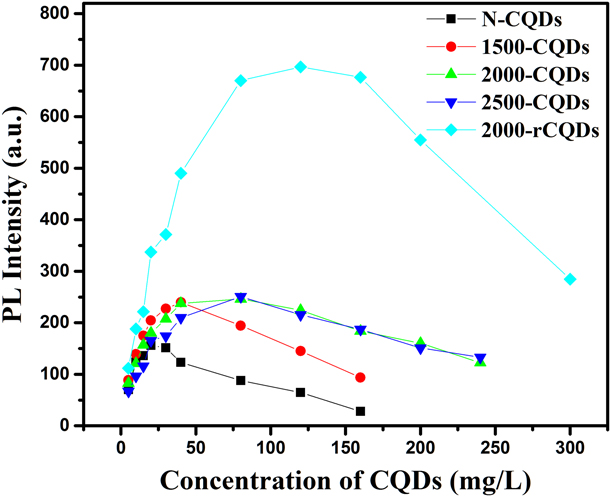
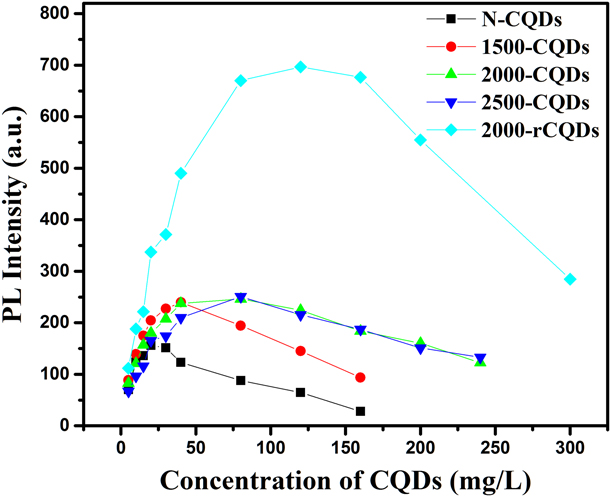
It is well known that fluorescence self-absorption quenching may occur with an increase in the concentration of the CQD solution because the concentration can affect the interparticle distance in solution. A high concentration reduces the interparticle distance and increases the interaction among the particles, resulting in a red shift and decrease in the PL intensity due to the suppression of the radiation process [Reference Wang, Hu, Wen, Zhou, Wang, Wu and Wang36]. Figure 7 shows that the heat treatment of the carbon starting materials at high temperature not only leads to an increase in the emission intensity but is also beneficial for reducing the fluorescence self-absorption quenching process in high concentration CQD solutions, especially for the 2000-CQD and 2500-CQD samples. More obviously, the reduction of the CQDs using sodium borohydride further reduced the fluorescence self-absorption quenching process when compared to the high temperature heat treatment of the carbon precursors. The concentrations of the CQD solution in which fluorescence quenching begins to appear are 20 mg/L for N-CQDs, 40 mg/L for 1500-CQDs, 80 mg/L for 2000-CQDs and 2500-CQDs, and 120 mg/L for 2000-rCQDs. This remarkable increase in the threshold concentration for fluorescence self-absorption quenching may be attributed to the sp 2 carbon clusters of larger sizes in the activated carbon precursors with a higher degree of graphitization, which promote radiation recombination [Reference Eda, Lin, Mattevi, Yamaguchi, Chen, Chen and Chhowalla37].
The effect of the CQD concentration on the fluorescence intensity in aqueous solution.
Cytotoxicity and cell imaging
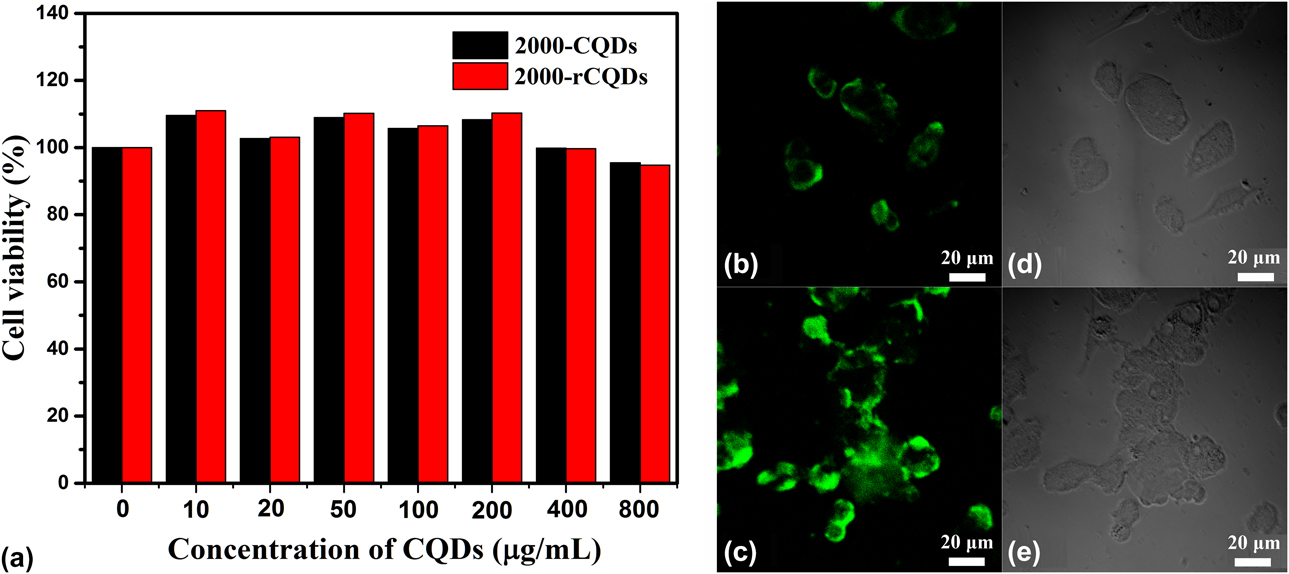
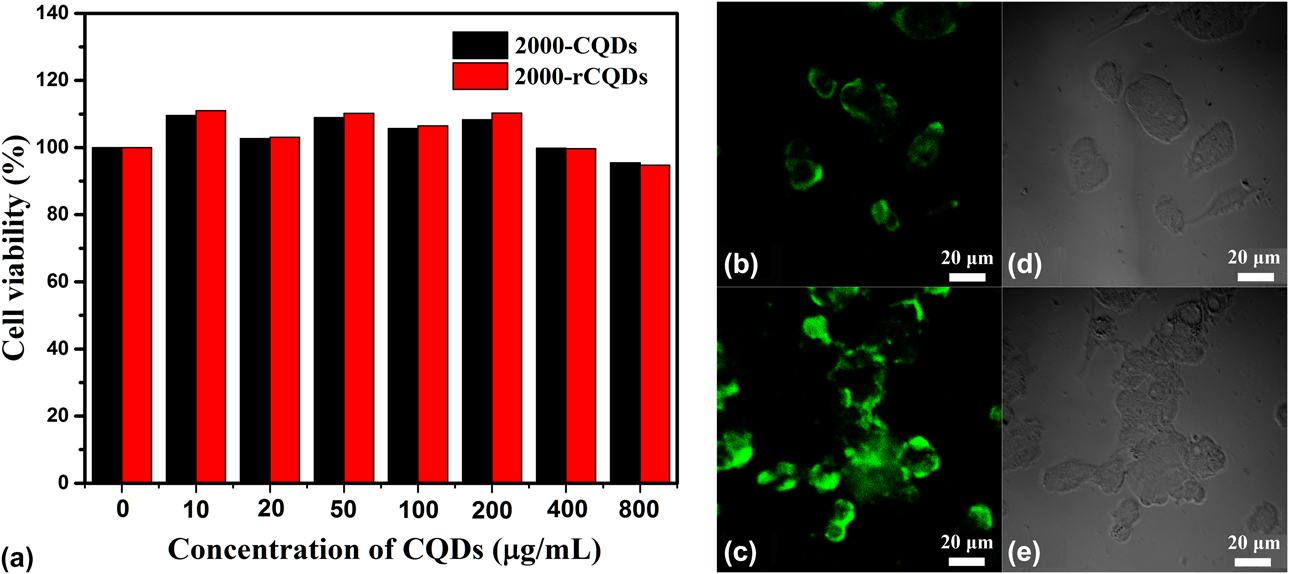
We evaluated the cytotoxicity of 2000-CQDs and 2000-rCQDs using HepG2 cells. Figure 8(a) shows the cell viability of the HepG2 cells in the presence of the 2000-CQD and 2000-rCQD solutions at different concentrations. The cell viability was almost 100% in the CQD solutions at concentrations <400 μg/mL, and a 95% cell viability was observed at 800 μg/mL, which is higher than that reported previously [Reference Zhuang, Guo, Zheng, Lin, Lin, Wang and Ni3, Reference Zhu, Zhang, Qiao, Tang, Li, Yuan and Gao35, Reference Wu, Wang, Han, Zhou, Guo and Zhang38]. This indicates that the as-prepared CQDs have no cytotoxicity. Figures 8(b) and 8(c) show the images of the HepG2 cells recorded at an excitation wavelength of 488 nm after being incubated with the CQD solutions for 48 h. HepG2 cells emit bright green fluorescence at an excitation wavelength of 488 nm. The HepG2 cells in 2000-rCQDs emit a stronger green fluorescence than those in 2000-CQDs, possibly because of the higher QY of the 2000-rCQDs (Table S1). The strong green color was distributed in the cytoplasm, indicating that the CQDs were successfully translocated into the inside of the cells via the cell membrane. This result shows that the CQDs have good biocompatibility and photostability and can be used in bioimaging.
(a) The cytotoxicity of the 2000-CQDs and 2000-rCQDs. (b, c, d, e) The cell imaging of the 2000-CQDs and 2000-rCQDs on HepG2 cells: (b, c) Washed HepG2 cells imaged under excitation at 488 nm. (d, e) The bright field images of the 2000-CQDs and 2000-rCQDs.
Conclusions
We have prepared CQDs via chemically etching graphitized activated carbon using HNO3/HClO4 as the oxidant. The fluorescence of the CQD solution can be tuned from yellow to green by regulating the degree of graphitization of the carbon precursor upon heat treatment at high temperatures up to 2500 °C without any surface passivation. Moreover, CQDs with microdomains of highly ordered carbon planar layers can be obtained from a highly graphitized carbon precursor. The degree of graphitization of the activated carbon precursor has a significant effect on the particle size and fluorescence properties of the resulting CQDs. The increased degree of graphitization of the carbon precursor is beneficial for significantly reducing fluorescence self-absorption quenching in the concentrated CQD solution. In addition, chemical reduction of the CQDs using sodium borohydride as the reducing agent can further improve the fluorescence properties of the CQDs. Furthermore, the as-prepared CQDs have no cytotoxicity and can be used as bioimaging agents.
Experimental
Materials
Commercial coconut shell activated carbon was purchased from Jiangsu Youhuada Environmental Protection Material Technology Co. Ltd. (Taizhou, China). All chemical reagents were of analytical grade and used as received without any further purification. Nitric acid (HNO3), perchloric acid (HClO4), ammonia (NH3·H2O) and sulfuric acid (H2SO4) were purchased from Nanjing Chemical Reagent Co., Ltd. (Nanjing, China). Sodium borohydride (NaBH4) was purchased from Sinopharm Chemical Reagent Co. Ltd. (Shanghai, China). Quinine sulfate was purchased from China Institute of Metrology. Ultra-pure water was prepared using a Unique-R20 system and used in all our experiments.
Heat treatment of activated carbon
Heat treatment of activated carbon was conducted using a graphitization furnace (Zhuzhou Guangjichang Technology Company, China). In a typical procedure, about 250 g of coconut shell activated carbon was placed in a graphite crucible, heated to a given temperature (1500–2500 °C) at a heating rate of 5 °C/min under a high-purity argon atmosphere, and kept at this temperature for 4 h. After cooling to room temperature under a flow of argon, the heat-treated activated carbon was removed.
Synthesis of CQDs
CQDs were synthesized from activated carbon using HNO3/HClO4 as the oxidant according to a previously published procedure [Reference Miao, Zuo, Zhao, Wang, Xia, Tan and Gao27]. Briefly, 50 mL of concentrated HNO3 and HClO4 at a molar ratio of 1:1 was mixed with 2.00 g of coconut shell activated carbon in a 100 mL round-bottom flask. Oxidation was carried out under microwave radiation heating (500 W) at 100 °C for 120 min under magnetic stirring (500 rpm). After cooling, the black suspension was neutralized with ammonium hydroxide to pH 7.0 and then separated using a 1000 Da ultrafiltration membrane in an MSC300 ultrafiltration device. The filtrate was concentrated in vacuo and then dialyzed with a molecular weight cut-off of 300 for 3 days to remove the inorganic ions. Finally, pure CQDs were obtained and denoted as 1500-CQDs, 2000-CQDs, and 2500-CQDs, where the number indicates the heat treatment temperature of the activated carbon used. The CQDs prepared from untreated activated carbon were denoted as N-CQDs, and 2000-CQDs were reduced using NaBH4. Briefly, 0.1 g of NaBH4 was added to a beaker containing 50 mL of 1 mg/mL 2000-CQD suspension, and the resulting suspension was stirred for 5 h at room temperature. The mixture was transferred into a dialysis bag and dialyzed for 3 days. Finally, the solution was freeze-dried to obtain reduced 2000-CQDs, which were named 2000-rCQDs.
Characterization of the CQDs
The morphology and structure of the CQDs were characterized using the following methods. The CQDs were observed using high-resolution transmission electron microscopy (HTEM) on an JEM-2100UHR electron microscope operated at 200 kV (JEOL, Tokyo, Japan). Elemental analysis was carried out on an Elementar Vario EL Cube elemental analyzer (Elementar, Hanau, Germany). Fourier transform infrared (FTIR) spectra were recorded on a NICOLET 360 infrared spectrometer (Thermo Nicolet Corporation, Madison, Wisconsin, USA). X-ray diffraction (XRD) was carried out on a Rigaku Ultima IV X-ray diffractometer (Rigaku, Tokyo, Japan) using graphite monochromatized Cu Kα irradiation (λ = 1.54 Å). Solid-state 13C NMR spectroscopy was recorded at room temperature on an Agilent 600 DD2 spectrometer at a resonance frequency of 150.15 MHz (Agilent, PaloAlto, California, USA). Cell Counting Kit-8 (Shanghai hua yaichuang biotechnology co., Ltd, Shanghai, China). The optical density (OD) of the resulting mixture in every well was measured using a MUTISKAN MK3 microplate reader at a wavelength of 450 nm (Thermo scientific, Shanghai, China) XPS was performed on a Shimadzu AXIS UltraDLD X-ray photoelectron spectrometer (Kyoto, Japan). FTIR were recorded on a NICOLET 360 infrared spectrometer. XRD was carried out on a Rigaku Ultima IV X-ray diffractometer using graphite monochromatized Cu Kα irradiation (λ = 1.54 Å). Solid-state 13C NMR spectroscopy was performed at room temperature on an Agilent 600 DD2 spectrometer at a resonance frequency of 150.15 MHz. The powder of N-CQDs and 2000-CQDs were packed into a probe with a diameter of 4 mm and scan 2048 circles under the span frequency of 15 kHz in solid-state 13C NMR spectrometer.
UV/Vis absorption spectroscopy was performed on a Shimadzu UV-2450 UV-vis spectrophotometer (Tokyo, Japan). Fluorescence spectroscopy was recorded on a PE LS55 fluorescence spectrophotometer (PE Corporation, Waltham, Massachusetts, USA). The time-resolved fluorescence intensity decay of the CQDs was determined on a FM-4P-TCSPC fluorescence spectrofluorometer (Horiba Jobin Yvon, Paris, France) at an excitation wavelength of 350 nm.
QY measurements
The relative fluorescence QY of the CQDs was measured using quinine sulfate in 0.1 M H2SO4 (QY 54%) as a standard. The fluorescence QYs of the CQDs in water were calculated according to the following formula [Reference Hu, Yu, Li, Wang, Yang, Zhao and Qiu24]:
 $$\Phi \; = \;{\Phi _{\rm{s}}}\left( {{I / {{I_{\rm{s}}}}}} \right)\left( {{A / {{A_{\rm{s}}}}}} \right){\left( {{{{n_{\rm{s}}}} / n}} \right)^2}\quad ,$$
where  $\Phi$ is the fluorescence QY, I is the measured integrated area of the fluorescence emission spectrum, n is the refractive index of the solvent (1.33 for water), and A is the optical density (OD) measured using UV-vis spectrophotometry. The subscript “s” refers to the reference standard with a known QY. In order to minimize the reabsorption effects, the absorbance of the reference and sample solutions was kept under 0.1 at an excitation wavelength of 340 nm.
Cytotoxicity testing
The cell toxicity of the CQDs was evaluated using a Cell Counting Kit-8 (CCK-8) assay [Reference Zhang, Cui, Song, Liu and Hu39]. Briefly, human cervical cancer cells (HepG2) were added to a 96-well cell culture plate at a density of 5000 cells/well with 100 μL of minimum essential medium (MEM) containing 10% fetal bovine serum and 1% penicillin/streptomycin solution. The mixtures were cultured in a 5% CO2 incubator at 37 °C and grown for 24 h. After cell growth in the 96-well cell culture plate, the culture medium was replaced by 200 μL of MEM containing the CQD suspension at different concentrations (0, 10, 20, 50, 100, 200, 400, and 800 μg/mL), and the cells were cultured for another 48 h to evaluate the cytotoxicity. The blank control groups were cultivated under the same conditions without adding the CQDs. Then, 10 μL of CCK-8 solution was added into each well of the 96-well cell culture plate and further incubated for an additional 4 h in a 5% CO2 incubator at 37 °C to stain the living cells. The OD of the resulting mixture in every well was measured using a Thermo Scientific (MULTISKAN MK3) microplate reader at a wavelength of 450 nm, and the cell viability was estimated using the following equation:
 $${\rm{Cell}}\;{\rm{viability}}(\% ){\rm{\ }} = {\rm{\ }}\left( {{{\left[ {{\rm{OD}}} \right]{\rm{test}}} / {\left[ {{\rm{OD}}} \right]{\rm{control}}}}{\rm{\ }}} \right)\; \times \;100\% \quad ,$$
where ODcontrol was obtained in the absence of the CQDs and ODtest was obtained in the presence of the 2000-CQDs and 2000-rCQDs.
Cell imaging
HepG2 cells were added to a 24-well cell culture plate at a density of 104 cells/well with 500 μL MEM containing 10% fetal bovine serum and 1% penicillin/streptomycin solution. The resulting mixtures were then cultured in a 5% CO2 incubator at 37 °C and grown for 5 h. After the cells attached to the pore wall, the culture medium was replaced by 500 μL of MEM containing the 2000-CQDs and 2000-rCQDs at a concentration of 200 μg/mL, and the cells were incubated for another 48 h to allow the CQDs to enter into the cells. The culture medium in the 24-well cell culture plate was removed, and 250 μL of 4% paraformaldehyde was added into each well to allow the cells to be fixed on the glass slide for 20 min at room temperature. Finally, the cells on the glass slide were washed three times with PBS and then observed using a Nikon Ti-E-A1R laser scanning confocal microscope with excitation at 488 nm.
Supplementary material
To view supplementary material for this article, please visit https://doi.org/10.1557/jmr.2019.261.
Acknowledgments
We acknowledge the financial support from the National Natural Science Foundation of China (Grant No. 31470600) and the Jiangsu natural science youth fund project (Grant No. BK2017).